Measurement of antiproton production in ${\rm p He}$ collisions at $\sqrt{s_{NN}}=110$ GeV
[to restricted-access page]Information
LHCb-PAPER-2018-031
CERN-EP-2018-217
arXiv:1808.06127 [PDF]
(Submitted on 18 Aug 2018)
Phys. Rev. Lett. 121 (2018) 222001
Inspire 1688924
Tools
Abstract
The cross-section for prompt antiproton production in collisions of protons with an energy of $6.5$ TeV incident on helium nuclei at rest is measured with the LHCb experiment from a data set corresponding to an integrated luminosity of $0.5 nb^{-1}$. The target is provided by injecting helium gas into the LHC beam line at the LHCb interaction point. The reported results, covering antiproton momenta between $12$ and $110 \mathrm{GeV/}c$, represent the first direct determination of the antiproton production cross-section in ${\rm p He}$ collisions, and impact the interpretation of recent results on antiproton cosmic rays from space-borne experiments.
Figures and captions
|
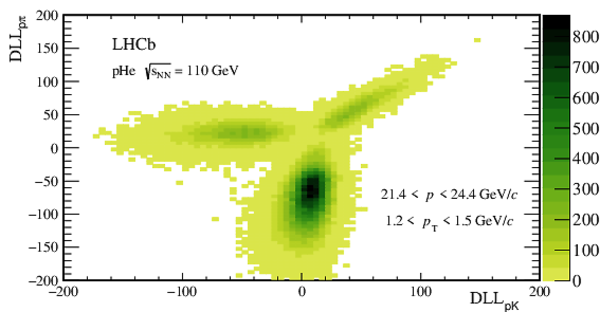
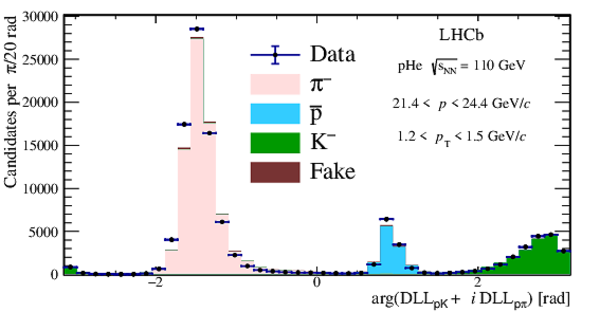
Two-dimensional template fit to the PID distribution of negatively charged tracks for a particular bin ( $ 21.4 < p < 24.4 {\mathrm{ Ge V /}c} $, $1.2 < p_{\mathrm{ T}} < 1.5 {\mathrm{ Ge V /}c} $). The ( $\mathrm{DLL_{pK}}$ , $\mathrm{DLL_{p\pi }}$ ) distribution, shown in the top plot, is fitted to determine the relative contribution of $\pi ^-$ , $ K ^-$ and $\overline p $ particles, using simulation to determine the template distributions and the fraction of fake tracks (which are barely visible). In the bottom plot, the result of the fit is projected into the variable $\arg{(\mathrm{DLL_{pK}} + i \mathrm{DLL_{p\pi }} )}$. |
dllPlo[..].pdf [21 KiB] HiDef png [234 KiB] Thumbnail [227 KiB] *.C file |
|
|
phiPID[..].pdf [18 KiB] HiDef png [150 KiB] Thumbnail [132 KiB] *.C file |
|
|
|
Distributions of (left) momentum and (right) transverse momentum for (top) single electron and single positron candidates, and (bottom) background-subtracted electron candidates, compared with the distributions in simulation, which are normalized to the data yield. |
elekin[..].pdf [34 KiB] HiDef png [373 KiB] Thumbnail [290 KiB] *.C file |

|
|
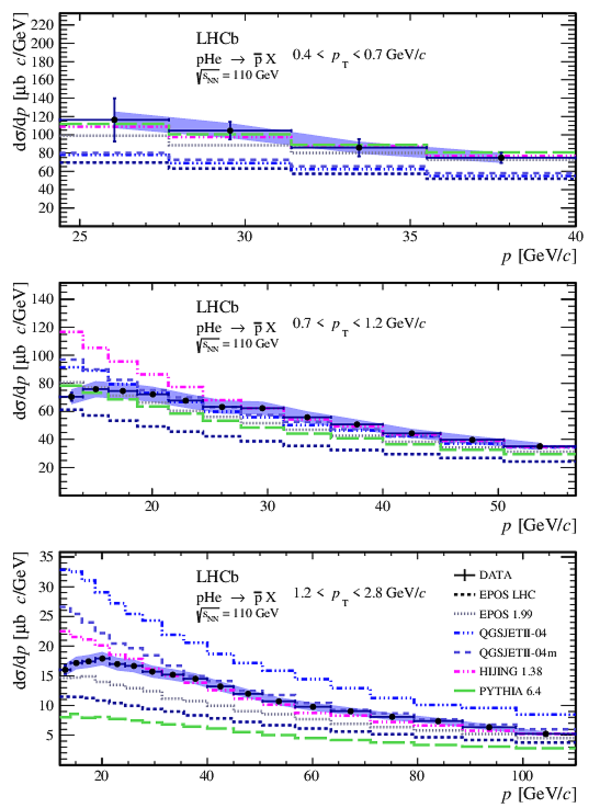
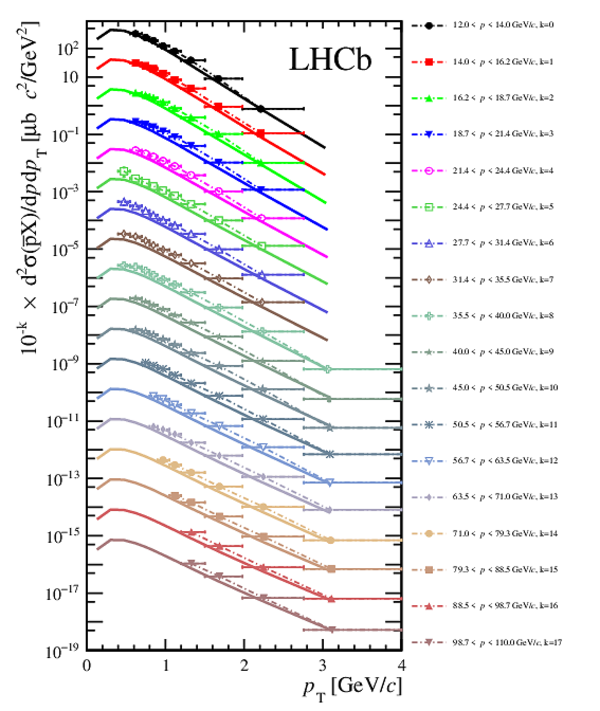
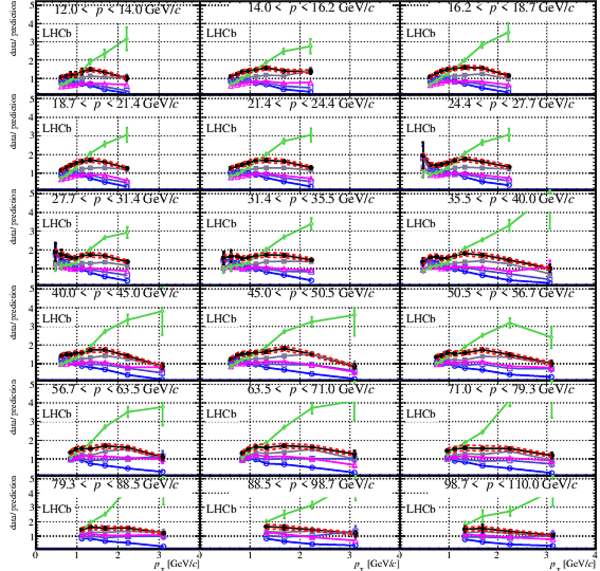
Antiproton production cross-section per He nucleus as a function of momentum, integrated over various $ p_{\mathrm{ T}}$ regions. The data points are compared with predictions from theoretical models. The uncertainties on the data points are uncorrelated only, while the shaded area indicates the correlated uncertainty. |
IntRes[..].pdf [22 KiB] HiDef png [706 KiB] Thumbnail [534 KiB] *.C file |
|
|
Animated gif made out of all figures. |
PAPER-2018-031.gif Thumbnail |

|
![HiDef png [234 KiB]](Directory_LHCb-PAPER-2018-031/hidef_dllPlot_paper.png)
![HiDef png [150 KiB]](Directory_LHCb-PAPER-2018-031/hidef_phiPID_paper.png)
![HiDef png [373 KiB]](Directory_LHCb-PAPER-2018-031/hidef_elekin_paper.png)
![HiDef png [706 KiB]](Directory_LHCb-PAPER-2018-031/hidef_IntResult_paper.png)
Tables and captions
|
Relative uncertainties on the $\overline p $ production cross-section. The ranges refer to the variation among kinematic bins. |
Table_1.pdf [48 KiB] HiDef png [116 KiB] Thumbnail [54 KiB] tex code |

|
|
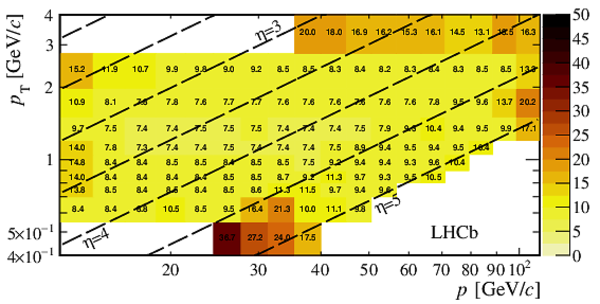
Numerical results for the measured prompt $\overline p $ production cross-section. The reported values are the double-differential cross-section $\mathrm{d}^2\sigma/\mathrm{d}p \mathrm{d}p_{\mathrm{T}}$ per He nucleus in the laboratory frame, averaged over the given kinematic range of each bin. The uncertainty is split into an uncorrelated uncertainty $\delta_{\text{uncorr}}$, and an uncertainty $\delta_{\text{corr}}$ which is fully correlated among the kinematic bins. For both uncertainties, the systematic uncertainty, dominant for most bins, and the statistical uncertainty, are added in quadrature. The average value within each bin is also reported for $ p$ , $ p_{\mathrm{ T}}$ and $x$-Feynman $ x_{\mathrm{F}} =2 p_Z^*/\sqrt{s_{\scriptscriptstyle\rm NN}} $, where $p_Z^*$ is the longitudinal $\overline p $ momentum in the proton-nucleon center-of-mass system. These average values are obtained from simulation, to avoid biases from reconstruction effects and given the good agreement with data observed for the simulated kinematic spectra. |
Table_2.pdf [15 KiB] HiDef png [1 KiB] Thumbnail [0 KiB] tex code |

|
![HiDef png [116 KiB]](Directory_LHCb-PAPER-2018-031/hidef_Table_1.png)
![HiDef png [1 KiB]](Directory_LHCb-PAPER-2018-031/hidef_Table_2.png)
Supplementary Material [file]
| Supplementary material full pdf |
supple[..].pdf [234 KiB] |
|
|
This ZIP file contains supplemetary material for the publication LHCb-PAPER-2018-031. The files are: supplementary.pdf : An overview of the extra figures *.pdf, *.png, *.eps : The figures in variuous formats |
Fig4.pdf [19 KiB] HiDef png [295 KiB] Thumbnail [223 KiB] *C file |

|
|
Fig5.pdf [14 KiB] HiDef png [161 KiB] Thumbnail [146 KiB] *C file |

|
|
|
Fig6.pdf [18 KiB] HiDef png [536 KiB] Thumbnail [320 KiB] *C file |
|
|
|
Fig7.pdf [27 KiB] HiDef png [874 KiB] Thumbnail [510 KiB] *C file |
|
|
|
Fig8a.pdf [12 KiB] HiDef png [117 KiB] Thumbnail [116 KiB] *C file |
|
|
|
Fig8b.pdf [68 KiB] HiDef png [1 MiB] Thumbnail [827 KiB] *C file |
|
|
|
Fig9.pdf [25 KiB] HiDef png [388 KiB] Thumbnail [365 KiB] *C file |
|
![HiDef png [295 KiB]](Directory_LHCb-PAPER-2018-031/supplementary/hidef_Fig4.png)
![HiDef png [161 KiB]](Directory_LHCb-PAPER-2018-031/supplementary/hidef_Fig5.png)
![HiDef png [536 KiB]](Directory_LHCb-PAPER-2018-031/supplementary/hidef_Fig6.png)
![HiDef png [874 KiB]](Directory_LHCb-PAPER-2018-031/supplementary/hidef_Fig7.png)
![HiDef png [117 KiB]](Directory_LHCb-PAPER-2018-031/supplementary/hidef_Fig8a.png)
![HiDef png [1 MiB]](Directory_LHCb-PAPER-2018-031/supplementary/hidef_Fig8b.png)
![HiDef png [388 KiB]](Directory_LHCb-PAPER-2018-031/supplementary/hidef_Fig9.png)
Created on 27 April 2024.