Study of $\Upsilon$ production in $p$Pb collisions at $\sqrt{s_{NN}}=8.16$ TeV
[to restricted-access page]Information
LHCb-PAPER-2018-035
CERN-EP-2018-267
arXiv:1810.07655 [PDF]
(Submitted on 17 Oct 2018)
JHEP 11 (2018) 194
Inspire 1699106
Tools
Abstract
The production of $\Upsilon(nS)$ mesons ($n=1,2,3$) in $p$Pb and Pb$p$ collisions at a centre-of-mass energy per nucleon pair $\sqrt{s_{NN}}=8.16$ TeV is measured by the LHCb experiment, using a data sample corresponding to an integrated luminosity of 31.8 nb$^{-1}$. The $\Upsilon(nS)$ mesons are reconstructed through their decays into two opposite-sign muons. The measurements comprise the differential production cross-sections of the $\Upsilon(1S)$ and $\Upsilon(2S)$ states, their forward-to-backward ratios and nuclear modification factors, performed as a function of the transverse momentum \pt and rapidity in the nucleon-nucleon centre-of-mass frame $y^*$ of the $\Upsilon(nS)$ states, in the kinematic range $p_{\rm{T}}<25$ GeV/$c$ and $1.5<y^*<4.0$ ($-5.0<y^*<-2.5$) for $p$Pb (Pb$p$) collisions. In addition, production cross-sections for $\Upsilon(3S)$ are measured integrated over phase space and the production ratios between all three $\Upsilon(nS)$ states are determined. The measurements are compared to theoretical predictions and suppressions for quarkonium in $p$Pb collisions are observed.
Figures and captions
|
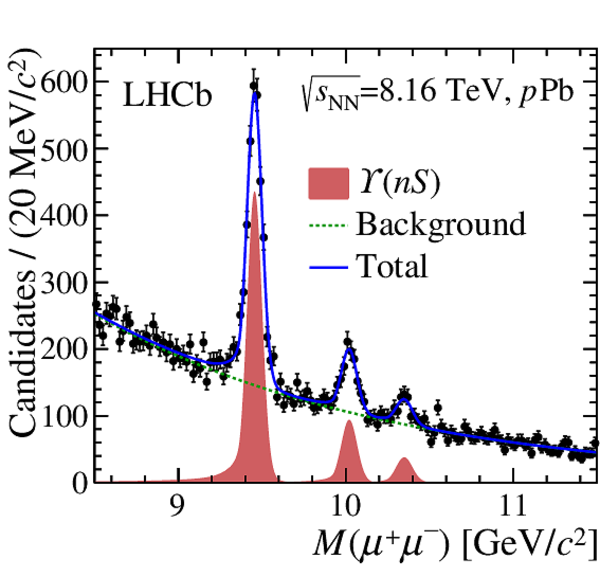
Invariant-mass distribution of $\mu^+\mu^-$ pairs from the (left) $p$Pb and (right) Pb$p$ samples after the trigger and off\-line selections. |
Fig1a.pdf [32 KiB] HiDef png [349 KiB] Thumbnail [290 KiB] *.C file |
|
|
Fig1b.pdf [33 KiB] HiDef png [348 KiB] Thumbnail [294 KiB] *.C file |

|
|
|
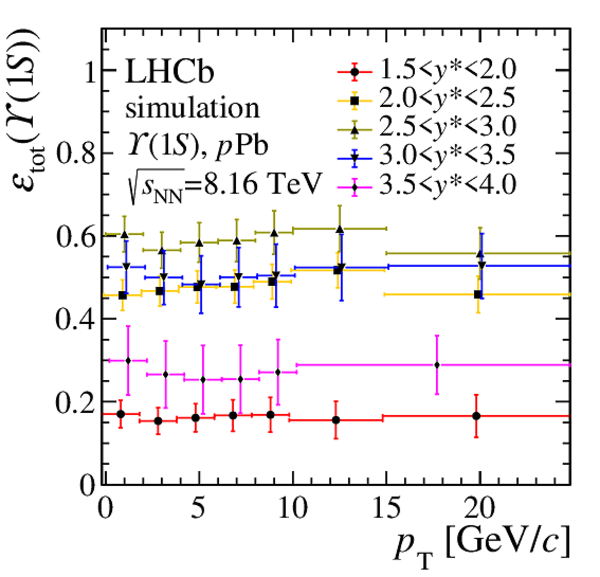
Total efficiency $\varepsilon_{\mathrm{tot}} $ of the \Y1S meson as a function of its $p_{\mathrm{ T}}$ in different $y^*$ bins in (left) $p$Pb and (right) Pb$p$ collisions. The horizontal locations of the markers are roughly the centroids of the bins, with offsets from centre to aid in readability. |
Fig2a.pdf [17 KiB] HiDef png [250 KiB] Thumbnail [230 KiB] *.C file |
|
|
Fig2b.pdf [17 KiB] HiDef png [250 KiB] Thumbnail [233 KiB] *.C file |

|
|
|
Double-differential cross-section for the \Y1S meson as a function of $p_{\mathrm{ T}}$ for different values of $y^*$ for the (left) forward $p$Pb and (right) backward Pb$p$ samples. The uncertainties are the sums in quadrature of the statistical and systematic components. The horizontal locations of the markers are roughly the centroids of the bins, with offsets from centre to aid in readability. |
Fig3a.pdf [17 KiB] HiDef png [248 KiB] Thumbnail [233 KiB] *.C file |

|
|
Fig3b.pdf [17 KiB] HiDef png [249 KiB] Thumbnail [241 KiB] *.C file |

|
|
|
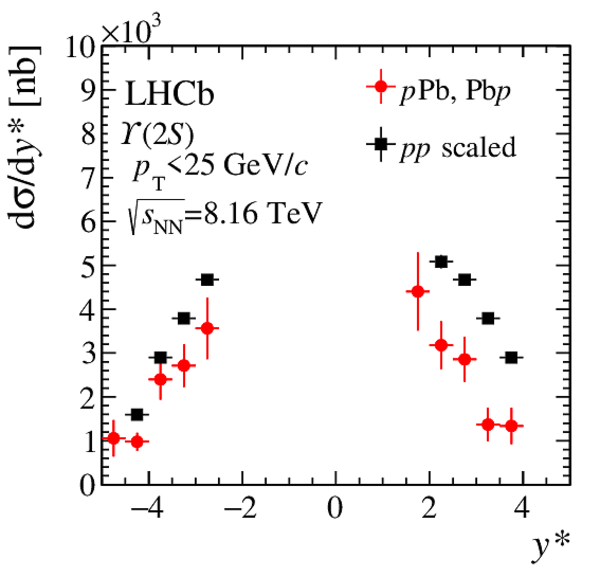
Cross-section of (left) \Y1S and (right) \Y2S production as a function of $y^*$ integrated over $p_{\mathrm{ T}}$ for the backward (negative $y^*$) and forward (positive $y^*$) samples, compared to the cross-section measured in $pp$, interpolated to $\sqrt{s_{\scriptscriptstyle\rm NN}} =8.16\mathrm{ Te V} $. In this and subsequent figures, the uncertainties shown are the sums in quadrature of the statistical and systematic components. |
Fig4a.pdf [14 KiB] HiDef png [158 KiB] Thumbnail [158 KiB] *.C file |

|
|
Fig4b.pdf [15 KiB] HiDef png [164 KiB] Thumbnail [171 KiB] *.C file |
|
|
|
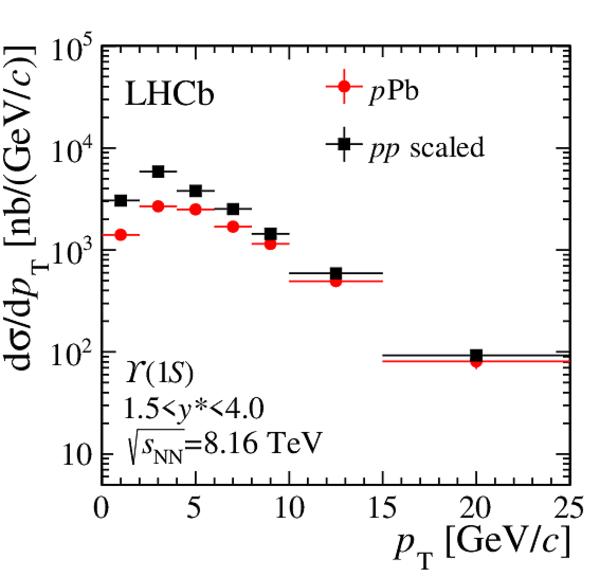
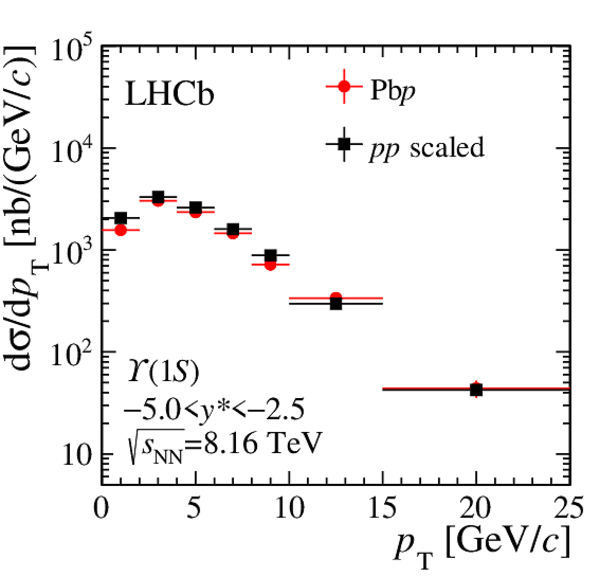
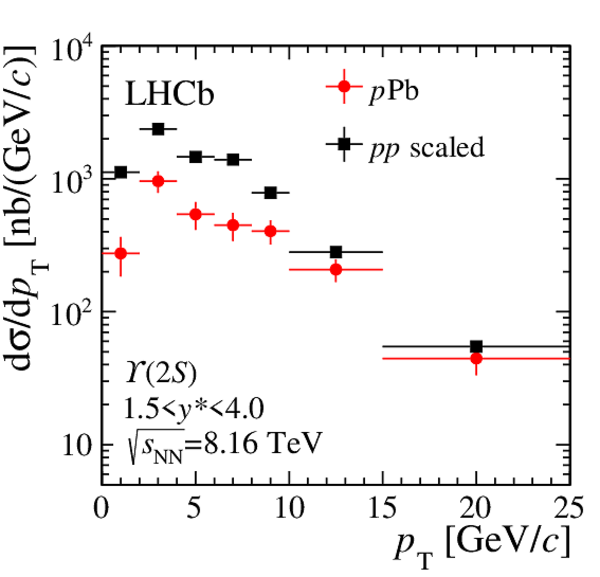
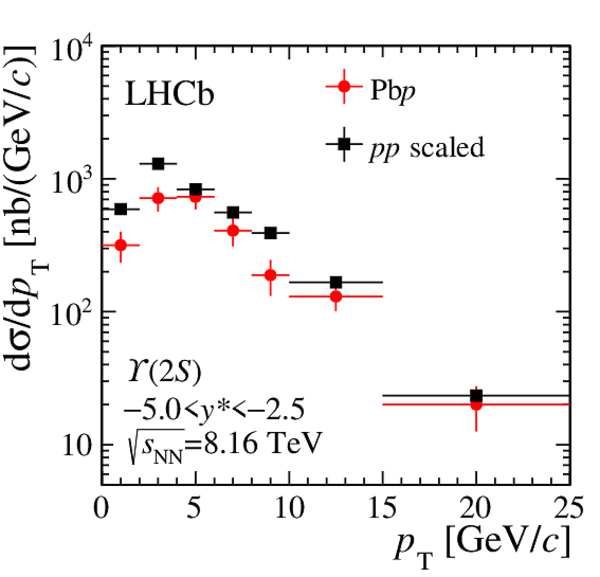
Cross-section of (top) \Y1S and (bottom) \Y2S production as a function of $p_{\mathrm{ T}}$ integrated over $y^*$ for the (left) forward and (right) backward samples compared to the cross-section measured in $pp$, interpolated to $\sqrt{s_{\scriptscriptstyle\rm NN}} =8.16\mathrm{ Te V} $. |
Fig5a.pdf [14 KiB] HiDef png [167 KiB] Thumbnail [173 KiB] *.C file |
|
|
Fig5b.pdf [14 KiB] HiDef png [167 KiB] Thumbnail [174 KiB] *.C file |
|
|
|
Fig5c.pdf [14 KiB] HiDef png [165 KiB] Thumbnail [170 KiB] *.C file |
|
|
|
Fig5d.pdf [14 KiB] HiDef png [166 KiB] Thumbnail [171 KiB] *.C file |
|
|
|
Nuclear modification factors of the (left) \Y1S and (right) \Y2S mesons as a function of $y^*$ integrated over $p_{\mathrm{ T}}$ for the forward and backward samples. The bands correspond to the theoretical predictions for the nCTEQ15 and EPPS16 NNPDF sets, and the comovers model as reported in the text. |
Fig6a.pdf [20 KiB] HiDef png [1 MiB] Thumbnail [520 KiB] *.C file |

|
|
Fig6b.pdf [20 KiB] HiDef png [1 MiB] Thumbnail [563 KiB] *.C file |

|
|
|
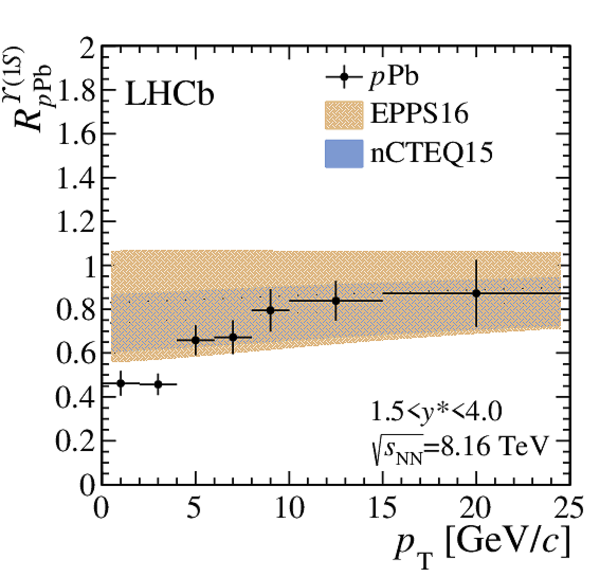
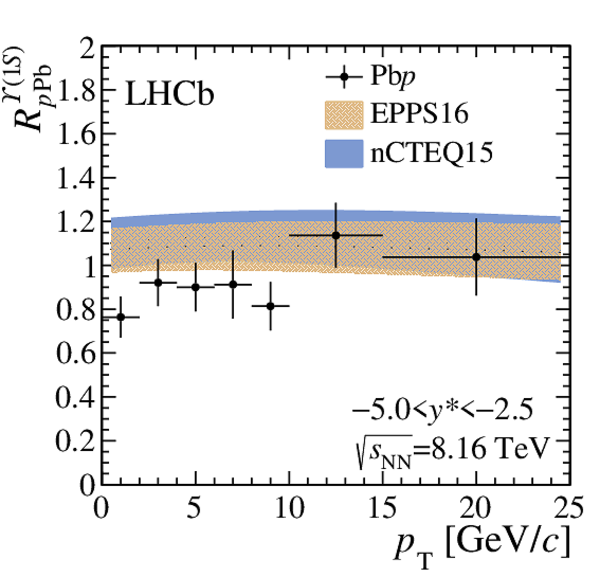
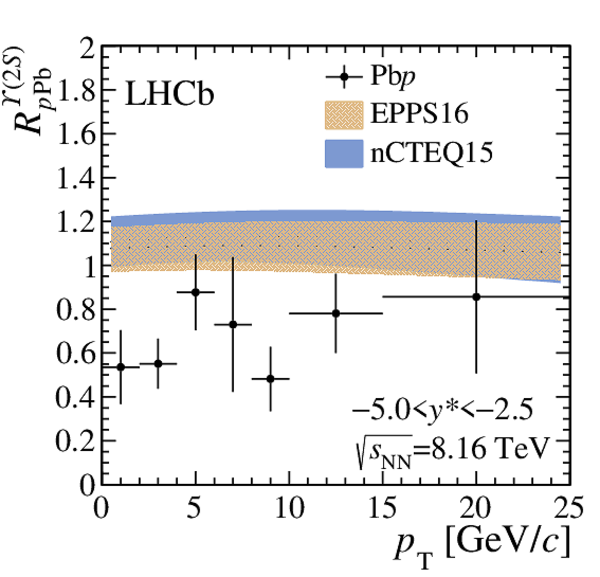
Nuclear modification factors of the (top) \Y1S and (bottom) \Y2S mesons as a function of $p_{\mathrm{ T}}$ integrated over $y^*$ for the (left) forward and (right) backward samples. The bands correspond to the theoretical predictions for the nCTEQ15 and EPPS16 NNPDF sets as reported in the text. |
Fig7a.pdf [15 KiB] HiDef png [1005 KiB] Thumbnail [437 KiB] *.C file |
|
|
Fig7b.pdf [16 KiB] HiDef png [671 KiB] Thumbnail [337 KiB] *.C file |
|
|
|
Fig7c.pdf [15 KiB] HiDef png [1001 KiB] Thumbnail [442 KiB] *.C file |

|
|
|
Fig7d.pdf [16 KiB] HiDef png [674 KiB] Thumbnail [338 KiB] *.C file |
|
|
|
Forward-backward ratio for the \Y1S as a function of (left) $p_{\mathrm{ T}}$ integrated over $y^*$ and (right) as a function of $|y^*|$ integrated over $p_{\mathrm{ T}}$ . The bands correspond to the theoretical calculations for the nCTEQ15 and EPPS16 NNPDF sets as reported in the text. |
Fig8a.pdf [15 KiB] HiDef png [962 KiB] Thumbnail [431 KiB] *.C file |

|
|
Fig8b.pdf [14 KiB] HiDef png [1 MiB] Thumbnail [438 KiB] *.C file |

|
|
|
Forward-backward ratio for the \Y2S compared with theoretical calculations for the nCTEQ15 and EPPS16 NNPDF sets as reported in the text. |
Fig9.pdf [14 KiB] HiDef png [1 MiB] Thumbnail [438 KiB] *.C file |

|
|
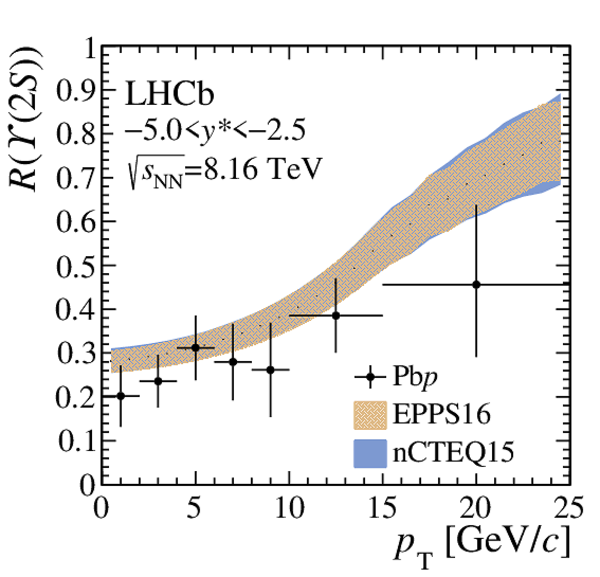
Ratios between \Y2S and \Y1S cross-sections as a function of (top) $p_{\mathrm{ T}}$ integrated over $y^*$, and as function of (bottom) $y^*$ integrated over $p_{\mathrm{ T}}$ , for $p$Pb and Pb$p$ collisions. The bands correspond to the theoretical predictions for the nCTEQ15 and EPPS16 NNPDF sets as reported in the text. |
Fig10a.pdf [16 KiB] HiDef png [1 MiB] Thumbnail [499 KiB] *.C file |

|
|
Fig10b.pdf [16 KiB] HiDef png [726 KiB] Thumbnail [343 KiB] *.C file |
|
|
|
Fig10c.pdf [15 KiB] HiDef png [1 MiB] Thumbnail [448 KiB] *.C file |

|
|
|
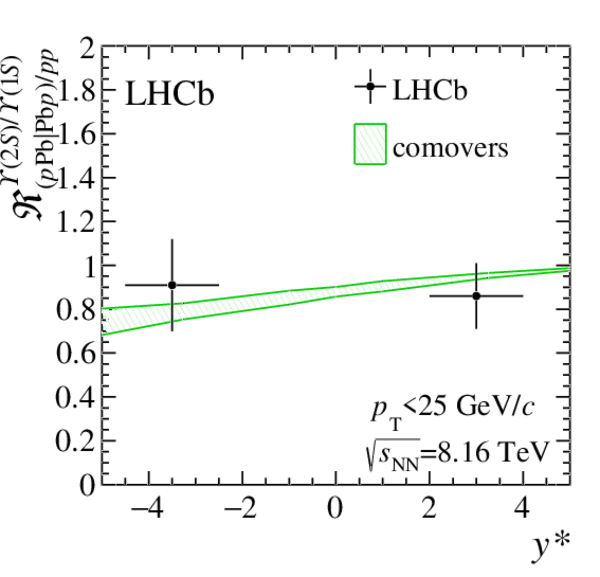
Double ratios for (left) \Y2S and (right) \Y3S. The bands correspond to the theoretical prediction for the comovers model as reported in the text. |
Fig11a.pdf [16 KiB] HiDef png [344 KiB] Thumbnail [232 KiB] *.C file |
|
|
Fig11b.pdf [16 KiB] HiDef png [297 KiB] Thumbnail [209 KiB] *.C file |

|
|
|
Ratio of \Y1S to nonprompt $ { J \mskip -3mu/\mskip -2mu\psi \mskip 2mu}$ cross-sections as a function of $y^*$ integrated over $p_{\mathrm{ T}}$ , for $p$Pb and Pb$p$ collisions. |
Fig12.pdf [15 KiB] HiDef png [197 KiB] Thumbnail [199 KiB] *.C file |

|
|
Animated gif made out of all figures. |
PAPER-2018-035.gif Thumbnail |

|
![HiDef png [349 KiB]](Directory_LHCb-PAPER-2018-035/hidef_Fig1a.png)
![HiDef png [348 KiB]](Directory_LHCb-PAPER-2018-035/hidef_Fig1b.png)
![HiDef png [250 KiB]](Directory_LHCb-PAPER-2018-035/hidef_Fig2a.png)
![HiDef png [250 KiB]](Directory_LHCb-PAPER-2018-035/hidef_Fig2b.png)
![HiDef png [248 KiB]](Directory_LHCb-PAPER-2018-035/hidef_Fig3a.png)
![HiDef png [249 KiB]](Directory_LHCb-PAPER-2018-035/hidef_Fig3b.png)
![HiDef png [158 KiB]](Directory_LHCb-PAPER-2018-035/hidef_Fig4a.png)
![HiDef png [164 KiB]](Directory_LHCb-PAPER-2018-035/hidef_Fig4b.png)
![HiDef png [167 KiB]](Directory_LHCb-PAPER-2018-035/hidef_Fig5a.png)
![HiDef png [167 KiB]](Directory_LHCb-PAPER-2018-035/hidef_Fig5b.png)
![HiDef png [165 KiB]](Directory_LHCb-PAPER-2018-035/hidef_Fig5c.png)
![HiDef png [166 KiB]](Directory_LHCb-PAPER-2018-035/hidef_Fig5d.png)
![HiDef png [1 MiB]](Directory_LHCb-PAPER-2018-035/hidef_Fig6a.png)
![HiDef png [1 MiB]](Directory_LHCb-PAPER-2018-035/hidef_Fig6b.png)
![HiDef png [1005 KiB]](Directory_LHCb-PAPER-2018-035/hidef_Fig7a.png)
![HiDef png [671 KiB]](Directory_LHCb-PAPER-2018-035/hidef_Fig7b.png)
![HiDef png [1001 KiB]](Directory_LHCb-PAPER-2018-035/hidef_Fig7c.png)
![HiDef png [674 KiB]](Directory_LHCb-PAPER-2018-035/hidef_Fig7d.png)
![HiDef png [962 KiB]](Directory_LHCb-PAPER-2018-035/hidef_Fig8a.png)
![HiDef png [1 MiB]](Directory_LHCb-PAPER-2018-035/hidef_Fig8b.png)
![HiDef png [1 MiB]](Directory_LHCb-PAPER-2018-035/hidef_Fig9.png)
![HiDef png [1 MiB]](Directory_LHCb-PAPER-2018-035/hidef_Fig10a.png)
![HiDef png [726 KiB]](Directory_LHCb-PAPER-2018-035/hidef_Fig10b.png)
![HiDef png [1 MiB]](Directory_LHCb-PAPER-2018-035/hidef_Fig10c.png)
![HiDef png [344 KiB]](Directory_LHCb-PAPER-2018-035/hidef_Fig11a.png)
![HiDef png [297 KiB]](Directory_LHCb-PAPER-2018-035/hidef_Fig11b.png)
![HiDef png [197 KiB]](Directory_LHCb-PAPER-2018-035/hidef_Fig12.png)
Tables and captions
|
Yields of $\Y1S$, $\Y2S$, $\Y3S$ mesons in $p$Pb and Pb$p$ samples as given by the fit. The uncertainties are statistical only. |
Table_1.pdf [59 KiB] HiDef png [33 KiB] Thumbnail [17 KiB] tex code |

|
|
Systematic uncertainties (in percent) on the cross-section measurements. The ranges indicate the minimum and maximum values in different bins, among all \Y nS states. |
Table_2.pdf [42 KiB] HiDef png [108 KiB] Thumbnail [49 KiB] tex code |

|
|
Ratio $R(\Y nS)$ in $pp$, $p$Pb, and Pb$p$ samples. The uncertainties are combinations of statistical and systematical components. |
Table_3.pdf [53 KiB] HiDef png [64 KiB] Thumbnail [31 KiB] tex code |

|
|
\Y1S production cross-section in $p$Pb, as a function of $ p_{\mathrm{ T}} $ and $y^*$. |
Table_4.pdf [60 KiB] HiDef png [354 KiB] Thumbnail [178 KiB] tex code |

|
|
\Y1S production cross-section in Pb$p$, as a function of $ p_{\mathrm{ T}} $ and $y^*$. |
Table_5.pdf [60 KiB] HiDef png [291 KiB] Thumbnail [152 KiB] tex code |

|
|
\Y1S production cross-section in $p$Pb and Pb$p$, as a function of $ p_{\mathrm{ T}} $. |
Table_6.pdf [52 KiB] HiDef png [61 KiB] Thumbnail [30 KiB] tex code |

|
|
\Y1S production cross-section in $p$Pb and Pb$p$, as a function of $y^*$. |
Table_7.pdf [51 KiB] HiDef png [200 KiB] Thumbnail [88 KiB] tex code |

|
|
\Y2S production cross-section in $p$Pb and Pb$p$, as a function of $ p_{\mathrm{ T}} $. |
Table_8.pdf [52 KiB] HiDef png [55 KiB] Thumbnail [28 KiB] tex code |

|
|
\Y2S production cross-section in $p$Pb, as a function of $y^*$. |
Table_9.pdf [51 KiB] HiDef png [215 KiB] Thumbnail [93 KiB] tex code |

|
|
Scaled $pp$ differential cross-section in $p_{\mathrm{ T}}$ at $\sqrt{s_{\scriptscriptstyle\rm NN}} =8.16$ TeV. The first uncertainty is statistical, the second is systematic, which includes the systematic uncertainty from the $pp$ measurement and that estimated by changing the interpolation function. |
Table_10.pdf [53 KiB] HiDef png [64 KiB] Thumbnail [34 KiB] tex code |

|
|
Scaled $pp$ differential cross-section in $y$ at $\sqrt{s_{\scriptscriptstyle\rm NN}} =8.16$ TeV. The first uncertainty is statistical, the second is systematic, which includes the systematic uncertainty from the $pp$ measurement and that estimated by changing the interpolation function. |
Table_11.pdf [45 KiB] HiDef png [84 KiB] Thumbnail [43 KiB] tex code |

|
|
$\Upsilon(1S)$ nuclear modification factor, $R_{p{\rm Pb}}^{\Upsilon(1S)}$, in $p$Pb and Pb$p$ as a function of $ p_{\mathrm{ T}} $ integrated over $y^*$ in the range $1.5 < y^* < 4.0$ for $p$Pb and $-5.0 < y^* < -2.5$ for Pb$p$. |
Table_12.pdf [60 KiB] HiDef png [104 KiB] Thumbnail [48 KiB] tex code |

|
|
$\Upsilon(1S)$ nuclear modification factor, $R_{p{\rm Pb}}^{\Upsilon(1S)}$, in $p$Pb and Pb$p$ as a function of $y^*$ integrated over $ p_{\mathrm{ T}} $ in the range $0 < p_{\mathrm{ T}} < 25$ $ {\mathrm{ Ge V /}c} $ . |
Table_13.pdf [65 KiB] HiDef png [169 KiB] Thumbnail [73 KiB] tex code |

|
|
$\Upsilon(2S)$ nuclear modification factor, $R_{p{\rm Pb}}^{\Upsilon(2S)}$, in $p$Pb and Pb$p$ as a function of $ p_{\mathrm{ T}} $ integrated over $y^*$ in the range $1.5 < y^* < 4.0$ for $p$Pb and $-5.0 < y^* < -2.5$ for Pb$p$. |
Table_14.pdf [60 KiB] HiDef png [108 KiB] Thumbnail [50 KiB] tex code |

|
|
$\Upsilon(2S)$ nuclear modification factor, $R_{p{\rm Pb}}^{\Upsilon(2S)}$, in $p$Pb and Pb$p$ as a function of $y^*$ integrated over $ p_{\mathrm{ T}} $ in the range $0 < p_{\mathrm{ T}} < 25$ $ {\mathrm{ Ge V /}c} $ . |
Table_15.pdf [65 KiB] HiDef png [165 KiB] Thumbnail [73 KiB] tex code |

|
|
$\Upsilon(1S)$ forward-to-backward ratio, $R_{{\rm FB}}^{\Upsilon(1S)}$, as a function of $ p_{\mathrm{ T}} $ integrated over $\vert y^* \vert$ in the range $2.5 < \vert y^* \vert < 4.0$. |
Table_16.pdf [59 KiB] HiDef png [166 KiB] Thumbnail [70 KiB] tex code |

|
|
$\Upsilon(1S)$ forward-to-backward ratio, $R_{{\rm FB}}^{\Upsilon(1S)}$, as a function of $\vert y^* \vert$ integrated over $ p_{\mathrm{ T}} $ in the range $0 < p_{\mathrm{ T}} < 25$ $ {\mathrm{ Ge V /}c} $ . |
Table_17.pdf [65 KiB] HiDef png [83 KiB] Thumbnail [35 KiB] tex code |

|
|
$\Upsilon(2S)$ forward-to-backward ratio, $R_{{\rm FB}}^{\Upsilon(2S)}$, as a function of $ p_{\mathrm{ T}} $ integrated over $\vert y^* \vert$ in the range $2.5 < \vert y^* \vert < 4.0$. |
Table_18.pdf [52 KiB] HiDef png [108 KiB] Thumbnail [53 KiB] tex code |

|
|
$\Upsilon(2S)$ forward-to-backward ratio, $R_{{\rm FB}}^{\Upsilon(2S)}$, as a function of $\vert y^* \vert$ integrated over $ p_{\mathrm{ T}} $ in the range $0 < p_{\mathrm{ T}} < 25$ $ {\mathrm{ Ge V /}c} $ . |
Table_19.pdf [50 KiB] HiDef png [208 KiB] Thumbnail [90 KiB] tex code |

|
|
$\Upsilon(2S)$ to $\Upsilon(1S)$ ratio, $R(\Y2S)$, in $p$Pb and Pb$p$ as a function of $ p_{\mathrm{ T}} $ integrated over $y^*$ in the range $1.5 < y^* < 4.0$ for $p$Pb and $-5.0 < y^* < -2.5$ for Pb$p$. |
Table_18.pdf [52 KiB] HiDef png [108 KiB] Thumbnail [53 KiB] tex code |
|
|
$\Upsilon(2S)$ to $\Upsilon(1S)$ ratio, $R(\Y2S)$, in $p$Pb and Pb$p$ as a function of $y^*$ integrated over $ p_{\mathrm{ T}} $ in the range $0 < p_{\mathrm{ T}} < 25$ $ {\mathrm{ Ge V /}c} $ . |
Table_19.pdf [50 KiB] HiDef png [208 KiB] Thumbnail [90 KiB] tex code |
|
|
$\Upsilon(1S)$ to nonprompt $J/\psi$, in $p$Pb and Pb$p$ as a function of $y^*$ integrated over $ p_{\mathrm{ T}} $ in the range $0 < p_{\mathrm{ T}} < 25$ $ {\mathrm{ Ge V /}c} $ . The quoted uncertainties are the sum in quadrature of the statistical and systematic components. |
Table_20.pdf [52 KiB] HiDef png [147 KiB] Thumbnail [52 KiB] tex code |

|
![HiDef png [33 KiB]](Directory_LHCb-PAPER-2018-035/hidef_Table_1.png)
![HiDef png [108 KiB]](Directory_LHCb-PAPER-2018-035/hidef_Table_2.png)
![HiDef png [64 KiB]](Directory_LHCb-PAPER-2018-035/hidef_Table_3.png)
![HiDef png [354 KiB]](Directory_LHCb-PAPER-2018-035/hidef_Table_4.png)
![HiDef png [291 KiB]](Directory_LHCb-PAPER-2018-035/hidef_Table_5.png)
![HiDef png [61 KiB]](Directory_LHCb-PAPER-2018-035/hidef_Table_6.png)
![HiDef png [200 KiB]](Directory_LHCb-PAPER-2018-035/hidef_Table_7.png)
![HiDef png [55 KiB]](Directory_LHCb-PAPER-2018-035/hidef_Table_8.png)
![HiDef png [215 KiB]](Directory_LHCb-PAPER-2018-035/hidef_Table_9.png)
![HiDef png [64 KiB]](Directory_LHCb-PAPER-2018-035/hidef_Table_10.png)
![HiDef png [84 KiB]](Directory_LHCb-PAPER-2018-035/hidef_Table_11.png)
![HiDef png [104 KiB]](Directory_LHCb-PAPER-2018-035/hidef_Table_12.png)
![HiDef png [169 KiB]](Directory_LHCb-PAPER-2018-035/hidef_Table_13.png)
![HiDef png [108 KiB]](Directory_LHCb-PAPER-2018-035/hidef_Table_14.png)
![HiDef png [165 KiB]](Directory_LHCb-PAPER-2018-035/hidef_Table_15.png)
![HiDef png [166 KiB]](Directory_LHCb-PAPER-2018-035/hidef_Table_16.png)
![HiDef png [83 KiB]](Directory_LHCb-PAPER-2018-035/hidef_Table_17.png)
![HiDef png [108 KiB]](Directory_LHCb-PAPER-2018-035/hidef_Table_18.png)
![HiDef png [208 KiB]](Directory_LHCb-PAPER-2018-035/hidef_Table_19.png)
![HiDef png [147 KiB]](Directory_LHCb-PAPER-2018-035/hidef_Table_20.png)
Created on 27 April 2024.