Information
LHCb-PAPER-2018-047
CERN-EP-2018-348
arXiv:1901.07075 [PDF]
(Submitted on 21 Jan 2019)
Phys. Rev. D99 052006 (2019)
Inspire 1716259
Tools
Abstract
The first measurement of the production rate of $\Xi_b^-$ baryons in $pp$ collisions relative to that of $\Lambda_b^0$ baryons is reported, using data samples collected by the LHCb experiment, and corresponding to integrated luminosities of $1$, $2$ and $1.6$ fb$^{-1}$ at $\sqrt{s}=7, 8$ and $13$ TeV, respectively. In the kinematic region $2 < \eta < 6$ and $p_{\rm T}<20$ GeV/$c$, we measure \begin{align*} \frac{f_{\Xi_b^-}}{f_{\Lambda_b^0}}\frac{{\mathcal{B}}(\Xi_b^-\to J/\psi\Xi^-)}{{\mathcal{B}}(\Lambda_b^0\to J/\psi\Lambda)} &= (10.8\pm0.9\pm0.8)\times10^{-2} [\sqrt{s}=7,8 {\rm TeV}],\\ \frac{f_{\Xi_b^-}}{f_{\Lambda_b^0}}\frac{{\mathcal{B}}(\Xi_b^-\to J/\psi\Xi^-)}{{\mathcal{B}}(\Lambda_b^0\to J/\psi\Lambda)} &= (13.1\pm1.1\pm1.0)\times10^{-2} [\sqrt{s}=13 {\rm TeV}], \end{align*} where $f_{\Xi_b^-}$ and $f_{\Lambda_b^0}$ are the fragmentation fractions of $b$ quarks into $\Xi_b^-$ and $\Lambda_b^0$ baryons, respectively, ${\mathcal{B}}$ represents branching fractions, and the uncertainties are due to statistical and experimental systematic sources. The values of $f_{\Xi_b^-}/f_{\Lambda_b^0}$ are obtained by invoking SU(3) symmetry in the $\Xi_b^-\to J\psi\Xi^-$ and $\Lambda_b^0\to J/\psi\Lambda$ decays. Production asymmetries between $\Xi_b^-$ and $\bar{\Xi}_b^+$ baryons are also reported. The mass of the $\Xi_b^-$ baryon is also measured relative to that of the $\Lambda_b^0$ baryon, from which it is found that \begin{align*} m(\Xi_b^-) &= 5796.70\pm0.39\pm0.15\pm0.17 {\rm MeV}/c^2, \end{align*} where the last uncertainty is due to the precision on the known $\Lambda_b^0$ mass. This result represents the most precise determination of the $\Xi_b^-$ mass.
Figures and captions
|
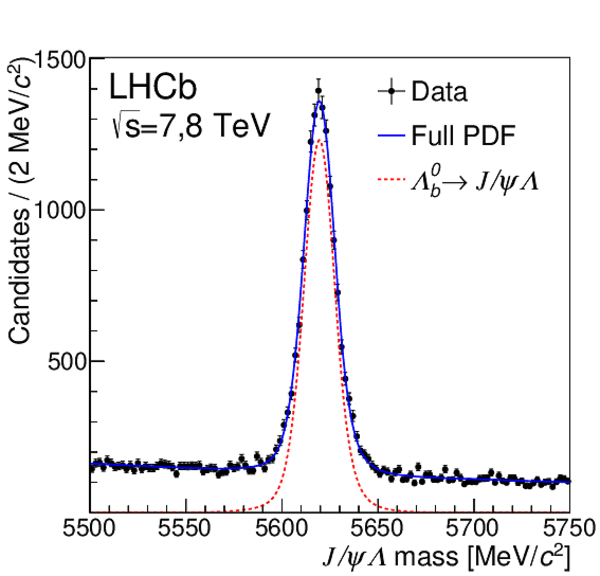
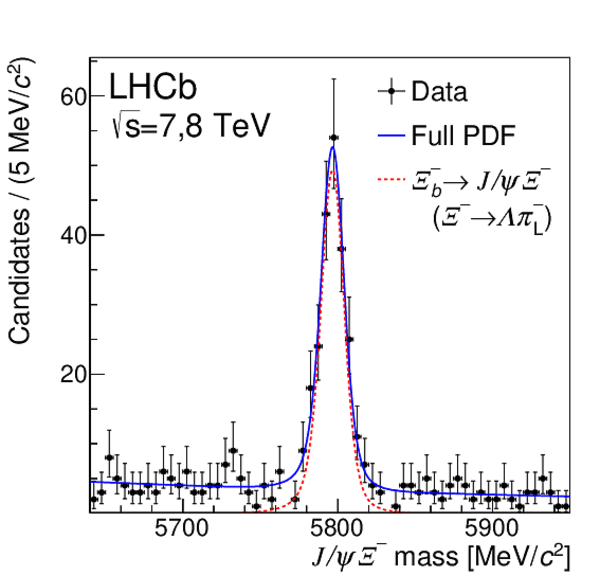
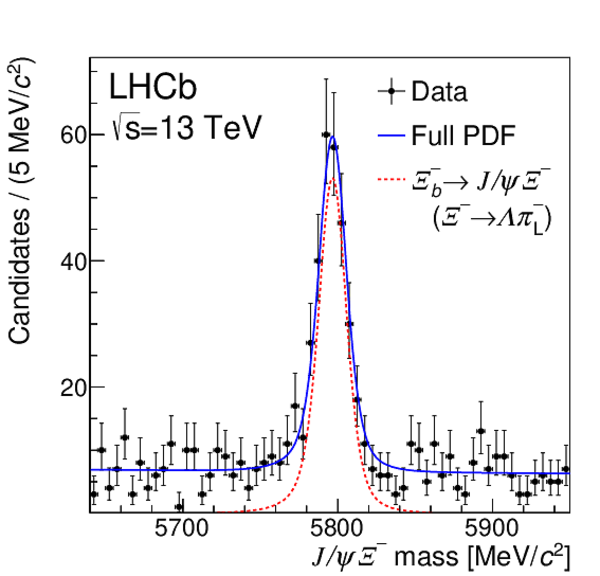
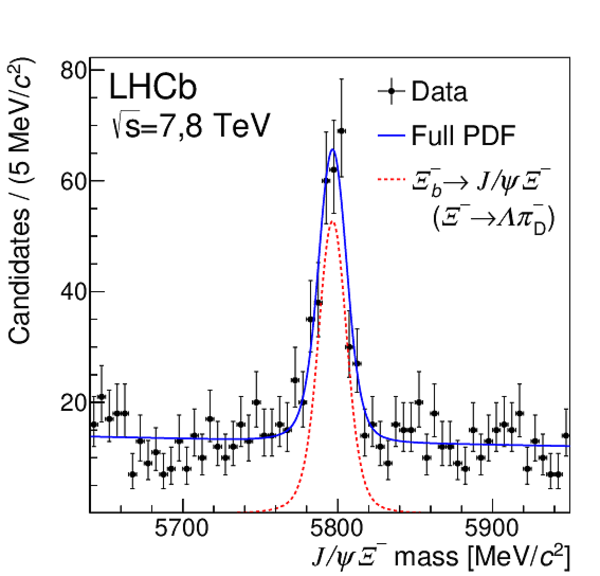
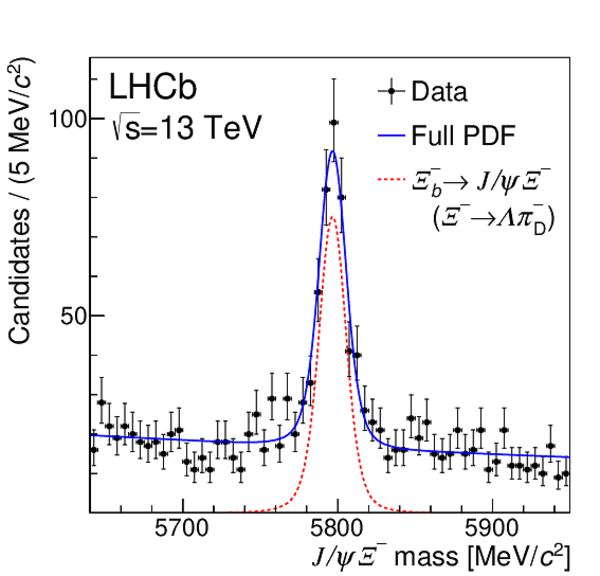
Invariant-mass distributions for (top) $\Lambda ^0_ b \rightarrow { J \mskip -3mu/\mskip -2mu\psi \mskip 2mu} \Lambda $ candidates, (middle) $\Xi ^-_ b \rightarrow { J \mskip -3mu/\mskip -2mu\psi \mskip 2mu} \Xi ^- $, $\Xi ^- \rightarrow \Lambda \pi^-_{\rm L}$, and (bottom) $\Xi ^-_ b \rightarrow { J \mskip -3mu/\mskip -2mu\psi \mskip 2mu} \Xi ^- $, $\Xi ^- \rightarrow \Lambda \pi^-_{\rm D}$. The subscript on the $\pi ^- $ refers to whether the corresponding track is long or downstream. The left column shows the combined 7 and 8 $\text{ Te V}$ data and the right one shows the 13 $\text{ Te V}$ data. The fitted probability distributions functions (PDF) are overlaid. |
MassFi[..].pdf [24 KiB] HiDef png [274 KiB] Thumbnail [215 KiB] *.C file |
|
|
MassFi[..].pdf [24 KiB] HiDef png [278 KiB] Thumbnail [219 KiB] *.C file |

|
|
|
MassFi[..].pdf [20 KiB] HiDef png [264 KiB] Thumbnail [214 KiB] *.C file |
|
|
|
MassFi[..].pdf [20 KiB] HiDef png [269 KiB] Thumbnail [219 KiB] *.C file |
|
|
|
MassFi[..].pdf [20 KiB] HiDef png [268 KiB] Thumbnail [226 KiB] *.C file |
|
|
|
MassFi[..].pdf [20 KiB] HiDef png [263 KiB] Thumbnail [220 KiB] *.C file |
|
|
|
Animated gif made out of all figures. |
PAPER-2018-047.gif Thumbnail |

|
![HiDef png [274 KiB]](Directory_LHCb-PAPER-2018-047/hidef_MassFit_LbDD_Run1_constr.png)
![HiDef png [278 KiB]](Directory_LHCb-PAPER-2018-047/hidef_MassFit_LbDD_Run2_constr.png)
![HiDef png [264 KiB]](Directory_LHCb-PAPER-2018-047/hidef_MassFit_XibDDL_Run1_constr.png)
![HiDef png [269 KiB]](Directory_LHCb-PAPER-2018-047/hidef_MassFit_XibDDL_Run2_constr.png)
![HiDef png [268 KiB]](Directory_LHCb-PAPER-2018-047/hidef_MassFit_XibDDD_Run1_constr.png)
![HiDef png [263 KiB]](Directory_LHCb-PAPER-2018-047/hidef_MassFit_XibDDD_Run2_constr.png)
Tables and captions
|
Fitted signal yields and peak position of the $\Lambda ^0_ b $ signal peak, as obtained from the fit described in the text. The subscript on the $\pi ^- $ refers to whether the corresponding track is long or downstream. The uncertainties shown are statistical only. |
Table_1.pdf [86 KiB] HiDef png [48 KiB] Thumbnail [24 KiB] tex code |

|
|
Selection efficiencies as obtained from the simulation of $\Lambda ^0_ b \rightarrow { J \mskip -3mu/\mskip -2mu\psi \mskip 2mu} \Lambda $ and $\Xi ^-_ b \rightarrow { J \mskip -3mu/\mskip -2mu\psi \mskip 2mu} \Xi ^- $, $\Xi ^- \rightarrow \Lambda \pi^-_{\rm L}$ decays at $\sqrt{s}=7, 8$ $\text{ Te V}$ and 13 $\text{ Te V}$ . The efficiencies ($\epsilon$) listed are those associated with the detector acceptance (acc), the reconstruction and selection (sel), the trigger (trig), their product, and the relative efficiency. |
Table_2.pdf [88 KiB] HiDef png [60 KiB] Thumbnail [30 KiB] tex code |

|
|
Yields of $\Lambda ^0_ b $ and $\Xi ^-_ b $ decays, split by the charge of the final state, and their asymmetries, for the combined 7, 8 $\text{ Te V}$ data samples and the 13 $\text{ Te V}$ data sample. Uncertainties are statistical only. |
Table_3.pdf [66 KiB] HiDef png [57 KiB] Thumbnail [29 KiB] tex code |

|
|
Summary of relative systematic uncertainties on the production ratio $R$. |
Table_4.pdf [61 KiB] HiDef png [81 KiB] Thumbnail [37 KiB] tex code |

|
![HiDef png [48 KiB]](Directory_LHCb-PAPER-2018-047/hidef_Table_1.png)
![HiDef png [60 KiB]](Directory_LHCb-PAPER-2018-047/hidef_Table_2.png)
![HiDef png [57 KiB]](Directory_LHCb-PAPER-2018-047/hidef_Table_3.png)
![HiDef png [81 KiB]](Directory_LHCb-PAPER-2018-047/hidef_Table_4.png)
Created on 26 April 2024.