Information
LHCb-PAPER-2018-050
CERN-EP-2019-016
arXiv:1902.06794 [PDF]
(Submitted on 18 Feb 2019)
Phys. Rev. D 100 (2019) 031102(R)
Inspire 1720859
Tools
Abstract
The production fractions of $\overline{B}_s^0$ and $\Lambda_b^0$ hadrons, normalized to the sum of $B^-$ and $\overline{B}^0$ fractions, are measured in 13 TeV pp collisions using data collected by the LHCb experiment, corresponding to an integrated luminosity of 1.67/fb. These ratios, averaged over the $b$-hadron transverse momenta from 4 to 25 GeV and pseudorapidity from 2 to 5, are $0.122 \pm 0.006$ for $\overline{B}_s^0$, and $0.259 \pm 0.018$ for $\Lambda_b^0$, where the uncertainties arise from both statistical and systematic sources. The $\Lambda_b^0$ ratio depends strongly on transverse momentum, while the $\overline{B}_s^0$ ratio shows a mild dependence. Neither ratio shows variations with pseudorapidity. The measurements are made using semileptonic decays to minimize theoretical uncertainties. In addition, the ratio of $D^+$ to $D^0$ mesons produced in the sum of $\overline{B}^0$ and $B^-$ semileptonic decays is determined as $0.359\pm0.006\pm 0.009$, where the uncertainties are statistical and systematic.
Figures and captions
|
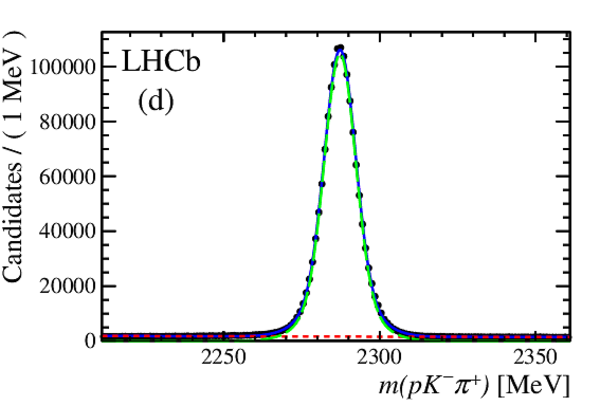
Fit to the mass spectra of the $H_c$ candidates of the selected $H_b$ decays: (a) $D^0$, (b) $D^+$, (c) $D_s^+$ mesons, and (d) the $\Lambda ^+_ c $ baryon. The data are shown as black points with error bars. The signal component is shown as the dashed (green) line and the combinatorial background component is shown as the dashed (red) line. The solid (blue) line shows all components added together. |
D0_Mas[..].pdf [30 KiB] HiDef png [201 KiB] Thumbnail [170 KiB] *.C file |

|
|
Dp_Mas[..].pdf [30 KiB] HiDef png [185 KiB] Thumbnail [150 KiB] *.C file |

|
|
|
Ds_Mas[..].pdf [30 KiB] HiDef png [189 KiB] Thumbnail [157 KiB] *.C file |

|
|
|
Lc_Mas[..].pdf [30 KiB] HiDef png [181 KiB] Thumbnail [151 KiB] *.C file |
|
|
|
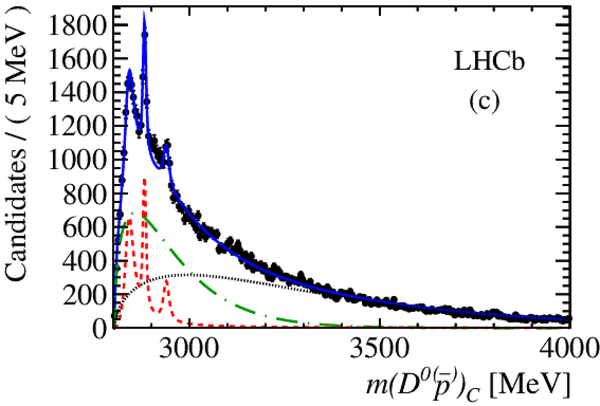
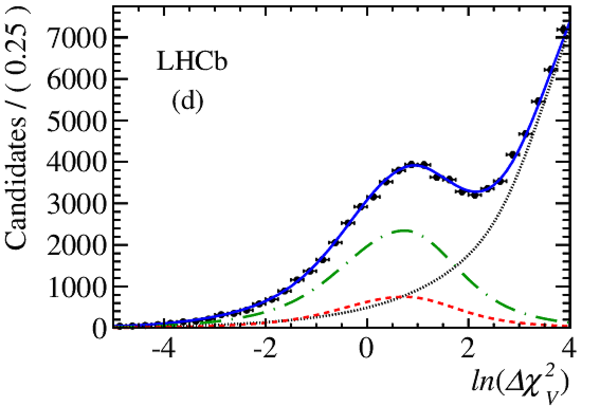
Projections of the two-dimensional fits to the (a) $m(D^0K^{\pm})_C$ and (c) $m(D^0\myoptbar{ p}{} )_C$ mass distributions and (b, d) ${\rm ln}(\Delta\chi^{2}_{\rm V})$ for (top) $ D ^0 K^{\pm} X\mu^- \overline{\nu}_{\mu}$ candidates, and (bottom) for $ D ^0 \myoptbar{ p}{} X\overline{\nu}_{\mu}$ candidates. The curves show projections of the 2D fit. The dashed (red) curves show the $D_{s1}^{+}$ and $D_{s2}^{*+}$ resonant components in (a) and (b), and $\Lambda ^+_ c (2860)$, $\Lambda ^+_ c (2880)$ and $\Lambda ^+_ c (2940)$ resonant components in (c) and (d). The long-dashed-dotted (green) curves show the nonresonant component, the dotted (black) curves are the background components, whose shapes are determined from wrong-sign combinations, and the solid (blue) curve shows all components added together. |
reduce[..].pdf [53 KiB] HiDef png [222 KiB] Thumbnail [181 KiB] *.C file |

|
|
reduce[..].pdf [18 KiB] HiDef png [205 KiB] Thumbnail [171 KiB] *.C file |

|
|
|
reduce[..].pdf [44 KiB] HiDef png [258 KiB] Thumbnail [211 KiB] *.C file |
|
|
|
reduce[..].pdf [18 KiB] HiDef png [212 KiB] Thumbnail [178 KiB] *.C file |
|
|
|
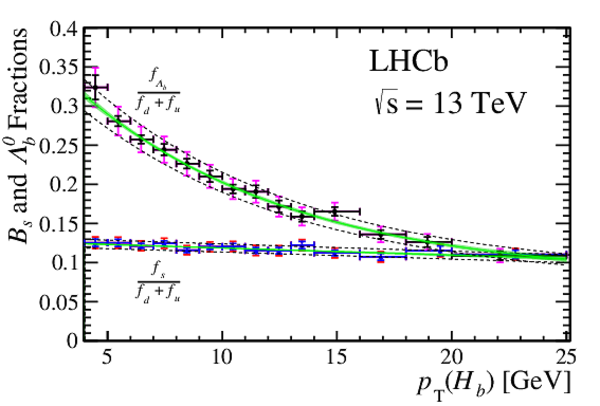
The ratios $f_{s}/(f_{u}+f_{d})$ and $f_{\Lambda ^0_ b }/(f_{u}+f_{d})$ in bins of $ p_{\mathrm{T}} (H_b)$. The $\overline{ B }{} {}^0_ s $ data are indicated by solid circles, while the $\Lambda ^0_ b $ by triangles. The smaller (black) error bars show the combined bin-by-bin statistical and systematic uncertainties, and the larger (blue) ones show the global systematics added in quadrature. The fits to the data are shown as the solid (green) bands, whose widths represents the $\pm 1 \sigma$ uncertainty limits on the fit shapes, and the dashed (black) lines give the total uncertainty on the fit results including the global scale uncertainty. In the highest two $ p_{\mathrm{T}}$ bins the points have been displaced from the center of the bin. |
BFract[..].pdf [21 KiB] HiDef png [294 KiB] Thumbnail [210 KiB] *.C file |
|
|
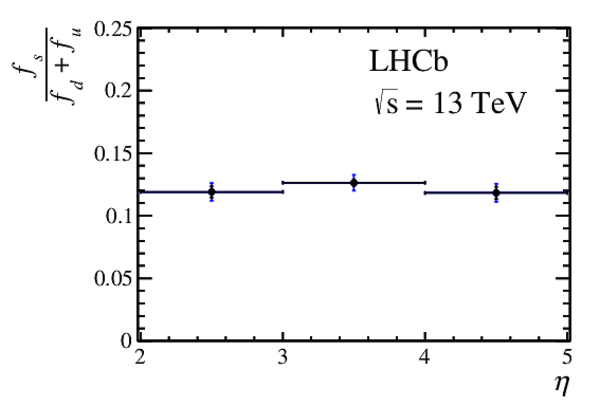
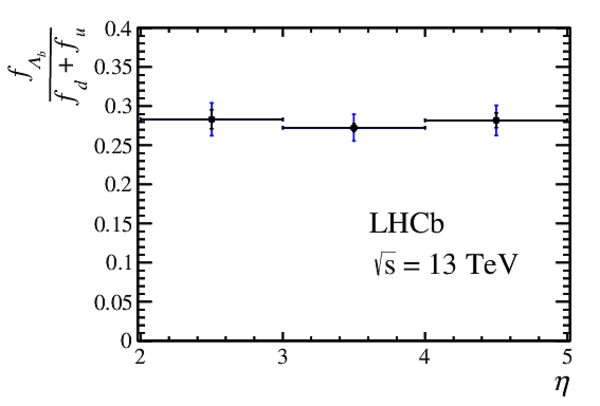
Measurement of the fraction ratios (a) $f_s/(f_u+f_d)$ and (b) $f_{\Lambda ^0_ b }/(f_u+f_d)$ as functions of $\eta$ integrated over $ p_{\mathrm{T}}$ . |
BFract[..].pdf [13 KiB] HiDef png [75 KiB] Thumbnail [71 KiB] *.C file |
|
|
BFract[..].pdf [14 KiB] HiDef png [88 KiB] Thumbnail [86 KiB] *.C file |
|
|
|
Animated gif made out of all figures. |
PAPER-2018-050.gif Thumbnail |

|
![HiDef png [201 KiB]](Directory_LHCb-PAPER-2018-050/hidef_D0_Mass_Pt_0_Eta_0.png)
![HiDef png [185 KiB]](Directory_LHCb-PAPER-2018-050/hidef_Dp_Mass_Pt_0_Eta_0.png)
![HiDef png [189 KiB]](Directory_LHCb-PAPER-2018-050/hidef_Ds_Mass_Pt_0_Eta_0.png)
![HiDef png [181 KiB]](Directory_LHCb-PAPER-2018-050/hidef_Lc_Mass_Pt_0_Eta_0.png)
![HiDef png [222 KiB]](Directory_LHCb-PAPER-2018-050/hidef_reduced_ntuple_2016combined_rs_mDK_full_range_2dfit_result.png)
![HiDef png [205 KiB]](Directory_LHCb-PAPER-2018-050/hidef_reduced_ntuple_2016combined_rs_ipchi2_full_range_2dfit_result.png)
![HiDef png [258 KiB]](Directory_LHCb-PAPER-2018-050/hidef_reduced_ntuple_2016combined_rs_mDp_full_range_2dfit_result_l1_forpaper.png)
![HiDef png [212 KiB]](Directory_LHCb-PAPER-2018-050/hidef_reduced_ntuple_2016combined_rs_ipchi2_full_range_2dfit_result_l1_forpaper.png)
![HiDef png [294 KiB]](Directory_LHCb-PAPER-2018-050/hidef_BFraction_fb_Fit_KFact.png)
![HiDef png [75 KiB]](Directory_LHCb-PAPER-2018-050/hidef_BFraction_fs_ETA.png)
![HiDef png [88 KiB]](Directory_LHCb-PAPER-2018-050/hidef_BFraction_fl_ETA.png)
Tables and captions
|
Branching fractions of semileptonic $b$-hadron decays from direct measurements for $\overline{ B }{} {}^0$ and $ B ^- $ mesons, ($\left< B\right>\equiv \left< \overline{ B }{} {}^0 +B^-\right>$), and derived for $\overline{ B }{} {}^0_ s $ and $\Lambda ^0_ b $ hadrons based on the equality of semileptonic widths and the lifetime ratios \cite{Tanabashi:2018oca,Bigi:2011gf}. Corrections to $\Gamma_{\rm SL}$ for $\overline{ B }{} {}^0_ s $ $(-1.0\pm 0.5)$% and $\Lambda ^0_ b $ $(3.0\pm 1.5)$% are applied \cite{Bigi:2011gf}. Correlations in the $\overline{ B }{} {}^0$ and $ B ^- $ branching fraction measurements have been taken into account. See Ref. \cite{Aaij:2016avz} for more information. |
Table_1.pdf [68 KiB] HiDef png [27 KiB] Thumbnail [10 KiB] tex code |

|
|
Charm-hadron branching fractions for the decay modes used in this analysis. Note, the $\Lambda ^+_ c $ branching fraction has been significantly improved since the previous analysis. |
Table_2.pdf [80 KiB] HiDef png [23 KiB] Thumbnail [9 KiB] tex code |

|
|
Global systematic uncertainties. The $D^{0}$ and $D^{+}$ branching fraction uncertainties are scaled by the fraction of each decay, $f_0$ and $f_+$ for $f_s/(f_u+f_d)$ and $f_{\Lambda ^0_ b }/(f_u+f_d)$ uncertainties. |
Table_3.pdf [86 KiB] HiDef png [74 KiB] Thumbnail [36 KiB] tex code |

|
|
Values of $f_s/(f_u+f_d)$ and $f_{\Lambda ^0_ b }/(f_u+f_d)$ in each $ p_{\mathrm{T}} (H_b)$ bin. The first uncertainty is statistical and incorporates both the uncertainties due to the data sample size and the finite amount of simulated events, while the second is the overall systematic uncertainty, including global and bin-dependent systematic uncertainties. |
Table_4.pdf [73 KiB] HiDef png [162 KiB] Thumbnail [88 KiB] tex code |

|
|
Covariance matrix for $f_s/(f_u+f_d)$ in $ p_{\mathrm{T}} (H_b)$ $ $[GeV] bins; it accounts for statistical and bin-dependent systematic uncertainties, but not the global systematic uncertainties. |
Table_5.pdf [49 KiB] HiDef png [158 KiB] Thumbnail [62 KiB] tex code |

|
|
Covariance matrix for $f_{\Lambda ^0_ b }/(f_u+f_d)$ in $ p_{\mathrm{T}} (H_b)$ $ $[GeV] bins; it accounts for statistical and bin-dependent systematic uncertainties, but not the global systematic uncertainties. |
Table_6.pdf [49 KiB] HiDef png [158 KiB] Thumbnail [56 KiB] tex code |

|
![HiDef png [27 KiB]](Directory_LHCb-PAPER-2018-050/hidef_Table_1.png)
![HiDef png [23 KiB]](Directory_LHCb-PAPER-2018-050/hidef_Table_2.png)
![HiDef png [74 KiB]](Directory_LHCb-PAPER-2018-050/hidef_Table_3.png)
![HiDef png [162 KiB]](Directory_LHCb-PAPER-2018-050/hidef_Table_4.png)
![HiDef png [158 KiB]](Directory_LHCb-PAPER-2018-050/hidef_Table_5.png)
![HiDef png [158 KiB]](Directory_LHCb-PAPER-2018-050/hidef_Table_6.png)
Created on 27 April 2024.