Information
LHCb-PAPER-2019-006
CERN-EP-2019-042
arXiv:1903.08726 [PDF]
(Submitted on 20 Mar 2019)
Phys. Rev. Lett. 122 (2019) 211803
Inspire 1726338
Tools
Abstract
A search for charge-parity ($C P$) violation in $D^0 \to K^- K^+$ and $D^0 \to \pi^- \pi^+$ decays is reported, using $pp$ collision data corresponding to an integrated luminosity of 6 $\mathrm{fb}^{-1}$ collected at a center-of-mass energy of 13 TeV with the LHCb detector. The flavor of the charm meson is inferred from the charge of the pion in $D^*(2010)^+ \to D^0 \pi^+$ decays or from the charge of the muon in $\overline{B} \to D^0 \mu^-\bar{\nu}_\mu X$ decays. The difference between the $C P$ asymmetries in $D^0 \to K^- K^+$ and $D^0 \to \pi^- \pi^+$ decays is measured to be $\Delta A_{C P} = [ -18.2 \pm 3.2 (\rm stat.) \pm 0.9 (\rm syst.) ] \times 10^{-4}$ for $\pi$-tagged and $\Delta A_{C P} = [ -9 \pm 8 (\rm stat.) \pm 5 (\rm syst.) ] \times 10^{-4} $ for $\mu$-tagged $D^0$ mesons. Combining these with previous LHCb results leads to $$\Delta A_{C P} = ( -15.4 \pm 2.9) \times 10^{-4},$$ where the uncertainty includes both statistical and systematic contributions. The measured value differs from zero by more than five standard deviations. This is the first observation of $C P$ violation in the decay of charm hadrons.
Figures and captions
|
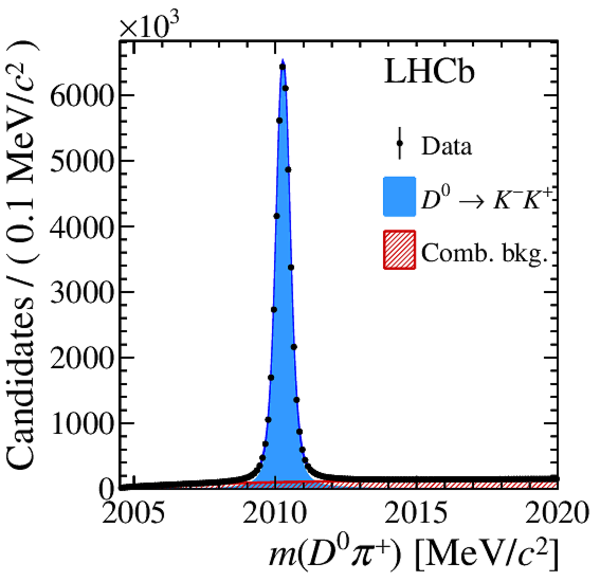
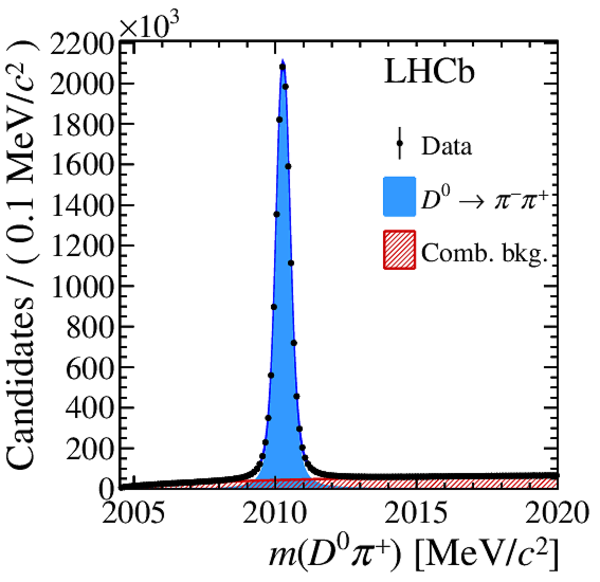
Mass distributions of selected (top) $\pi^\pm$-tagged and (bottom) $\mu^\pm$-tagged candidates for (left) $ K ^- K ^+ $ and (right) $\pi ^- \pi ^+ $ final states of the $ D ^0$ -meson decays, with fit projections overlaid. |
PR_DStarKK.pdf [54 KiB] HiDef png [312 KiB] Thumbnail [233 KiB] *.C file |
|
|
PR_DStarPP.pdf [55 KiB] HiDef png [351 KiB] Thumbnail [268 KiB] *.C file |
|
|
|
SL_D0KK.pdf [37 KiB] HiDef png [448 KiB] Thumbnail [282 KiB] *.C file |

|
|
|
SL_D0PP.pdf [42 KiB] HiDef png [517 KiB] Thumbnail [321 KiB] *.C file |

|
|
|
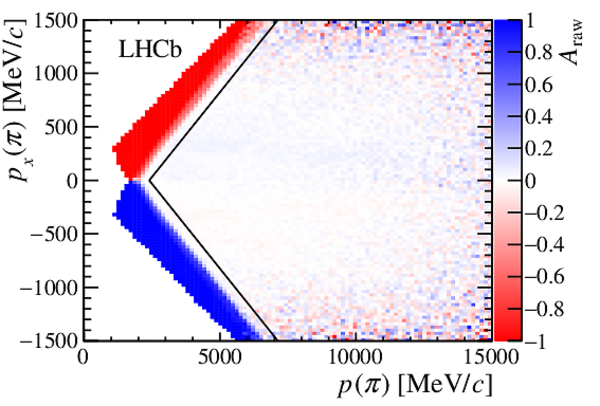
Raw asymmetries of the tagging pion for the $\pi$-tagged $ D ^0 \rightarrow K ^- K ^+ $ sample, with the polarity of the magnet (top) up and (bottom) down. The plots on the left include only candidates with $|p_y / p_z| < 0.02$, i.e., close to the horizontal plane, and the fiducial requirements used to exclude the kinematic region surrounding the beam pipe, characterized by large values of the raw asymmetry, are indicated as black lines (in addition to the forementioned requirement $|p_y / p_z| < 0.02$). The plots on the right include all candidates except those excluded by the beam-pipe fiducial requirements, and the black lines indicate the fiducial requirements used to exclude regions at the boundary of the detector acceptance, which are also characterized by large values of the raw asymmetry. Distributions for the $ D ^0 \rightarrow \pi ^- \pi ^+ $ sample are very similar. |
PR_fid[..].pdf [82 KiB] HiDef png [1 MiB] Thumbnail [599 KiB] *.C file |

|
|
PR_fid[..].pdf [79 KiB] HiDef png [1020 KiB] Thumbnail [582 KiB] *.C file |

|
|
|
PR_fid[..].pdf [82 KiB] HiDef png [1 MiB] Thumbnail [601 KiB] *.C file |

|
|
|
PR_fid[..].pdf [79 KiB] HiDef png [1 MiB] Thumbnail [583 KiB] *.C file |

|
|
|
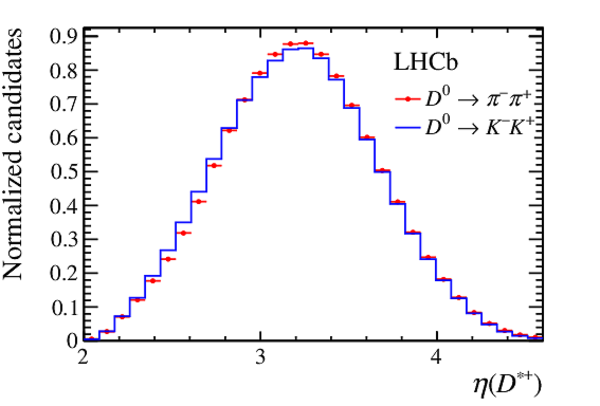
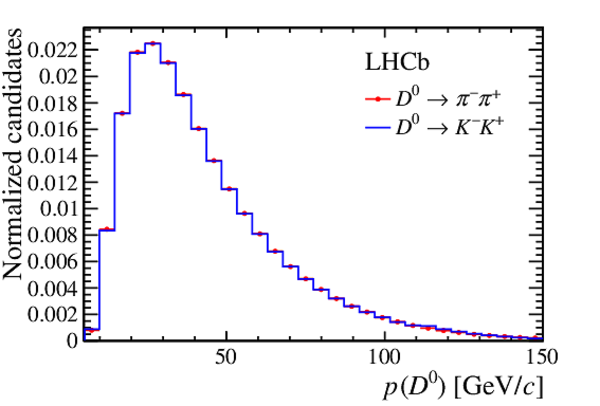
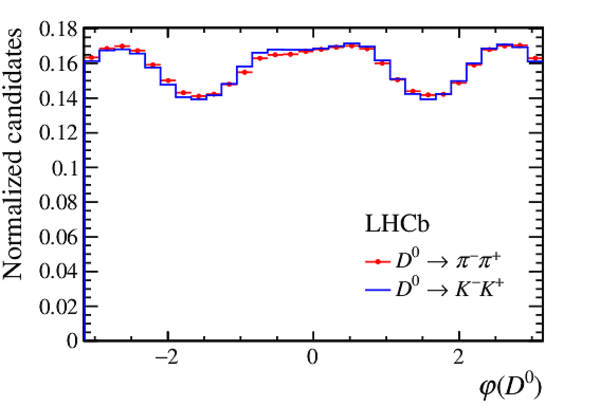
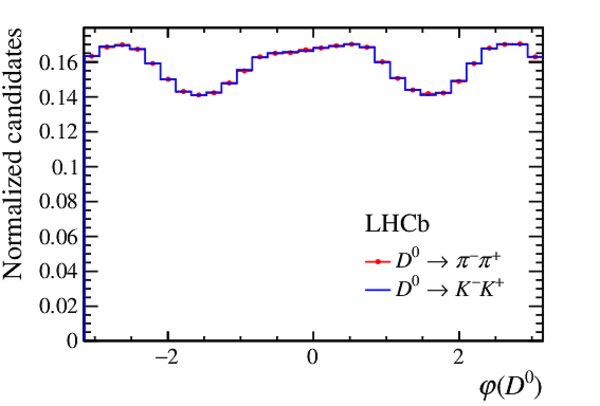
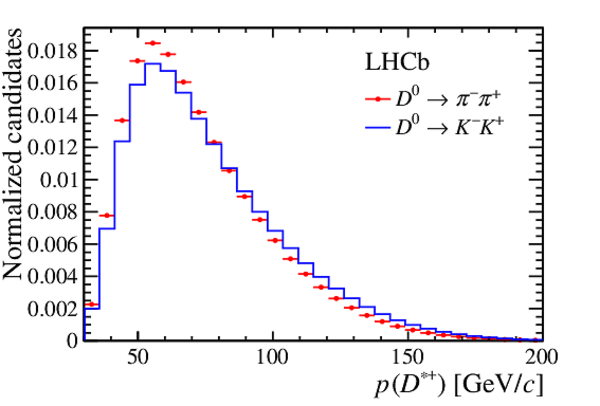
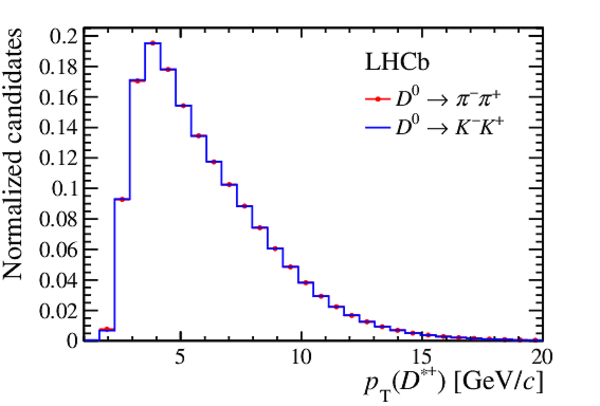
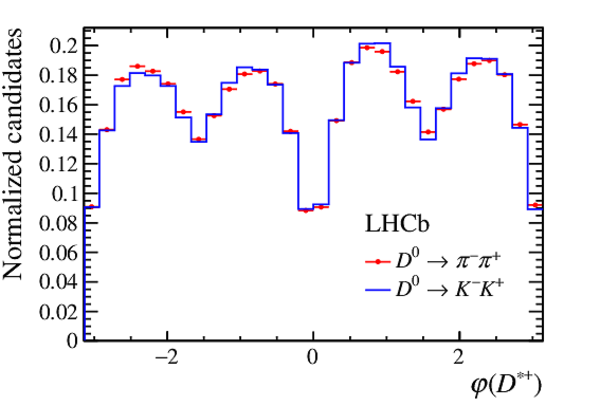
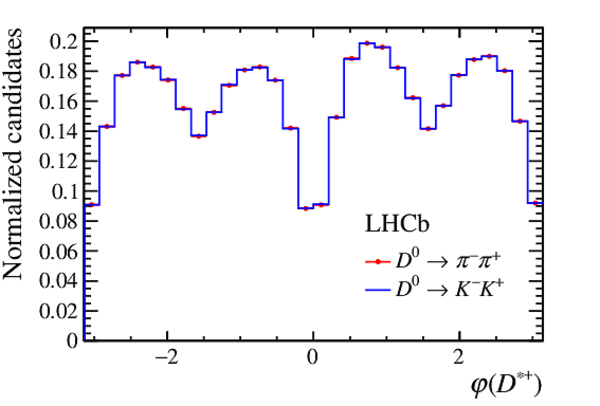
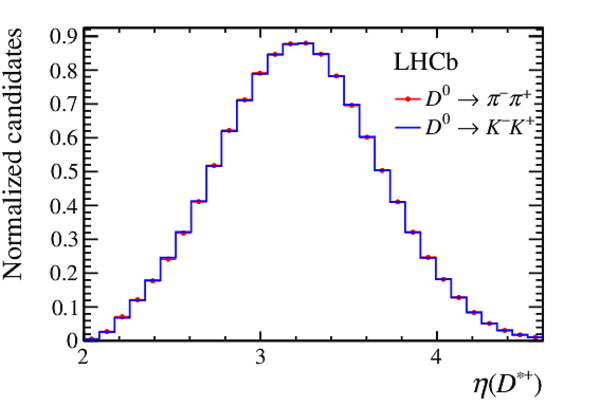
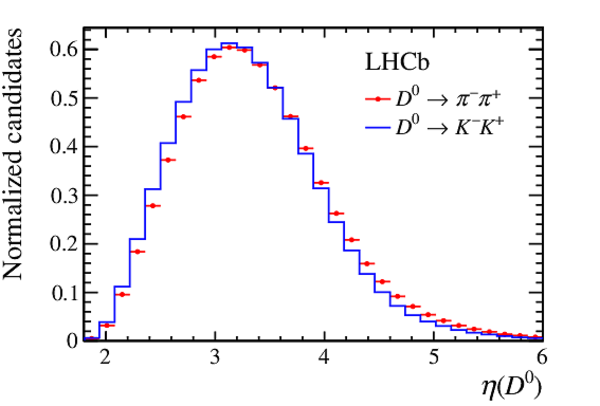
Background-subtracted distributions of momentum ($p$), transverse momentum ($ p_{\mathrm{T}} $), azimuthal angle ($\varphi$) and pseudorapidity ($\eta$) of $ D ^{*+}$ mesons for the prompt sample: (left column) before and (right column) after the weighting procedure for $ D ^0 \rightarrow K ^- K ^+ $ and $ D ^0 \rightarrow \pi ^- \pi ^+ $ decays, as indicated in the legends. The distributions are normalized to unit area. |
PR_dst[..].pdf [15 KiB] HiDef png [154 KiB] Thumbnail [152 KiB] *.C file |

|
|
PR_dst[..].pdf [15 KiB] HiDef png [152 KiB] Thumbnail [149 KiB] *.C file |

|
|
|
PR_dst[..].pdf [15 KiB] HiDef png [142 KiB] Thumbnail [143 KiB] *.C file |

|
|
|
PR_dst[..].pdf [15 KiB] HiDef png [140 KiB] Thumbnail [140 KiB] *.C file |

|
|
|
PR_dst[..].pdf [15 KiB] HiDef png [137 KiB] Thumbnail [131 KiB] *.C file |

|
|
|
PR_dst[..].pdf [15 KiB] HiDef png [135 KiB] Thumbnail [128 KiB] *.C file |

|
|
|
PR_dst[..].pdf [15 KiB] HiDef png [123 KiB] Thumbnail [126 KiB] *.C file |
|
|
|
PR_dst[..].pdf [15 KiB] HiDef png [121 KiB] Thumbnail [123 KiB] *.C file |

|
|
|
Background-subtracted distributions of momentum ($p$), transverse momentum ($ p_{\mathrm{T}} $), azimuthal angle ($\varphi$) and pseudorapidity ($\eta$) of $ D ^0$ mesons for the semileptonic sample: (left column) before and (right column) after the weighting procedure for $ D ^0 \rightarrow K ^- K ^+ $ and $ D ^0 \rightarrow \pi ^- \pi ^+ $ decays, as indicated in the legends. The distributions are normalized to unit area. |
SL_D0_[..].pdf [15 KiB] HiDef png [159 KiB] Thumbnail [154 KiB] *.C file |

|
|
SL_D0_[..].pdf [15 KiB] HiDef png [158 KiB] Thumbnail [153 KiB] *.C file |
|
|
|
SL_D0_[..].pdf [15 KiB] HiDef png [147 KiB] Thumbnail [145 KiB] *.C file |

|
|
|
SL_D0_[..].pdf [15 KiB] HiDef png [142 KiB] Thumbnail [139 KiB] *.C file |

|
|
|
SL_D0_[..].pdf [15 KiB] HiDef png [129 KiB] Thumbnail [121 KiB] *.C file |
|
|
|
SL_D0_[..].pdf [15 KiB] HiDef png [125 KiB] Thumbnail [117 KiB] *.C file |
|
|
|
SL_D0_[..].pdf [15 KiB] HiDef png [119 KiB] Thumbnail [117 KiB] *.C file |

|
|
|
SL_D0_[..].pdf [15 KiB] HiDef png [116 KiB] Thumbnail [112 KiB] *.C file |

|
|
|
Raw asymmetries in the $\pi$-tagged sample for (left) $ D ^0 \rightarrow K ^- K ^+ $ and (right) $ D ^0 \rightarrow \pi ^- \pi ^+ $ candidates as a function of $m( D ^0 \pi ^+ )$. |
PR_DSt[..].pdf [24 KiB] HiDef png [249 KiB] Thumbnail [258 KiB] *.C file |

|
|
PR_DSt[..].pdf [24 KiB] HiDef png [259 KiB] Thumbnail [269 KiB] *.C file |

|
|
|
Raw asymmetries in the $\mu$-tagged sample for (left) $ D ^0 \rightarrow K ^- K ^+ $ and (right) $ D ^0 \rightarrow \pi ^- \pi ^+ $ candidates as a function of $m( D ^0 )$. |
SL_D0K[..].pdf [21 KiB] HiDef png [207 KiB] Thumbnail [208 KiB] *.C file |

|
|
SL_D0P[..].pdf [24 KiB] HiDef png [238 KiB] Thumbnail [246 KiB] *.C file |

|
|
|
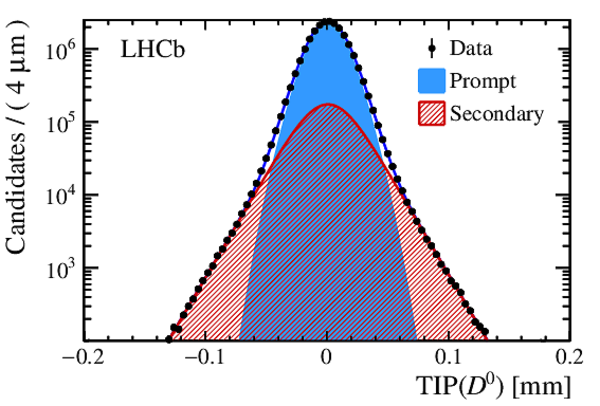
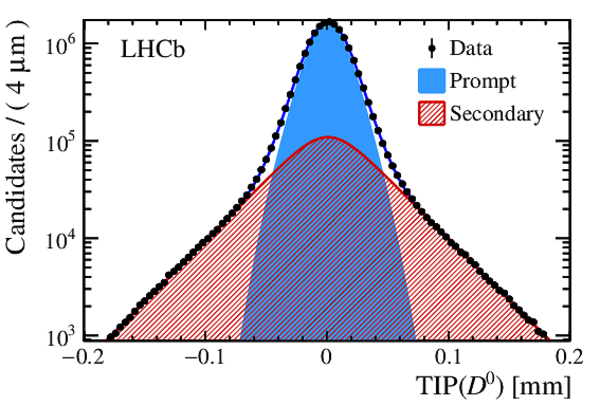
Distributions of the signed $ D ^0$ impact parameter in the plane transverse to the beam direction, $\text{TIP}$ , in bins of reconstructed $ D ^0$ decay time, for the $\pi$-tagged $ D ^0 \rightarrow K ^- K ^+ $ sample: (top left) $\tilde{t} < 1.5$, (top right) $1.5 < \tilde{t} < 3.0$, (bottom left) $3.0 < \tilde{t} < 4.5$ and (bottom right) $\tilde{t} > 4.5$, where $\tilde{t} \equiv t / \tau( D ^0 )$. The fit results are overlaid and the contributions from prompt and secondary decays are shown, as indicated in the legends. Distributions for the $ D ^0 \rightarrow \pi ^- \pi ^+ $ sample are very similar. |
PR_TIP[..].pdf [30 KiB] HiDef png [906 KiB] Thumbnail [415 KiB] *.C file |
|
|
PR_TIP[..].pdf [34 KiB] HiDef png [983 KiB] Thumbnail [445 KiB] *.C file |
|
|
|
PR_TIP[..].pdf [36 KiB] HiDef png [1 MiB] Thumbnail [586 KiB] *.C file |

|
|
|
PR_TIP[..].pdf [36 KiB] HiDef png [1 MiB] Thumbnail [700 KiB] *.C file |

|
|
|
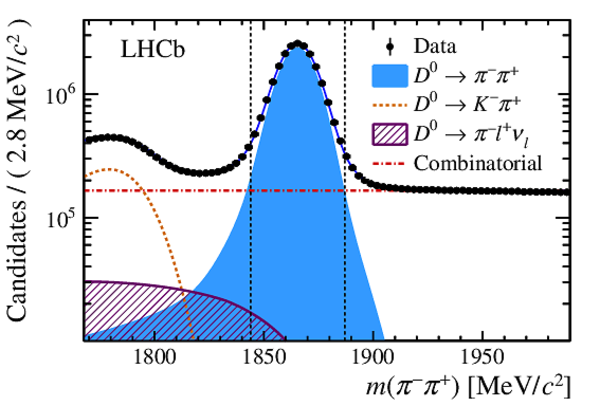
Invariant-mass distributions of (top) $ D ^0 \rightarrow K ^- K ^+ $ and (bottom) $ D ^0 \rightarrow \pi ^- \pi ^+ $ candidates in the prompt sample with fit results overlaid. These fits are used to determine the yields and raw asymmetries of (top) $ D ^0 \rightarrow K^-\pi^+\pi^0$ and (bottom) $ D ^0 \rightarrow \pi^-l^+\nu_l$ backgrounds, whose mass shapes extend to the $ D ^0$ -signal mass region. The various components included in the fit model are indicated in the legends. |
PR_pea[..].pdf [34 KiB] HiDef png [533 KiB] Thumbnail [354 KiB] *.C file |

|
|
PR_pea[..].pdf [32 KiB] HiDef png [353 KiB] Thumbnail [250 KiB] *.C file |

|
|
|
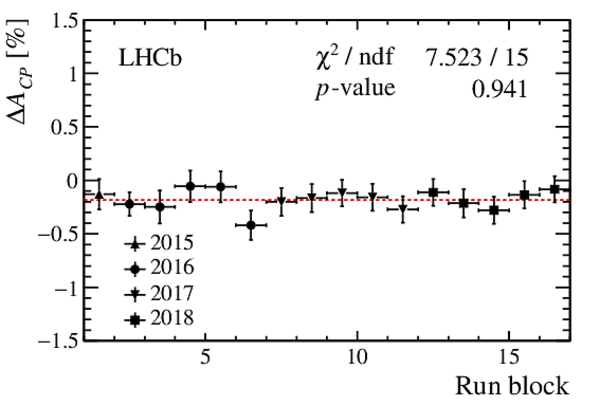
Measurements of $\Delta A_{ C P }$ in time-ordered data-taking subsamples (referred to as run blocks) for (left) prompt and (right) semileptonic samples. The uncertainties are statistical only. The horizontal red-dashed lines show the central values of the nominal results. |
PR_run[..].pdf [15 KiB] HiDef png [135 KiB] Thumbnail [143 KiB] *.C file |

|
|
SL_run[..].pdf [15 KiB] HiDef png [135 KiB] Thumbnail [138 KiB] *.C file |

|
|
|
Measurements of $\Delta A_{ C P }$ in bins of $ D ^0$ decay time for (left) prompt and (right) semileptonic samples. In each plot, the last bin on the right also includes a few overflow candidates. The uncertainties are statistical only. The horizontal red-dashed lines show the central values of the nominal results. |
PR_D0_tau.pdf [14 KiB] HiDef png [114 KiB] Thumbnail [113 KiB] *.C file |

|
|
SL_D0_tau.pdf [14 KiB] HiDef png [115 KiB] Thumbnail [113 KiB] *.C file |

|
|
|
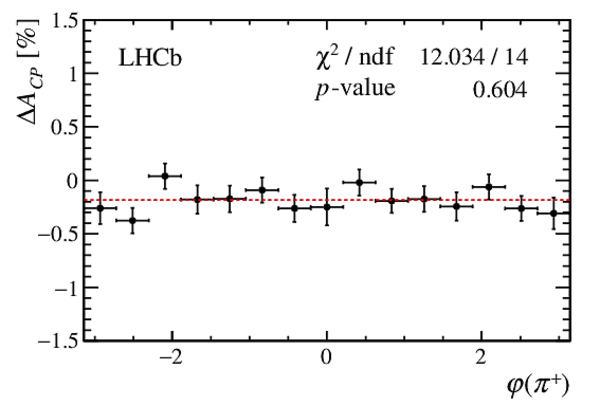
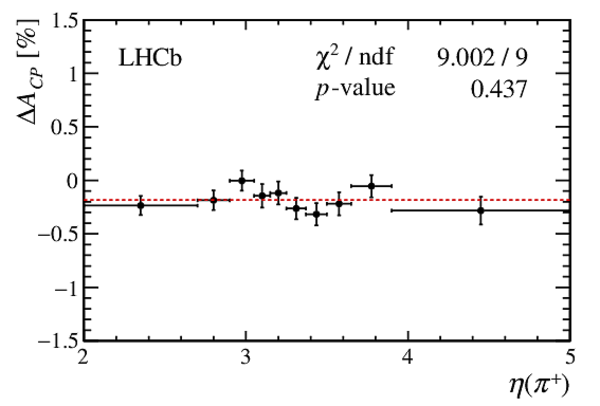
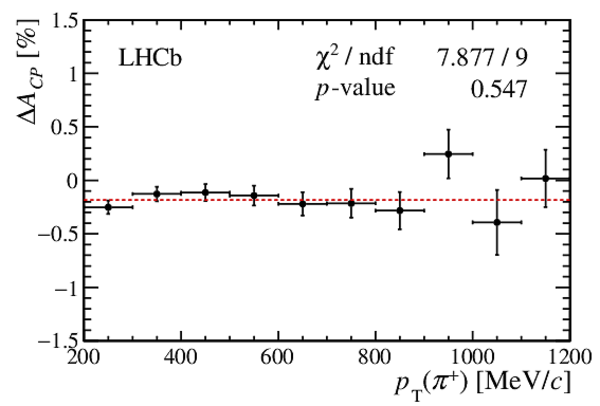
Measurements of $\Delta A_{ C P }$ in bins of (top left) pseudorapidity, (top right) azimuthal angle, (bottom left) transverse momentum and (bottom right) $\chi^2_{\text{IP}}$ of tagging pions for the prompt sample. In each plot but that of the azimuthal angle, the last bin on the right also includes a few overflow candidates. The uncertainties are statistical only. The horizontal red-dashed lines show the central value of the nominal result. |
PR_sof[..].pdf [14 KiB] HiDef png [108 KiB] Thumbnail [108 KiB] *.C file |

|
|
PR_sof[..].pdf [15 KiB] HiDef png [113 KiB] Thumbnail [114 KiB] *.C file |
|
|
|
PR_sof[..].pdf [14 KiB] HiDef png [132 KiB] Thumbnail [132 KiB] *.C file |

|
|
|
PR_sof[..].pdf [14 KiB] HiDef png [111 KiB] Thumbnail [111 KiB] *.C file |

|
|
|
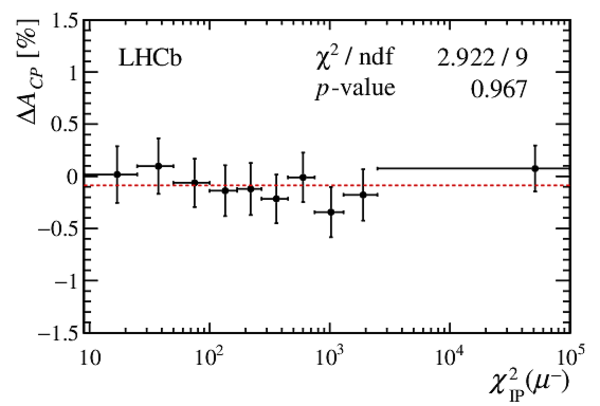
Measurements of $\Delta A_{ C P }$ in bins of (top left) pseudorapidity, (top right) azimuthal angle, (bottom left) transverse momentum and (bottom right) $\chi^2_{\text{IP}}$ of tagging muons for the semileptonic sample. In each plot but that of the azimuthal angle, the last bin on the right also includes a few overflow candidates. The uncertainties are statistical only. The horizontal red-dashed lines show the central value of the nominal result. |
SL_mu_eta.pdf [14 KiB] HiDef png [110 KiB] Thumbnail [109 KiB] *.C file |

|
|
SL_mu_phi.pdf [15 KiB] HiDef png [117 KiB] Thumbnail [117 KiB] *.C file |

|
|
|
SL_mu_pt.pdf [14 KiB] HiDef png [130 KiB] Thumbnail [127 KiB] *.C file |

|
|
|
SL_mu_[..].pdf [15 KiB] HiDef png [125 KiB] Thumbnail [126 KiB] *.C file |

|
|
|
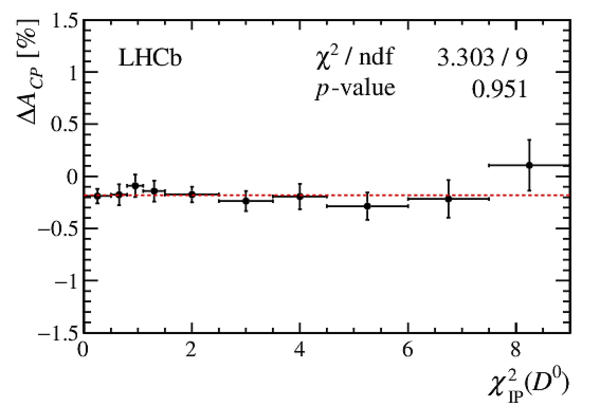
Measurements of $\Delta A_{ C P }$ in bins of $ D ^0$ $\chi^2_{\text{IP}}$ for (left) prompt and (right) semileptonic samples. In each plot, the last bin on the right also includes a few overflow candidates. The uncertainties are statistical only. The horizontal red-dashed lines show the central values of the nominal results. |
PR_D0_[..].pdf [14 KiB] HiDef png [114 KiB] Thumbnail [112 KiB] *.C file |

|
|
SL_D0_[..].pdf [15 KiB] HiDef png [130 KiB] Thumbnail [134 KiB] *.C file |

|
|
|
Animated gif made out of all figures. |
PAPER-2019-006.gif Thumbnail |

|
Tables and captions
|
Systematic uncertainties on $\Delta A_{ C P }$ for $\pi$- and $\mu$-tagged decays (in $10^{-4}$). The total uncertainties are obtained as the sums in quadrature of the individual contributions. |
Table_1.pdf [39 KiB] HiDef png [83 KiB] Thumbnail [36 KiB] tex code |

|
Supplementary Material [file]


![HiDef png [312 KiB]](Directory_LHCb-PAPER-2019-006/hidef_PR_DStarKK.png)
![HiDef png [351 KiB]](Directory_LHCb-PAPER-2019-006/hidef_PR_DStarPP.png)
![HiDef png [448 KiB]](Directory_LHCb-PAPER-2019-006/hidef_SL_D0KK.png)
![HiDef png [517 KiB]](Directory_LHCb-PAPER-2019-006/hidef_SL_D0PP.png)
![HiDef png [1 MiB]](Directory_LHCb-PAPER-2019-006/hidef_PR_fiducial_bp_Down.png)
![HiDef png [1020 KiB]](Directory_LHCb-PAPER-2019-006/hidef_PR_fiducial_Down.png)
![HiDef png [1 MiB]](Directory_LHCb-PAPER-2019-006/hidef_PR_fiducial_bp_Up.png)
![HiDef png [1 MiB]](Directory_LHCb-PAPER-2019-006/hidef_PR_fiducial_Up.png)
![HiDef png [154 KiB]](Directory_LHCb-PAPER-2019-006/hidef_PR_dst_p_weight.png)
![HiDef png [152 KiB]](Directory_LHCb-PAPER-2019-006/hidef_PR_dst_p_weight_rew.png)
![HiDef png [142 KiB]](Directory_LHCb-PAPER-2019-006/hidef_PR_dst_pt_weight.png)
![HiDef png [140 KiB]](Directory_LHCb-PAPER-2019-006/hidef_PR_dst_pt_weight_rew.png)
![HiDef png [137 KiB]](Directory_LHCb-PAPER-2019-006/hidef_PR_dst_phi_weight.png)
![HiDef png [135 KiB]](Directory_LHCb-PAPER-2019-006/hidef_PR_dst_phi_weight_rew.png)
![HiDef png [123 KiB]](Directory_LHCb-PAPER-2019-006/hidef_PR_dst_eta_weight.png)
![HiDef png [121 KiB]](Directory_LHCb-PAPER-2019-006/hidef_PR_dst_eta_weight_rew.png)
![HiDef png [159 KiB]](Directory_LHCb-PAPER-2019-006/hidef_SL_D0_p_weight.png)
![HiDef png [158 KiB]](Directory_LHCb-PAPER-2019-006/hidef_SL_D0_p_weight_rew.png)
![HiDef png [147 KiB]](Directory_LHCb-PAPER-2019-006/hidef_SL_D0_pt_weight.png)
![HiDef png [142 KiB]](Directory_LHCb-PAPER-2019-006/hidef_SL_D0_pt_weight_rew.png)
![HiDef png [129 KiB]](Directory_LHCb-PAPER-2019-006/hidef_SL_D0_phi_weight.png)
![HiDef png [125 KiB]](Directory_LHCb-PAPER-2019-006/hidef_SL_D0_phi_weight_rew.png)
![HiDef png [119 KiB]](Directory_LHCb-PAPER-2019-006/hidef_SL_D0_eta_weight.png)
![HiDef png [116 KiB]](Directory_LHCb-PAPER-2019-006/hidef_SL_D0_eta_weight_rew.png)
![HiDef png [249 KiB]](Directory_LHCb-PAPER-2019-006/hidef_PR_DStarKK_asymm.png)
![HiDef png [259 KiB]](Directory_LHCb-PAPER-2019-006/hidef_PR_DStarPP_asymm.png)
![HiDef png [207 KiB]](Directory_LHCb-PAPER-2019-006/hidef_SL_D0KK_asymm.png)
![HiDef png [238 KiB]](Directory_LHCb-PAPER-2019-006/hidef_SL_D0PP_asymm.png)
![HiDef png [906 KiB]](Directory_LHCb-PAPER-2019-006/hidef_PR_TIP_KK_1.png)
![HiDef png [983 KiB]](Directory_LHCb-PAPER-2019-006/hidef_PR_TIP_KK_2.png)
![HiDef png [1 MiB]](Directory_LHCb-PAPER-2019-006/hidef_PR_TIP_KK_3.png)
![HiDef png [1 MiB]](Directory_LHCb-PAPER-2019-006/hidef_PR_TIP_KK_4.png)
![HiDef png [533 KiB]](Directory_LHCb-PAPER-2019-006/hidef_PR_peaking_KK.png)
![HiDef png [353 KiB]](Directory_LHCb-PAPER-2019-006/hidef_PR_peaking_PP.png)
![HiDef png [135 KiB]](Directory_LHCb-PAPER-2019-006/hidef_PR_runNumber.png)
![HiDef png [135 KiB]](Directory_LHCb-PAPER-2019-006/hidef_SL_runNumber.png)
![HiDef png [114 KiB]](Directory_LHCb-PAPER-2019-006/hidef_PR_D0_tau.png)
![HiDef png [115 KiB]](Directory_LHCb-PAPER-2019-006/hidef_SL_D0_tau.png)
![HiDef png [108 KiB]](Directory_LHCb-PAPER-2019-006/hidef_PR_softPi_eta.png)
![HiDef png [113 KiB]](Directory_LHCb-PAPER-2019-006/hidef_PR_softPi_phi.png)
![HiDef png [132 KiB]](Directory_LHCb-PAPER-2019-006/hidef_PR_softPi_pt.png)
![HiDef png [111 KiB]](Directory_LHCb-PAPER-2019-006/hidef_PR_softPi_ipchi2.png)
![HiDef png [110 KiB]](Directory_LHCb-PAPER-2019-006/hidef_SL_mu_eta.png)
![HiDef png [117 KiB]](Directory_LHCb-PAPER-2019-006/hidef_SL_mu_phi.png)
![HiDef png [130 KiB]](Directory_LHCb-PAPER-2019-006/hidef_SL_mu_pt.png)
![HiDef png [125 KiB]](Directory_LHCb-PAPER-2019-006/hidef_SL_mu_ipchi2.png)
![HiDef png [114 KiB]](Directory_LHCb-PAPER-2019-006/hidef_PR_D0_ipchi2.png)
![HiDef png [130 KiB]](Directory_LHCb-PAPER-2019-006/hidef_SL_D0_ipchi2.png)
![HiDef png [83 KiB]](Directory_LHCb-PAPER-2019-006/hidef_Table_1.png)
![HiDef png [906 KiB]](Directory_LHCb-PAPER-2019-006/supplementary/hidef_Fig10a.png)
![HiDef png [1 MiB]](Directory_LHCb-PAPER-2019-006/supplementary/hidef_Fig10b.png)
![HiDef png [1 MiB]](Directory_LHCb-PAPER-2019-006/supplementary/hidef_Fig10c.png)
![HiDef png [1 MiB]](Directory_LHCb-PAPER-2019-006/supplementary/hidef_Fig10d.png)
![HiDef png [533 KiB]](Directory_LHCb-PAPER-2019-006/supplementary/hidef_Fig11a.png)
![HiDef png [353 KiB]](Directory_LHCb-PAPER-2019-006/supplementary/hidef_Fig11b.png)
![HiDef png [135 KiB]](Directory_LHCb-PAPER-2019-006/supplementary/hidef_Fig2a.png)
![HiDef png [135 KiB]](Directory_LHCb-PAPER-2019-006/supplementary/hidef_Fig2b.png)
![HiDef png [114 KiB]](Directory_LHCb-PAPER-2019-006/supplementary/hidef_Fig3a.png)
![HiDef png [115 KiB]](Directory_LHCb-PAPER-2019-006/supplementary/hidef_Fig3b.png)
![HiDef png [108 KiB]](Directory_LHCb-PAPER-2019-006/supplementary/hidef_Fig4a.png)
![HiDef png [113 KiB]](Directory_LHCb-PAPER-2019-006/supplementary/hidef_Fig4b.png)
![HiDef png [132 KiB]](Directory_LHCb-PAPER-2019-006/supplementary/hidef_Fig4c.png)
![HiDef png [111 KiB]](Directory_LHCb-PAPER-2019-006/supplementary/hidef_Fig4d.png)
![HiDef png [110 KiB]](Directory_LHCb-PAPER-2019-006/supplementary/hidef_Fig5a.png)
![HiDef png [117 KiB]](Directory_LHCb-PAPER-2019-006/supplementary/hidef_Fig5b.png)
![HiDef png [130 KiB]](Directory_LHCb-PAPER-2019-006/supplementary/hidef_Fig5c.png)
![HiDef png [125 KiB]](Directory_LHCb-PAPER-2019-006/supplementary/hidef_Fig5d.png)
![HiDef png [114 KiB]](Directory_LHCb-PAPER-2019-006/supplementary/hidef_Fig6a.png)
![HiDef png [130 KiB]](Directory_LHCb-PAPER-2019-006/supplementary/hidef_Fig6b.png)
![HiDef png [154 KiB]](Directory_LHCb-PAPER-2019-006/supplementary/hidef_Fig7a.png)
![HiDef png [152 KiB]](Directory_LHCb-PAPER-2019-006/supplementary/hidef_Fig7b.png)
![HiDef png [142 KiB]](Directory_LHCb-PAPER-2019-006/supplementary/hidef_Fig7c.png)
![HiDef png [140 KiB]](Directory_LHCb-PAPER-2019-006/supplementary/hidef_Fig7d.png)
![HiDef png [137 KiB]](Directory_LHCb-PAPER-2019-006/supplementary/hidef_Fig7e.png)
![HiDef png [135 KiB]](Directory_LHCb-PAPER-2019-006/supplementary/hidef_Fig7f.png)
![HiDef png [123 KiB]](Directory_LHCb-PAPER-2019-006/supplementary/hidef_Fig7g.png)
![HiDef png [121 KiB]](Directory_LHCb-PAPER-2019-006/supplementary/hidef_Fig7h.png)
![HiDef png [159 KiB]](Directory_LHCb-PAPER-2019-006/supplementary/hidef_Fig8a.png)
![HiDef png [158 KiB]](Directory_LHCb-PAPER-2019-006/supplementary/hidef_Fig8b.png)
![HiDef png [147 KiB]](Directory_LHCb-PAPER-2019-006/supplementary/hidef_Fig8c.png)
![HiDef png [142 KiB]](Directory_LHCb-PAPER-2019-006/supplementary/hidef_Fig8d.png)
![HiDef png [129 KiB]](Directory_LHCb-PAPER-2019-006/supplementary/hidef_Fig8e.png)
![HiDef png [125 KiB]](Directory_LHCb-PAPER-2019-006/supplementary/hidef_Fig8f.png)
![HiDef png [119 KiB]](Directory_LHCb-PAPER-2019-006/supplementary/hidef_Fig8g.png)
![HiDef png [116 KiB]](Directory_LHCb-PAPER-2019-006/supplementary/hidef_Fig8h.png)
![HiDef png [1 MiB]](Directory_LHCb-PAPER-2019-006/supplementary/hidef_Fig9a.png)
![HiDef png [1 MiB]](Directory_LHCb-PAPER-2019-006/supplementary/hidef_Fig9b.png)
![HiDef png [1 MiB]](Directory_LHCb-PAPER-2019-006/supplementary/hidef_Fig9c.png)
![HiDef png [1018 KiB]](Directory_LHCb-PAPER-2019-006/supplementary/hidef_Fig9d.png)
![HiDef png [361 KiB]](Directory_LHCb-PAPER-2019-006/supplementary/hidef_LHCb-PAPER-2019-006-supplementary.png)
Created on 27 April 2024.