Observation of a narrow pentaquark state, $P_c(4312)^+$, and of two-peak structure of the $P_c(4450)^+$
[to restricted-access page]Information
LHCb-PAPER-2019-014
CERN-EP-2019-058
arXiv:1904.03947 [PDF]
(Submitted on 08 Apr 2019)
Phys. Rev. Lett. 122 (2019) 222001
Inspire 1728691
Tools
Abstract
A narrow pentaquark state, $P_c(4312)^+$, decaying to $J/\psi p$ is discovered with a statistical significance of $7.3\sigma$ in a data sample of ${\Lambda_b^0\to J/\psi p K^-}$ decays which is an order of magnitude larger than that previously analyzed by the LHCb collaboration. The $P_c(4450)^+$ pentaquark structure formerly reported by LHCb is confirmed and observed to consist of two narrow overlapping peaks, $P_c(4440)^+$ and $P_c(4457)^+$, where the statistical significance of this two-peak interpretation is $5.4\sigma$. Proximity of the $\Sigma_c^+\bar{D}^{0}$ and $\Sigma_c^+\bar{D}^{*0}$ thresholds to the observed narrow peaks suggests that they play an important role in the dynamics of these states.
Figures and captions
|
Distribution of (left) $m_{ { J \mskip -3mu/\mskip -2mu\psi \mskip 2mu} p}$ and (right) $m_{Kp}$ for $\Lambda ^0_ b \rightarrow { J \mskip -3mu/\mskip -2mu\psi \mskip 2mu} p K ^- $ candidates. The prominent peak in $m_{Kp}$ is due to the $\Lambda (1520)$ resonance. |
mjpsip[..].pdf [28 KiB] HiDef png [139 KiB] Thumbnail [73 KiB] *.C file |

|
|
mkp-sp[..].pdf [22 KiB] HiDef png [88 KiB] Thumbnail [46 KiB] *.C file |

|
|
|
Dalitz plot of $\Lambda ^0_ b \rightarrow { J \mskip -3mu/\mskip -2mu\psi \mskip 2mu} p K ^- $ candidates. The data contain $6.4\%$ of non-$\Lambda ^0_ b $ backgrounds, which are distributed smoothly over the phase-space. The vertical bands correspond to the $\Lambda ^*$ resonances. The horizontal bands correspond to the $P_c(4312)^+$, $P_c(4440)^+$, and $P_c(4457)^+$ structures at $m_{ { J \mskip -3mu/\mskip -2mu\psi \mskip 2mu} p}^2 = 18.6$, $19.7$, and $19.9\text{ Ge V} ^2$, respectively. |
Dalitz[..].pdf [156 KiB] HiDef png [2 MiB] Thumbnail [725 KiB] *.C file |

|
|
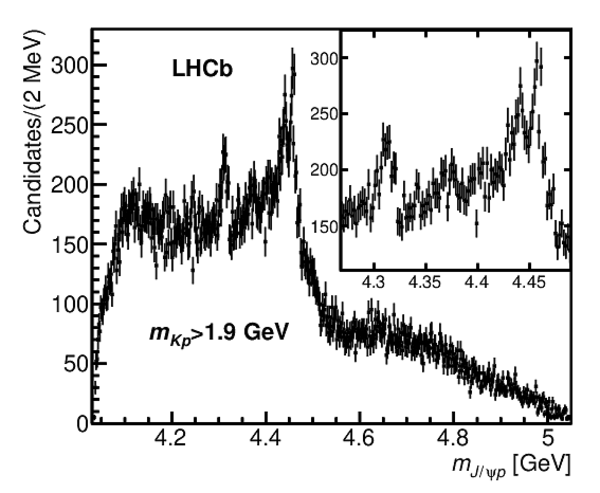
Distribution of $m_{ { J \mskip -3mu/\mskip -2mu\psi \mskip 2mu} p}$ from $\Lambda ^0_ b \rightarrow { J \mskip -3mu/\mskip -2mu\psi \mskip 2mu} p K ^- $ candidates after suppression of the dominant $\Lambda ^*\rightarrow p K ^- $ contributions with the $m_{Kp}>1.9$ $\text{ Ge V}$ requirement. The inset shows a zoom into the region of the narrow $P_c^+$ peaks. |
mjpsip[..].pdf [30 KiB] HiDef png [203 KiB] Thumbnail [121 KiB] *.C file |
|
|
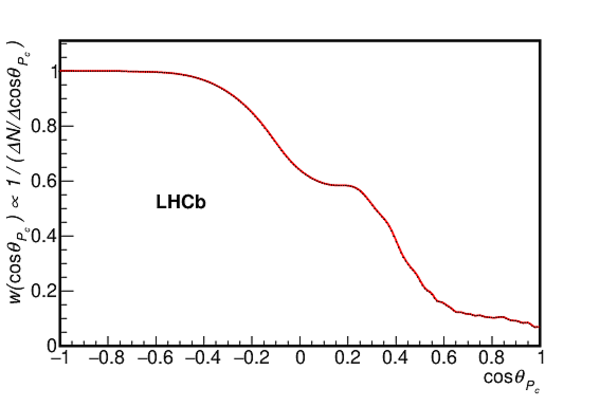
Weight function $w(\cos\theta_{Pc})$ applied to candidates, determined as the inverse of the density of $\Lambda ^0_ b $ candidates in the narrow $P_c^+$ peak region. The red line is a spline function used to interpolate between bin centers. |
weight.pdf [16 KiB] HiDef png [119 KiB] Thumbnail [98 KiB] *.C file |

|
|
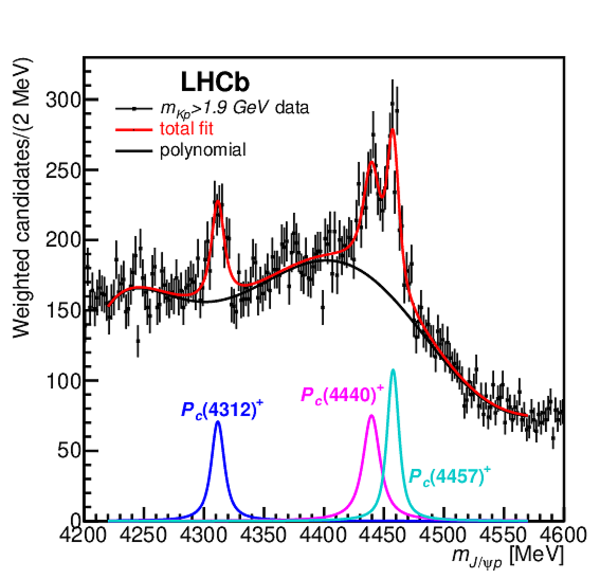
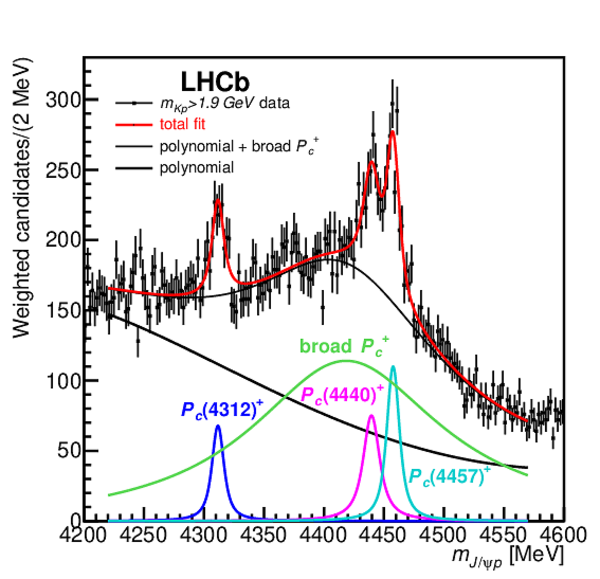
Fits to the $m_{ { J \mskip -3mu/\mskip -2mu\psi \mskip 2mu} p}$ distributions of the (top row) inclusive, (middle row) $m_{Kp}>1.9$ $\text{ Ge V}$ , and (bottom row) $\cos\theta_{Pc}$-weighted samples with three incoherently summed BW amplitudes representing the narrow $P_c^+$ signals on top of a (left column) high-order polynomial function or (right column) lower-order polynomial plus a broad $P_c^+$ state represented by a fourth BW amplitude. |
mjpsip2x3.pdf [262 KiB] HiDef png [675 KiB] Thumbnail [494 KiB] *.C file |

|
|
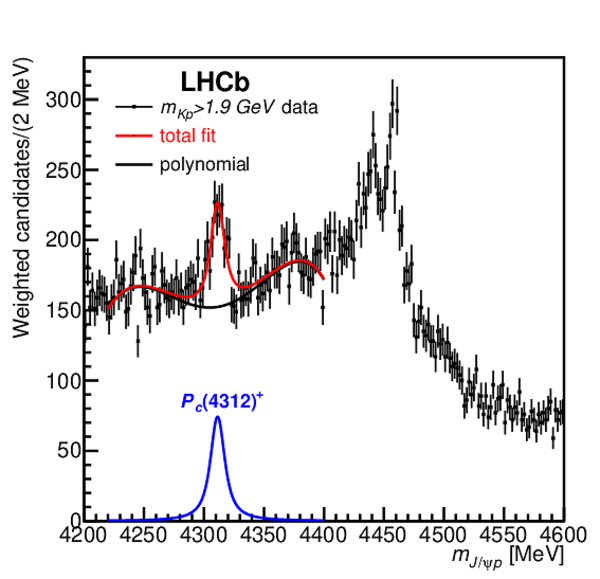
Fit to the $\cos\theta_{Pc}$-weighted $m_{ { J \mskip -3mu/\mskip -2mu\psi \mskip 2mu} p}$ distribution with three BW amplitudes and a sixth-order polynomial background. This fit is used to determine the central values of the masses and widths of the $P_c^+$ states. The mass thresholds for the $\Sigma ^+_ c \overline{ D } {}^0 $ and $\Sigma ^+_ c \overline{ D } {}^{*0} $ final states are superimposed. |
pentaq[..].pdf [52 KiB] HiDef png [394 KiB] Thumbnail [314 KiB] *.C file |

|
|
Invariant mass spectrum of $ { J \mskip -3mu/\mskip -2mu\psi \mskip 2mu} p K ^- $ candidates. The $\Lambda ^0_ b $ signal region is between the vertical red lines. A linear interpolation of the background, determined from the sideband regions (bounded by the shorter vertical blue lines), to the signal region is shown by the dashed blue line. |
Lb_mass.pdf [22 KiB] HiDef png [143 KiB] Thumbnail [128 KiB] *.C file |

|
|
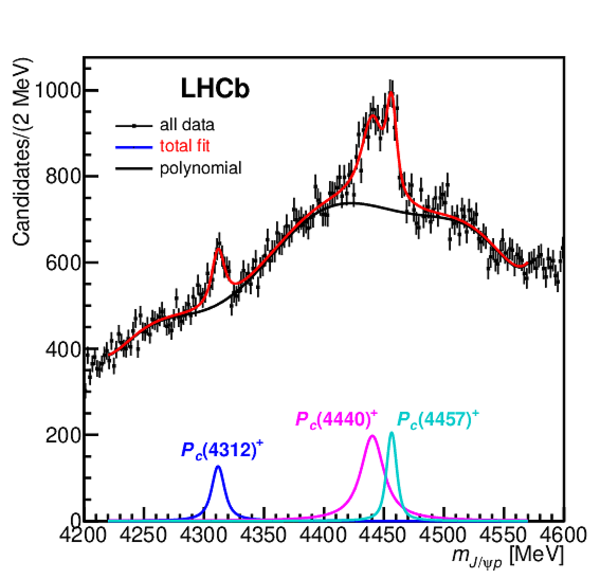
Fit to the $\cos\theta_{Pc}$-weighted $m_{ { J \mskip -3mu/\mskip -2mu\psi \mskip 2mu} p}$ distribution with four BW amplitudes and a linear background. The broad $P_c^+$ state is added coherently to the $P_c(4312)^+$ amplitude. In this fit model, the magnitude of the $P_c(4312)^+$ peak in the data is dominated by its interference with the broad $P_c^+$ state. Each $P_c^+$ contribution is displayed as the BW amplitude squared (the interference contributions are not shown individually). |
bw4p1_[..].pdf [62 KiB] HiDef png [420 KiB] Thumbnail [330 KiB] *.C file |

|
|
Triangle diagram for the $\Lambda ^0_ b \rightarrow { J \mskip -3mu/\mskip -2mu\psi \mskip 2mu} p K ^- $ decay. The figure defines the symbols used in the formulae in the text. |
triangle.png [49 KiB] HiDef png [114 KiB] Thumbnail [46 KiB] *.C file |

|
|
Fit of three triangle-diagram amplitudes and a quadratic background to the $\cos\theta_{Pc}$-weighted distribution. The widths of the excited particles exchanged in the triangles is (top) an unrealistic value of 1 $\text{ Me V}$ or (bottom) a more plausible value of 50 $\text{ Me V}$ . Individual triangle diagram contributions are also shown. The dashed vertical lines are the $\Lambda ^+_ c \overline{ D } {}^{*0} $, $\chi_{c0}p$ and $\Lambda ^+_ c (2595)\overline{ D } {}^0 $ thresholds. |
triang[..].pdf [106 KiB] HiDef png [681 KiB] Thumbnail [540 KiB] *.C file |

|
|
Fit of two BW amplitudes, one triangle-diagram amplitude, and a sixth-order polynomial background to the $\cos\theta_{Pc}$-weighted distribution. The width of the excited $D_s^*$ state exchanged in the triangle loop is set to $\Gamma(D_{s1}(2860)^-)=159$ $\text{ Me V}$ \cite{Tanabashi:2018oca,LHCb-PAPER-2014-035}. The predicted width for this $D_s^*$ state, interpreted as the $1^3D_1$ $s\bar{c}$ excitation in the quark model, is 197 $\text{ Me V}$ \cite{Godfrey:2015dva}. |
bw2t1p[..].pdf [52 KiB] HiDef png [381 KiB] Thumbnail [311 KiB] *.C file |

|
|
Animated gif made out of all figures. |
PAPER-2019-014.gif Thumbnail |

|
Tables and captions
|
Summary of $P_c^+$ properties. The central values are based on the fit displayed in Fig. ???. |
Table_1.pdf [57 KiB] HiDef png [47 KiB] Thumbnail [23 KiB] tex code |

|
Supplementary Material [file]


![HiDef png [139 KiB]](Directory_LHCb-PAPER-2019-014/hidef_mjpsip-spectrum-all.png)
![HiDef png [88 KiB]](Directory_LHCb-PAPER-2019-014/hidef_mkp-spectrum.png)
![HiDef png [2 MiB]](Directory_LHCb-PAPER-2019-014/hidef_Dalitz_plot_pc.png)
![HiDef png [203 KiB]](Directory_LHCb-PAPER-2019-014/hidef_mjpsip-spectrum-19.png)
![HiDef png [119 KiB]](Directory_LHCb-PAPER-2019-014/hidef_weight.png)
![HiDef png [675 KiB]](Directory_LHCb-PAPER-2019-014/hidef_mjpsip2x3.png)
![HiDef png [394 KiB]](Directory_LHCb-PAPER-2019-014/hidef_pentaquarks_nominal_fit_and_thresholds.png)
![HiDef png [143 KiB]](Directory_LHCb-PAPER-2019-014/hidef_Lb_mass.png)
![HiDef png [420 KiB]](Directory_LHCb-PAPER-2019-014/hidef_bw4p1_14_cosw_nom_did_0_npoly_1.png)
![triangle.png [49 KiB]](Directory_LHCb-PAPER-2019-014/triangle.png)
![HiDef png [114 KiB]](Directory_LHCb-PAPER-2019-014/hidef_triangle.png)
![HiDef png [681 KiB]](Directory_LHCb-PAPER-2019-014/hidef_triangleFits.png)
![HiDef png [381 KiB]](Directory_LHCb-PAPER-2019-014/hidef_bw2t1p6_cosw_159MeV_did_0_npoly_6.png)
![HiDef png [47 KiB]](Directory_LHCb-PAPER-2019-014/hidef_Table_1.png)
![HiDef png [467 KiB]](Directory_LHCb-PAPER-2019-014/supplementary/hidef_FigCDS1a.png)
![HiDef png [471 KiB]](Directory_LHCb-PAPER-2019-014/supplementary/hidef_FigCDS1b.png)
![HiDef png [680 KiB]](Directory_LHCb-PAPER-2019-014/supplementary/hidef_FigCDS2a.png)
![HiDef png [690 KiB]](Directory_LHCb-PAPER-2019-014/supplementary/hidef_FigCDS2b.png)
![HiDef png [248 KiB]](Directory_LHCb-PAPER-2019-014/supplementary/hidef_FigCDS3a.png)
![HiDef png [278 KiB]](Directory_LHCb-PAPER-2019-014/supplementary/hidef_FigCDS3b.png)
![HiDef png [270 KiB]](Directory_LHCb-PAPER-2019-014/supplementary/hidef_FigCDS3c.png)
![HiDef png [317 KiB]](Directory_LHCb-PAPER-2019-014/supplementary/hidef_FigCDS4a.png)
![HiDef png [365 KiB]](Directory_LHCb-PAPER-2019-014/supplementary/hidef_FigCDS4b.png)
![HiDef png [372 KiB]](Directory_LHCb-PAPER-2019-014/supplementary/hidef_FigCDS4c.png)
![HiDef png [450 KiB]](Directory_LHCb-PAPER-2019-014/supplementary/hidef_FigCDS4d.png)
![HiDef png [358 KiB]](Directory_LHCb-PAPER-2019-014/supplementary/hidef_FigCDS4e.png)
![HiDef png [429 KiB]](Directory_LHCb-PAPER-2019-014/supplementary/hidef_FigCDS4f.png)
![HiDef png [114 KiB]](Directory_LHCb-PAPER-2019-014/supplementary/hidef_FigCDS5.png)
![HiDef png [862 KiB]](Directory_LHCb-PAPER-2019-014/supplementary/hidef_supplementary-v2.png)
Created on 26 April 2024.