Measurement of $f_s / f_u$ variation with proton-proton collision energy and $B$-meson kinematics
[to restricted-access page]Information
LHCb-PAPER-2019-020
CERN-EP-2019-209
arXiv:1910.09934 [PDF]
(Submitted on 22 Oct 2019)
Phys. Rev. Lett. 124 (2020) 122002
Inspire 1760257
Tools
Abstract
The ratio of the $\mathrm{B}^0_\mathrm{s}$ and $\mathrm{B}^+$ fragmentation fractions $f_\mathrm{s}$ and $f_u$ is studied with $B^0_\mathrm{s}\to\mathrm{J}/\psi \phi $ and $B^+\to\mathrm{J}/\psi K^+$ decays using data collected by the LHCb experiment in proton-proton collisions at 7, 8 and 13$\text{ TeV}$ center-of-mass energies. The analysis is performed in bins of $\mathrm{B}$-meson momentum, longitudinal momentum, transverse momentum, pseudorapidity and rapidity. The fragmentation-fraction ratio $f_\mathrm{s} / f_u$ is observed to depend on the $\mathrm{B}$-meson transverse momentum with a significance of $6.0 \sigma$. This dependency is driven by the 13$\text{ TeV}$ sample ($8.7 \sigma$) while the results for the other collision energies are not significant when considered separately. Furthermore the results show a $4.8 \sigma$ evidence for an increase of $f_\mathrm{s} / f_u$ as a function of collision energy.
Figures and captions
|
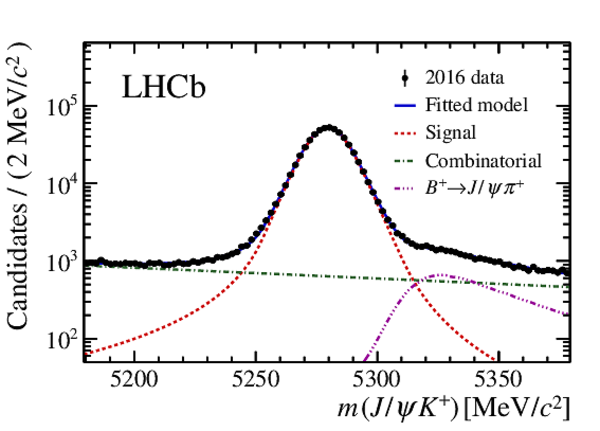
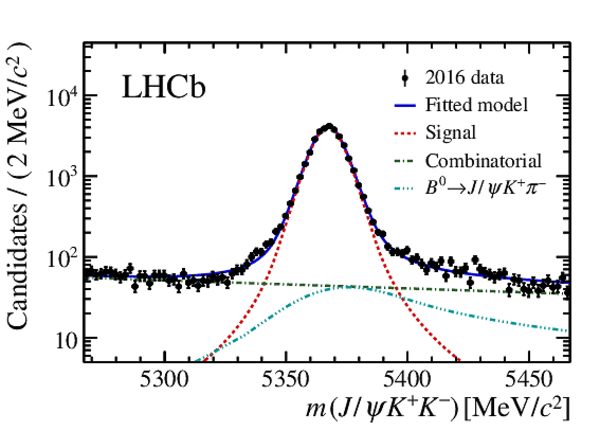
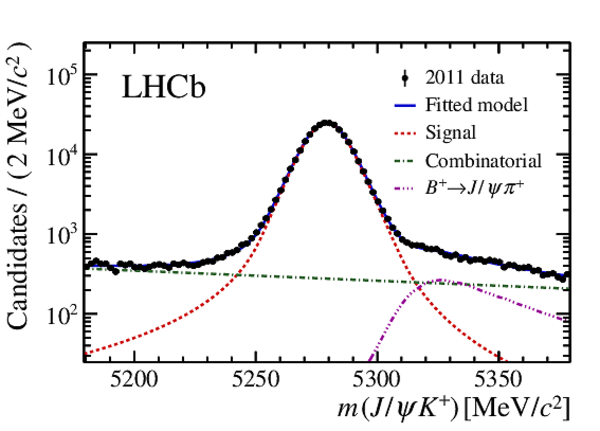
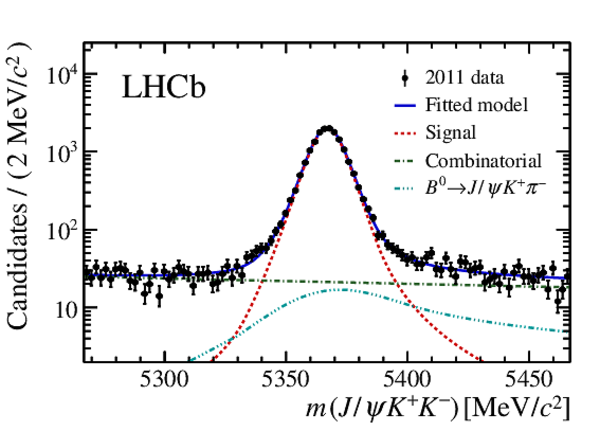
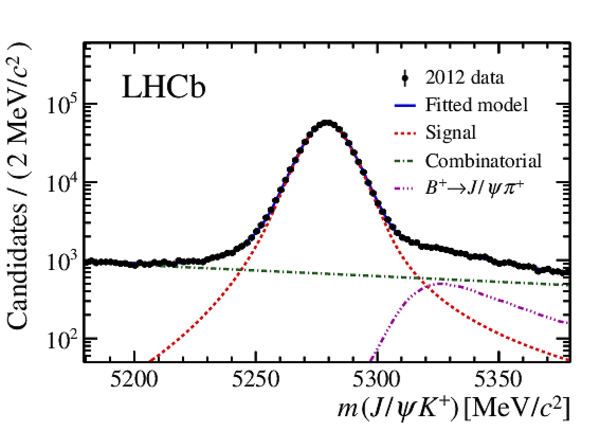
Mass distributions of (a) $ B^+\rightarrow { J \mskip -3mu/\mskip -2mu\psi \mskip 2mu} K^+$ and (b) $ B^0_s\rightarrow { J \mskip -3mu/\mskip -2mu\psi \mskip 2mu} \phi$ candidates in the 2012 data. The result of the fit is drawn with a blue solid line. The model components are denoted with red dashed line for the signal, green dot-dashed line for the combinatorial background, magenta triple-dot-dashed line for misidentified $ B ^+ \rightarrow { J \mskip -3mu/\mskip -2mu\psi \mskip 2mu} \pi^+$ and cyan triple-dot-dashed line for misidentified the inclusive $ B^0 \rightarrow { J \mskip -3mu/\mskip -2mu\psi \mskip 2mu} K^+ \pi^-$ contribution. |
Fig1_a.pdf [36 KiB] HiDef png [237 KiB] Thumbnail [200 KiB] |

|
|
Fig1_b.pdf [36 KiB] HiDef png [271 KiB] Thumbnail [219 KiB] |

|
|
|
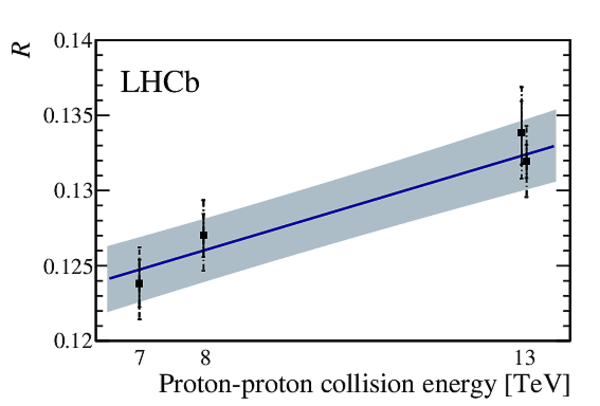
Efficiency-corrected $ B ^0_ s \rightarrow { J \mskip -3mu/\mskip -2mu\psi \mskip 2mu} \phi $ and $ B ^+ \rightarrow { J \mskip -3mu/\mskip -2mu\psi \mskip 2mu} K ^+ $ yield ratios ( $\mathcal{R}$ ) at different $ pp $ collision energies with the total (uncorrelated, including statistical) uncertainties denoted by dashed (solid) error bars. The fit result is shown with the blue solid line, the blue band denotes the $ 68\%$ confidence region. The 13 $\text{ Te V}$ measurements are shifted horizontally for clarity. |
Fig2.pdf [27 KiB] HiDef png [180 KiB] Thumbnail [134 KiB] |

|
|
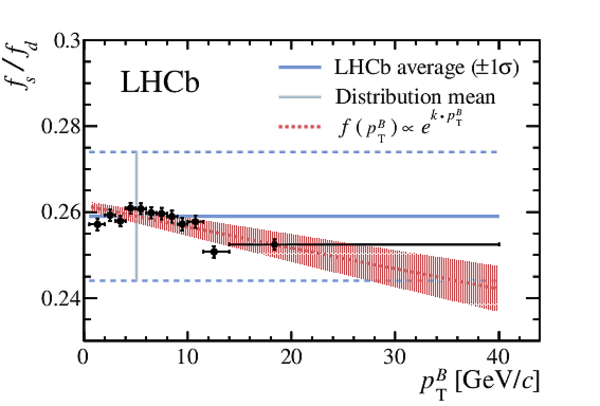
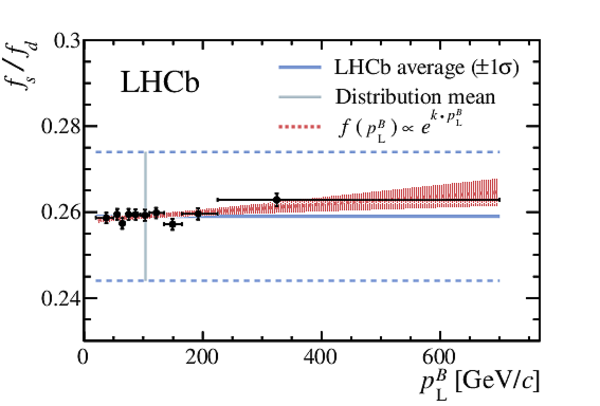
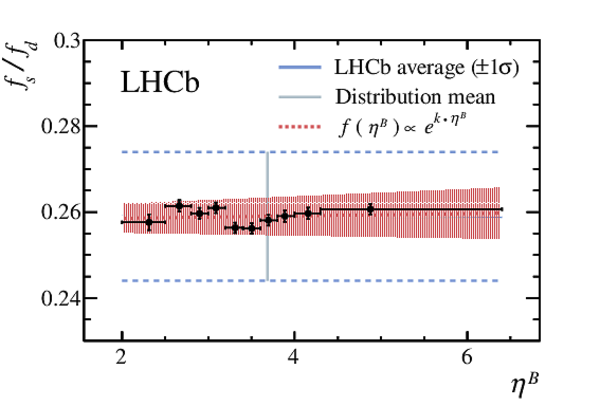
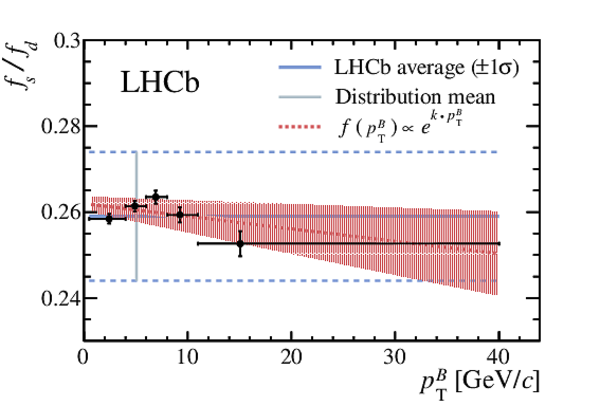
Efficiency-corrected $ B ^0_ s \rightarrow { J \mskip -3mu/\mskip -2mu\psi \mskip 2mu} \phi$ and $ B ^+ \rightarrow { J \mskip -3mu/\mskip -2mu\psi \mskip 2mu} K ^+ $ yield ratios ( $\mathcal{R}$ ) in bins of (a) $ { p_{\mathrm{T}} ^{ B }}$ , (c) $ {p_{\mathrm{L}}^{ B }}$ and (d) $ {\eta^{ B }}$ . The ratios are scaled to match the measured $ f_s/f_d$ value (horizontal blue lines, the $\pm1\sigma$ interval is indicated by the dashed blue lines) at the positions indicated by the vertical gray lines. The red dashed lines denote the results of the exponential fits used to estimate the statistical significances of the variations (see text). In (b) the results as a function of $ { p_{\mathrm{T}} ^{ B }}$ are obtained separately in the three collision energies. |
Fig3_a.pdf [21 KiB] HiDef png [316 KiB] Thumbnail [171 KiB] |
|
|
Fig3_d.pdf [17 KiB] HiDef png [171 KiB] Thumbnail [139 KiB] |

|
|
|
Fig3_b.pdf [20 KiB] HiDef png [227 KiB] Thumbnail [153 KiB] |
|
|
|
Fig3_c.pdf [20 KiB] HiDef png [351 KiB] Thumbnail [160 KiB] |

|
|
|
The $ B $ -meson mass distributions of (left column) $ B^+\rightarrow { J \mskip -3mu/\mskip -2mu\psi \mskip 2mu} K^+$ and (right column) $ B^0_s\rightarrow { J \mskip -3mu/\mskip -2mu\psi \mskip 2mu} \phi$ candidates in LHCb data collected in 2011, 2012, 2015, and 2016, shown from top to bottom in that order. The result of the fit is drawn with a blue solid line. The model components are denoted with the dashed lines: signal in red, combinatorial background in green, misidentified $ B ^+ \rightarrow { J \mskip -3mu/\mskip -2mu\psi \mskip 2mu} \pi^+$ in magenta and the misidentified inclusive $ B^0 \rightarrow { J \mskip -3mu/\mskip -2mu\psi \mskip 2mu} K^+ \pi^-$ contribution in light blue. |
Fig4_a_Sup.pdf [36 KiB] HiDef png [243 KiB] Thumbnail [201 KiB] |

|
|
Fig4_b_Sup.pdf [35 KiB] HiDef png [281 KiB] Thumbnail [228 KiB] |

|
|
|
Fig4_c_Sup.pdf [36 KiB] HiDef png [237 KiB] Thumbnail [200 KiB] |

|
|
|
Fig4_d_Sup.pdf [36 KiB] HiDef png [271 KiB] Thumbnail [219 KiB] |

|
|
|
Fig4_e_Sup.pdf [35 KiB] HiDef png [254 KiB] Thumbnail [204 KiB] |

|
|
|
Fig4_f_Sup.pdf [35 KiB] HiDef png [286 KiB] Thumbnail [240 KiB] |

|
|
|
Fig4_g_Sup.pdf [36 KiB] HiDef png [240 KiB] Thumbnail [201 KiB] |
|
|
|
Fig4_h_Sup.pdf [36 KiB] HiDef png [271 KiB] Thumbnail [219 KiB] |
|
|
|
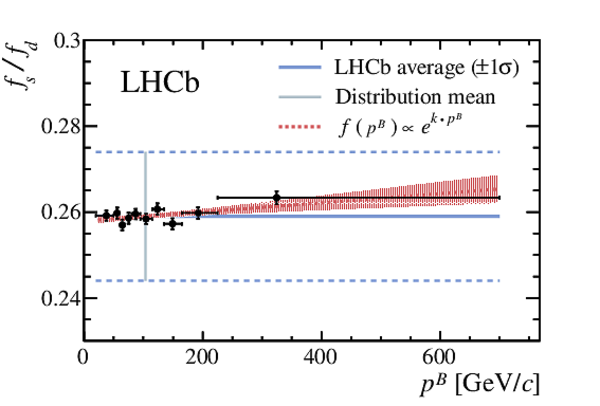
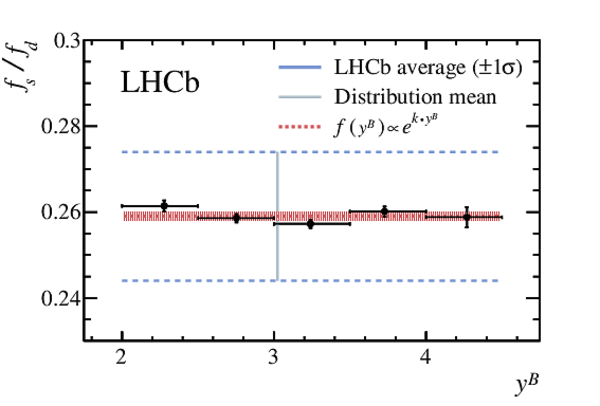
Efficiency-corrected $ B ^0_ s \rightarrow { J \mskip -3mu/\mskip -2mu\psi \mskip 2mu} \phi$ and $ B ^+ \rightarrow { J \mskip -3mu/\mskip -2mu\psi \mskip 2mu} K ^+ $ yield ratios ( $\mathcal{R}$ ) in bins of $ B $ -meson momentum $ { p ^{ B }}$ (left) and rapidity $ {y^{ B }}$ (right). The ratios are scaled to match the measured $ f_s/f_d$ value (horizontal blue lines, the $\pm1\sigma$ interval is indicated by the dashed blue lines) at the positions indicated by the vertical gray lines. The red dashed line denotes the result of the exponential fit used to estimate the statistical significance of the variation (see text), and the red band denotes the $ 68\%$ confidence region. |
Fig5_a_Sup.pdf [20 KiB] HiDef png [228 KiB] Thumbnail [153 KiB] |
|
|
Fig5_b_Sup.pdf [17 KiB] HiDef png [171 KiB] Thumbnail [124 KiB] |
|
|
|
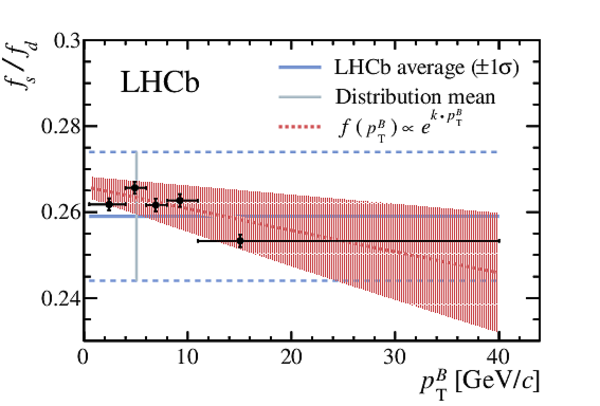
Efficiency-corrected $ B ^0_ s \rightarrow { J \mskip -3mu/\mskip -2mu\psi \mskip 2mu} \phi$ and $ B ^+ \rightarrow { J \mskip -3mu/\mskip -2mu\psi \mskip 2mu} K ^+ $ yield ratios ( $\mathcal{R}$ ) in bins of $ B $ -meson transverse momentum $ { p_{\mathrm{T}} ^{ B }}$ , shown for the $ B $ -meson longitudinal-momentum ranges: (top) low range ([0,75) $\text{ Ge V /}c$ ), (middle) medium range ([75,125) $\text{ Ge V /}c$ ), and (bottom) high range ([125,700] $\text{ Ge V /}c$ ). The ratios are scaled to match the measured $ f_s/f_d$ value (horizontal blue lines, the $\pm1\sigma$ interval is indicated by the dashed blue lines) at the positions indicated by the vertical gray lines. The red dashed line denotes the result of the exponential fit used to estimate the variation (see text), and the red band denotes the $ 68\%$ confidence region. |
Fig6_a_Sup.pdf [19 KiB] HiDef png [459 KiB] Thumbnail [194 KiB] |

|
|
Fig6_b_Sup.pdf [20 KiB] HiDef png [590 KiB] Thumbnail [213 KiB] |

|
|
|
Fig6_c_Sup.pdf [19 KiB] HiDef png [644 KiB] Thumbnail [202 KiB] |

|
|
|
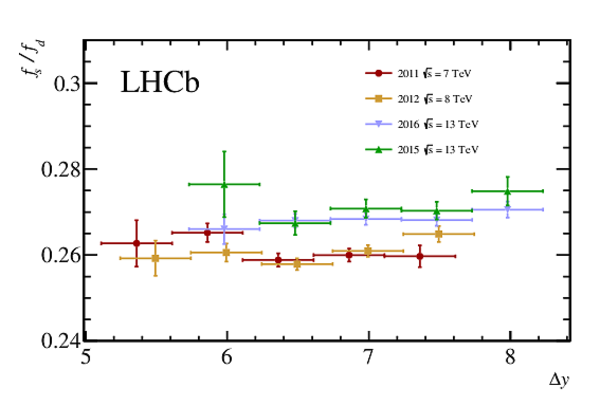
Efficiency-corrected $ B ^0_ s \rightarrow { J \mskip -3mu/\mskip -2mu\psi \mskip 2mu} \phi$ and $ B ^+ \rightarrow { J \mskip -3mu/\mskip -2mu\psi \mskip 2mu} K ^+ $ yield ratios ( $\mathcal{R}$ ) in bins of $ {\Delta y} $ for different samples. The ratios are scaled to match the measured $ f_s/f_d$ value. |
Fig7_Sup.pdf [15 KiB] HiDef png [119 KiB] Thumbnail [96 KiB] |
|
|
Animated gif made out of all figures. |
PAPER-2019-020.gif Thumbnail |

|
Tables and captions
|
Efficiency-corrected $ B ^0_ s \rightarrow { J \mskip -3mu/\mskip -2mu\psi \mskip 2mu} \phi$ and $ B ^+ \rightarrow { J \mskip -3mu/\mskip -2mu\psi \mskip 2mu} K ^+ $ yield ratios ( $\mathcal{R}$ ) and uncertainties ($\sigma_{\rm{tot}}$), including the statistical uncertainty ($\sigma_{\rm{stat}}$) and the fully correlated and uncorrelated systematic uncertainties among the samples ($\sigma^{\rm{uncor}}_{\rm{syst}}$, $\sigma^{\rm{cor}}_{\rm{syst}}$). Individual contributions from tracking efficiency ($\sigma^{\rm{track}}_{\rm{syst}}$), acceptance, reconstruction and selection efficiency ($\sigma^{\rm{sel}}_{\rm{syst}}$) and fit model ($\sigma^{\rm{fit}}_{\rm{syst}}$) are shown separately. Correlations stem from the common tracking and fit model uncertainties. |
Table_1.pdf [52 KiB] HiDef png [51 KiB] Thumbnail [23 KiB] tex code |

|
|
The efficiency-corrected yield ratio ($\mathcal{R}$) in bins of $ B $ -meson transverse momentum in (a) low, (b) medium, and (c) high $ B $ -meson longitudinal-momentum regions. Uncertainties include both statistical and systematic sources. |
Table_2.pdf [58 KiB] HiDef png [83 KiB] Thumbnail [40 KiB] tex code |

|
|
The measured efficiency-corrected yield ratio ($\mathcal{R}$) in bins of the kinematic variables. Uncertainties include both statistical and systematic sources. |
Table_3.pdf [58 KiB] HiDef png [65 KiB] Thumbnail [27 KiB] tex code |

|
|
Efficiency-corrected $ B ^0_ s \rightarrow { J \mskip -3mu/\mskip -2mu\psi \mskip 2mu} \phi$ and $ B ^+ \rightarrow { J \mskip -3mu/\mskip -2mu\psi \mskip 2mu} K ^+ $ yield ratios in bins of $ B $ -meson transverse momentum $ { p_{\mathrm{T}} ^{ B }}$ , separately for the three $ pp$ collision energies. |
Table_4.pdf [57 KiB] HiDef png [82 KiB] Thumbnail [35 KiB] tex code |

|
Supplementary Material [file]


![HiDef png [237 KiB]](Directory_LHCb-PAPER-2019-020/hidef_Fig1_a.png)
![HiDef png [271 KiB]](Directory_LHCb-PAPER-2019-020/hidef_Fig1_b.png)
![HiDef png [180 KiB]](Directory_LHCb-PAPER-2019-020/hidef_Fig2.png)
![HiDef png [316 KiB]](Directory_LHCb-PAPER-2019-020/hidef_Fig3_a.png)
![HiDef png [171 KiB]](Directory_LHCb-PAPER-2019-020/hidef_Fig3_d.png)
![HiDef png [227 KiB]](Directory_LHCb-PAPER-2019-020/hidef_Fig3_b.png)
![HiDef png [351 KiB]](Directory_LHCb-PAPER-2019-020/hidef_Fig3_c.png)
![HiDef png [243 KiB]](Directory_LHCb-PAPER-2019-020/hidef_Fig4_a_Sup.png)
![HiDef png [281 KiB]](Directory_LHCb-PAPER-2019-020/hidef_Fig4_b_Sup.png)
![HiDef png [237 KiB]](Directory_LHCb-PAPER-2019-020/hidef_Fig4_c_Sup.png)
![HiDef png [271 KiB]](Directory_LHCb-PAPER-2019-020/hidef_Fig4_d_Sup.png)
![HiDef png [254 KiB]](Directory_LHCb-PAPER-2019-020/hidef_Fig4_e_Sup.png)
![HiDef png [286 KiB]](Directory_LHCb-PAPER-2019-020/hidef_Fig4_f_Sup.png)
![HiDef png [240 KiB]](Directory_LHCb-PAPER-2019-020/hidef_Fig4_g_Sup.png)
![HiDef png [271 KiB]](Directory_LHCb-PAPER-2019-020/hidef_Fig4_h_Sup.png)
![HiDef png [228 KiB]](Directory_LHCb-PAPER-2019-020/hidef_Fig5_a_Sup.png)
![HiDef png [171 KiB]](Directory_LHCb-PAPER-2019-020/hidef_Fig5_b_Sup.png)
![HiDef png [459 KiB]](Directory_LHCb-PAPER-2019-020/hidef_Fig6_a_Sup.png)
![HiDef png [590 KiB]](Directory_LHCb-PAPER-2019-020/hidef_Fig6_b_Sup.png)
![HiDef png [644 KiB]](Directory_LHCb-PAPER-2019-020/hidef_Fig6_c_Sup.png)
![HiDef png [119 KiB]](Directory_LHCb-PAPER-2019-020/hidef_Fig7_Sup.png)
![HiDef png [51 KiB]](Directory_LHCb-PAPER-2019-020/hidef_Table_1.png)
![HiDef png [83 KiB]](Directory_LHCb-PAPER-2019-020/hidef_Table_2.png)
![HiDef png [65 KiB]](Directory_LHCb-PAPER-2019-020/hidef_Table_3.png)
![HiDef png [82 KiB]](Directory_LHCb-PAPER-2019-020/hidef_Table_4.png)
![HiDef png [237 KiB]](Directory_LHCb-PAPER-2019-020/supplementary/hidef_Fig1_a.png)
![HiDef png [271 KiB]](Directory_LHCb-PAPER-2019-020/supplementary/hidef_Fig1_b.png)
![HiDef png [180 KiB]](Directory_LHCb-PAPER-2019-020/supplementary/hidef_Fig2.png)
![HiDef png [316 KiB]](Directory_LHCb-PAPER-2019-020/supplementary/hidef_Fig3_a.png)
![HiDef png [227 KiB]](Directory_LHCb-PAPER-2019-020/supplementary/hidef_Fig3_b.png)
![HiDef png [351 KiB]](Directory_LHCb-PAPER-2019-020/supplementary/hidef_Fig3_c.png)
![HiDef png [171 KiB]](Directory_LHCb-PAPER-2019-020/supplementary/hidef_Fig3_d.png)
![HiDef png [243 KiB]](Directory_LHCb-PAPER-2019-020/supplementary/hidef_Fig4_a_Sup.png)
![HiDef png [281 KiB]](Directory_LHCb-PAPER-2019-020/supplementary/hidef_Fig4_b_Sup.png)
![HiDef png [237 KiB]](Directory_LHCb-PAPER-2019-020/supplementary/hidef_Fig4_c_Sup.png)
![HiDef png [271 KiB]](Directory_LHCb-PAPER-2019-020/supplementary/hidef_Fig4_d_Sup.png)
![HiDef png [254 KiB]](Directory_LHCb-PAPER-2019-020/supplementary/hidef_Fig4_e_Sup.png)
![HiDef png [286 KiB]](Directory_LHCb-PAPER-2019-020/supplementary/hidef_Fig4_f_Sup.png)
![HiDef png [240 KiB]](Directory_LHCb-PAPER-2019-020/supplementary/hidef_Fig4_g_Sup.png)
![HiDef png [271 KiB]](Directory_LHCb-PAPER-2019-020/supplementary/hidef_Fig4_h_Sup.png)
![HiDef png [228 KiB]](Directory_LHCb-PAPER-2019-020/supplementary/hidef_Fig5_a_Sup.png)
![HiDef png [171 KiB]](Directory_LHCb-PAPER-2019-020/supplementary/hidef_Fig5_b_Sup.png)
![HiDef png [459 KiB]](Directory_LHCb-PAPER-2019-020/supplementary/hidef_Fig6_a_Sup.png)
![HiDef png [590 KiB]](Directory_LHCb-PAPER-2019-020/supplementary/hidef_Fig6_b_Sup.png)
![HiDef png [644 KiB]](Directory_LHCb-PAPER-2019-020/supplementary/hidef_Fig6_c_Sup.png)
![HiDef png [119 KiB]](Directory_LHCb-PAPER-2019-020/supplementary/hidef_Fig7_Sup.png)
Created on 26 April 2024.