Isospin amplitudes in $\Lambda_b^0\to J/\psi \Lambda(\Sigma^0)$ and $\Xi_b^0\to J/\psi \Xi^0(\Lambda)$ decays
[to restricted-access page]Information
LHCb-PAPER-2019-039
CERN-EP-2019-268
arXiv:1912.02110 [PDF]
(Submitted on 04 Dec 2019)
Phys. Rev. Lett. 124 (2020) 111802
Inspire 1768478
Tools
Abstract
Ratios of isospin amplitudes in hadron decays are a useful probe of the interplay between weak and strong interactions, and allow searches for physics beyond the Standard Model. We present the first results on isospin amplitudes in $b$-baryon decays, using data corresponding to an integrated luminosity of 8.5 fb$^{-1}$, collected with the LHCb detector in $pp$ collisions at center of mass energies of 7, 8 and 13 TeV. The isospin amplitude ratio $|A_1(\Lambda_b^0\to J/\psi \Sigma^0)/A_0(\Lambda_b^0\to J/\psi\Lambda)|$, where the subscript on $A$ indicates the final-state isospin, is measured to be less than 1/21.8 at 95% confidence level. The Cabibbo suppressed $\Xi_b^0\to J/\psi\Lambda$ decay is observed for the first time, allowing for the measurement $|A_0(\Xi_b^0\to J/\psi\Lambda)/A_{1/2}(\Xi_b^0\to J/\psi\Xi^0)| =0.37 \pm 0.06\pm 0.02$, where the uncertainties are statistical and systematic, respectively.
Figures and captions
|
Leading order Feynman diagrams for $\Lambda ^0_ b \rightarrow { J \mskip -3mu/\mskip -2mu\psi } \Lambda(\Sigma^0)$ and $\Xi_b^0\rightarrow { J \mskip -3mu/\mskip -2mu\psi } \Xi^0(\Lambda)$ decays. |
feynJLam.pdf [85 KiB] HiDef png [133 KiB] Thumbnail [190 KiB] *.C file |

|
|
feynJXi.pdf [103 KiB] HiDef png [132 KiB] Thumbnail [178 KiB] *.C file |

|
|
|
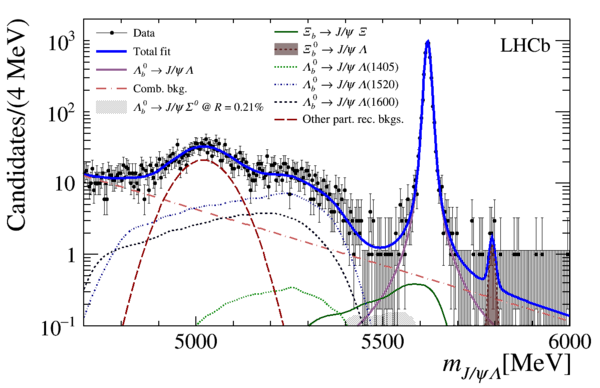
Distribution of the $ { J \mskip -3mu/\mskip -2mu\psi } \Lambda$ mass for Run 2 data. Error bars without data points indicate empty bins. Also shown is the projection of the joint fit to the data. The thick (blue) solid curve shows the total fit. For illustrative purposes, the $\Lambda ^0_ b \rightarrow { J \mskip -3mu/\mskip -2mu\psi } \Sigma^0$ signal component is artificially scaled to its measured upper limit. The shapes are identified in the legend. |
LOG_RU[..].pdf [91 KiB] HiDef png [613 KiB] Thumbnail [273 KiB] *.C file |

|
|
Result of the hypothesis tests conducted using the CLs method by varying ${\cal{R}}$ is shown. The observed CLs distribution is shown by the round (black) points. The expected CLs distribution (based on the background only hypothesis) is shown by the dashed line (black), with 1 and 2$\sigma$ uncertainty bands depicted in dark shaded (green) and light shaded (yellow) bands. The observed and expected upper limits are obtained by seeing where the bands cross the p-value of 0.05 shown as the horizontal (red) line. |
CLs_new.pdf [14 KiB] HiDef png [158 KiB] Thumbnail [126 KiB] *.C file |

|
|
Distribution of $ { J \mskip -3mu/\mskip -2mu\psi } \Lambda$ mass for Run 1 data. Error bars without data points indicate empty bins. Also shown is the projection of the joint fit to the data. The thick (blue) solid curve shows the total fit. The $\Lambda ^0_ b \rightarrow { J \mskip -3mu/\mskip -2mu\psi } \Sigma^0$ signal component is artificially scaled to its measured upper limit. The rest of the shapes are identified in the legend. |
LOG_RU[..].pdf [96 KiB] HiDef png [571 KiB] Thumbnail [257 KiB] *.C file |
|
|
Distributions of $ { J \mskip -3mu/\mskip -2mu\psi } \Xi^-$ mass shown as points with error bars for (left) Run 1 and (right) Run 2 data. The total fit to data is shown as a solid (blue) curve. The $\Xi_b^-\rightarrow { J \mskip -3mu/\mskip -2mu\psi } \Xi^-$ signal is fit with the sum of two Crystal Ball functions with the same mean and width, but different tail parameters, shown as the dashed (blue) curve. The combinatorial background shape is fit with an exponential function, shown as a dashed (red) curve. |
Fit_Jp[..].pdf [25 KiB] HiDef png [251 KiB] Thumbnail [214 KiB] *.C file |

|
|
Fit_Jp[..].pdf [25 KiB] HiDef png [246 KiB] Thumbnail [211 KiB] *.C file |

|
|
|
Animated gif made out of all figures. |
PAPER-2019-039.gif Thumbnail |

|
![HiDef png [133 KiB]](Directory_LHCb-PAPER-2019-039/hidef_feynJLam.png)
![HiDef png [132 KiB]](Directory_LHCb-PAPER-2019-039/hidef_feynJXi.png)
![HiDef png [613 KiB]](Directory_LHCb-PAPER-2019-039/hidef_LOG_RUN2_COLOR.png)
![HiDef png [158 KiB]](Directory_LHCb-PAPER-2019-039/hidef_CLs_new.png)
![HiDef png [571 KiB]](Directory_LHCb-PAPER-2019-039/hidef_LOG_RUN1_COLOR.png)
![HiDef png [251 KiB]](Directory_LHCb-PAPER-2019-039/hidef_Fit_JpsiXi_Data_Run1.png)
![HiDef png [246 KiB]](Directory_LHCb-PAPER-2019-039/hidef_Fit_JpsiXi_Data_Run2.png)
Tables and captions
|
Results from the fit to the $ { J \mskip -3mu/\mskip -2mu\psi } \Lambda$ mass distribution. The fitted yields are indicated by $N$. Note $N_{\Xi_b \rightarrow { J \mskip -3mu/\mskip -2mu\psi } \Xi}$ indicates the sum of $\Xi_b^-$ and $\Xi_b^0$ decays. |
Table_1.pdf [80 KiB] HiDef png [43 KiB] Thumbnail [22 KiB] tex code |

|
![HiDef png [43 KiB]](Directory_LHCb-PAPER-2019-039/hidef_Table_1.png)
Created on 27 April 2024.