Measurement of $|V_{cb}|$ with $B_s^0 \to D_s^{(*)-} \mu^+ \nu_{\mu}$ decays
[to restricted-access page]Information
LHCb-PAPER-2019-041
CERN-EP-2019-282
arXiv:2001.03225 [PDF]
(Submitted on 09 Jan 2020)
Phys. Rev. D101 (2020) 072004
Inspire 1774910
Tools
Abstract
The element $|V_{cb}|$ of the Cabibbo-Kobayashi-Maskawa matrix is measured using semileptonic $B_s^0$ decays produced in proton-proton collision data collected with the LHCb detector at center-of-mass energies of 7 and 8 TeV, corresponding to an integrated luminosity of 3 fb$^{-1}$. Rates of $B_s^0 \to D_s^{-} \mu^+ \nu_{\mu}$ and $B_s^0 \to D_s^{*-} \mu^+ \nu_{\mu}$ decays are analyzed using hadronic form-factor parametrizations derived either by Caprini, Lellouch and Neubert (CLN) or by Boyd, Grinstein and Lebed (BGL). The measured values of $|V_{cb}|$ are ${(41.4 \pm 0.6 \pm 0.9 \pm 1.2)\times 10^{-3}}$ and ${(42.3 \pm 0.8 \pm 0.9 \pm 1.2)\times 10^{-3}}$ in the CLN and BGL parametrization, respectively. The first uncertainty is statistical, the second systematic, and the third is due to the external inputs used in the measurement. These results are in agreement with those obtained from decays of $B^+$ and $B^0$ mesons. They are the first determinations of $|V_{cb}|$ at a hadron-collider experiment and the first using $B_s^0$ meson decays.
Figures and captions
|
Graphical representation of the helicity angles in $ B \rightarrow D ^{*} \mu\nu$ decays. The definitions are provided in the text. |
Angles[..].pdf [472 KiB] HiDef png [1 MiB] Thumbnail [302 KiB] *.C file |

|
|
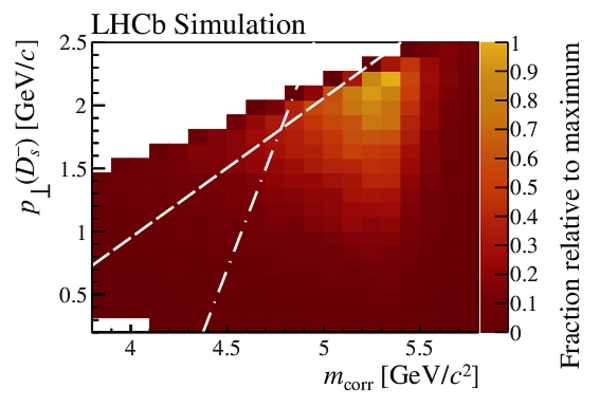
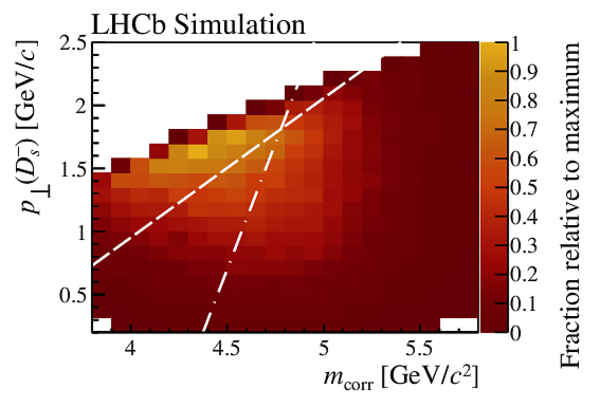
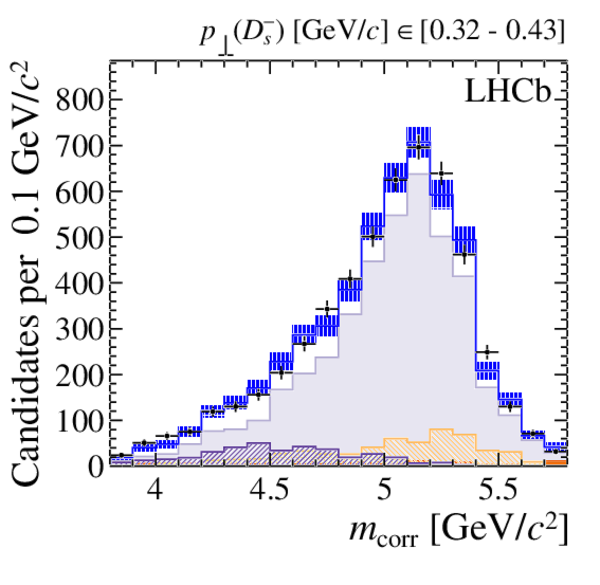
Two-dimensional distributions of $ p_{\perp} ( D ^-_ s )$ vs. $ m_{\text{corr}}$ for simulated (top-left) $ B ^0_ s \rightarrow D ^-_ s \mu ^+ \nu _\mu $ decays, (top-right) $ B ^0_ s \rightarrow D _{ s }^{*-} \mu ^+ \nu _\mu $ decays, (bottom-left) background decays from $ B ^0_ s $ feed-down and $ b $ -hadron decays to a doubly-charmed final state, and (bottom-right) background decays from $ B ^0$ cross-feed and semitauonic $ B ^0_ s $ decays. The background components are grouped according to their shapes in the $ m_{\text{corr}}$ vs. $ p_{\perp} ( D ^-_ s )$ space. The requirement $ p_{\perp} ( D ^-_ s ) [\text{ Ge V /}c ] < 1.5 + 1.1 \times ( m_{\text{corr}} [\text{ Ge V /}c^2 ] - 4.5)$ is drawn as a dashed line; the dot-dashed line shows the tighter requirement, applied on top of the baseline, which is used in Sec. ??? to further suppress background and assess the systematic uncertainty due to the residual contamination. |
mcorr_[..].pdf [22 KiB] HiDef png [239 KiB] Thumbnail [198 KiB] *.C file |
|
|
mcorr_[..].pdf [23 KiB] HiDef png [254 KiB] Thumbnail [203 KiB] *.C file |

|
|
|
mcorr_[..].pdf [22 KiB] HiDef png [242 KiB] Thumbnail [199 KiB] *.C file |
|
|
|
mcorr_[..].pdf [22 KiB] HiDef png [246 KiB] Thumbnail [201 KiB] *.C file |

|
|
|
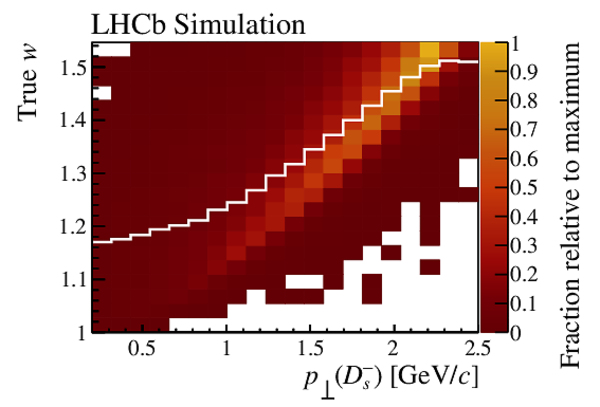
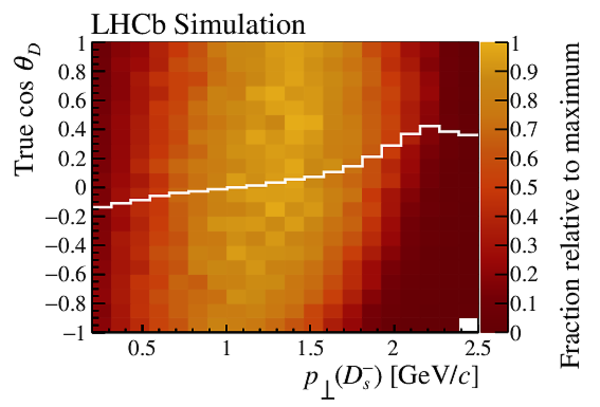
(Top) Distribution of true value of the $w$ recoil variable versus reconstructed $ p_{\perp} ( D ^-_ s )$ for (left) $ B ^0_ s \rightarrow D ^-_ s \mu ^+ \nu _\mu $ and (right) $ B ^0_ s \rightarrow D _{ s }^{*-} \mu ^+ \nu _\mu $ simulated decays. (Bottom) Distribution of the true values of (left) $\cos\theta_D$ and (right) $\cos\theta_\mu$ versus reconstructed $ p_{\perp} ( D ^-_ s )$ for $ B ^0_ s \rightarrow D _{ s }^{*-} \mu ^+ \nu _\mu $ simulated decays. Only simulated candidates that fulfill the selection requirements are shown. In each histogram the solid line represents the average of the variable displayed on the vertical axis as a function of $ p_{\perp} ( D ^-_ s )$ . The distributions of $ B ^0 \rightarrow D _{( s )}^- \mu ^+ \nu _\mu $ decays show similar features. |
Ds_w_v[..].pdf [22 KiB] HiDef png [203 KiB] Thumbnail [184 KiB] *.C file |
|
|
DsS_w_[..].pdf [23 KiB] HiDef png [229 KiB] Thumbnail [204 KiB] *.C file |

|
|
|
ctd_vs[..].pdf [24 KiB] HiDef png [254 KiB] Thumbnail [211 KiB] *.C file |
|
|
|
ctl_vs[..].pdf [23 KiB] HiDef png [233 KiB] Thumbnail [200 KiB] *.C file |

|
|
|
Distribution of (left) $ m_{\text{corr}}$ and (right) $ p_{\perp} ( D ^- )$ for the inclusive sample of reference $ D ^- \mu ^+ $ candidates, with fit projections overlaid. |
fit_mc[..].pdf [18 KiB] HiDef png [1 MiB] Thumbnail [481 KiB] *.C file |

|
|
fit_pp[..].pdf [17 KiB] HiDef png [1 MiB] Thumbnail [538 KiB] *.C file |
|
|
|
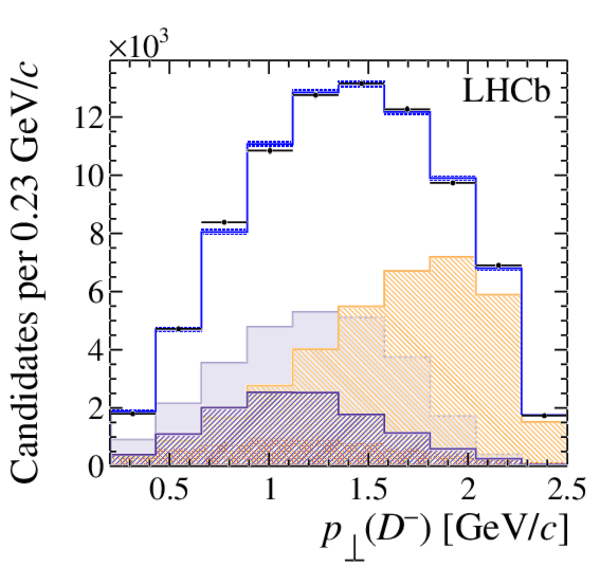
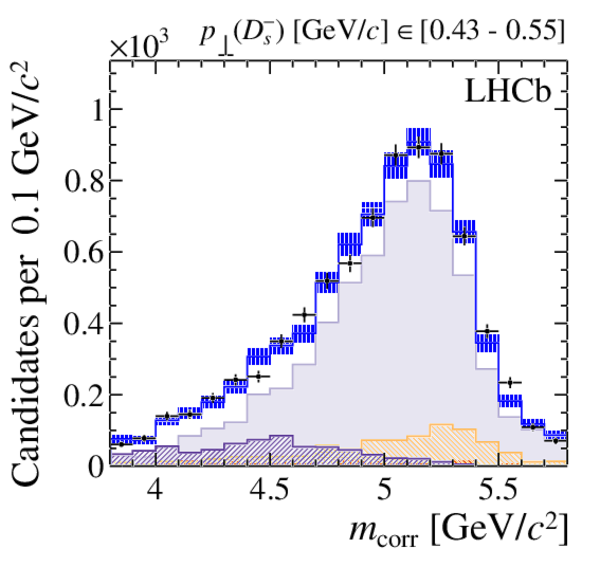
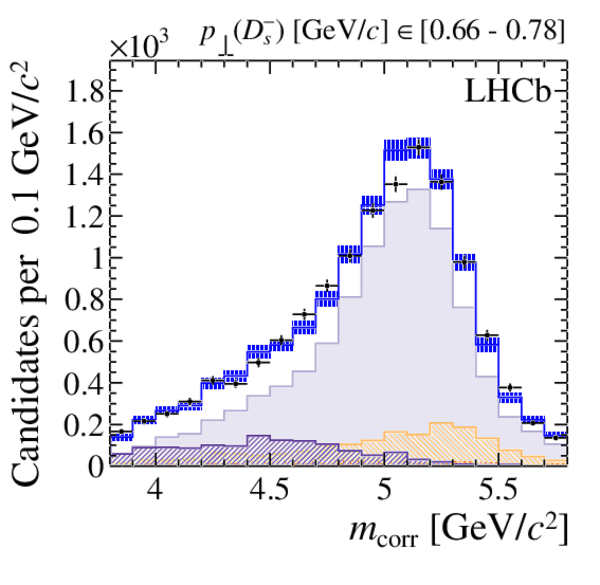
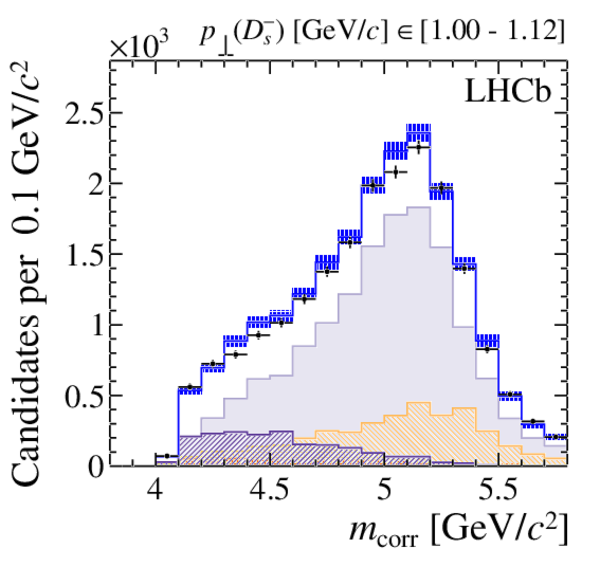
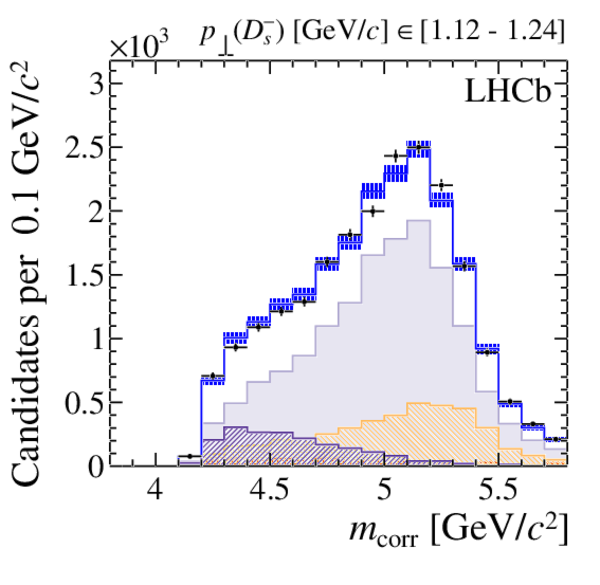
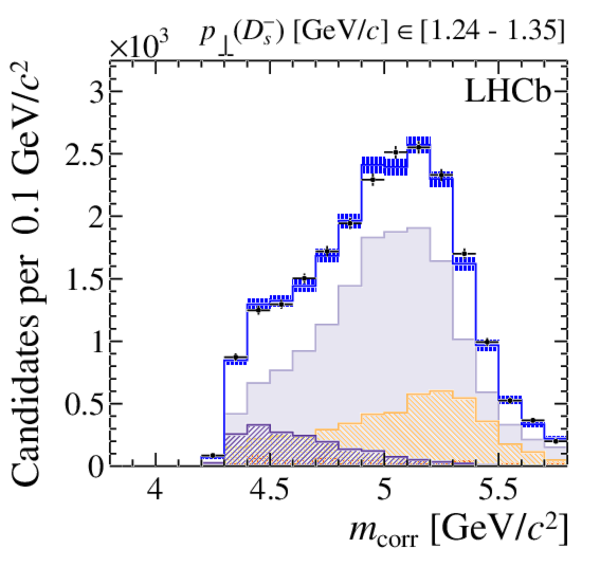
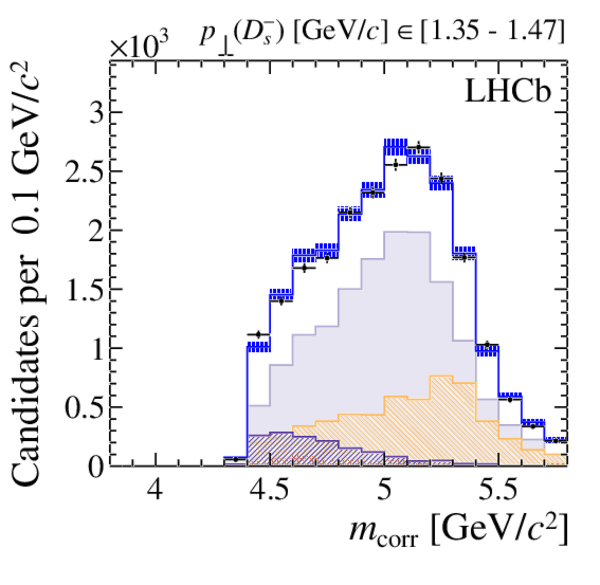
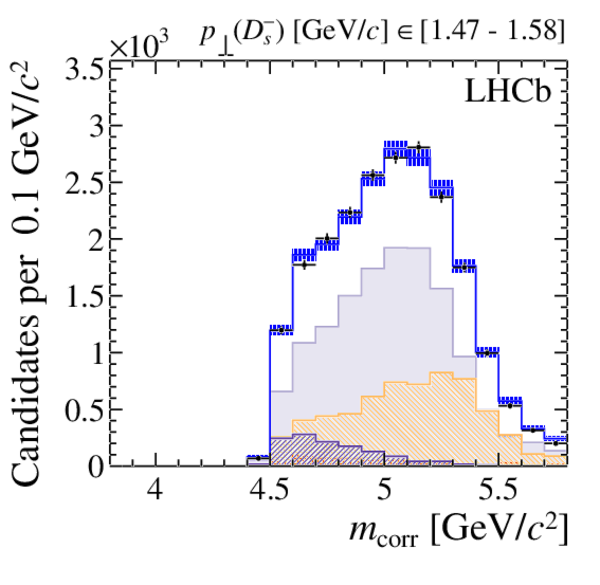
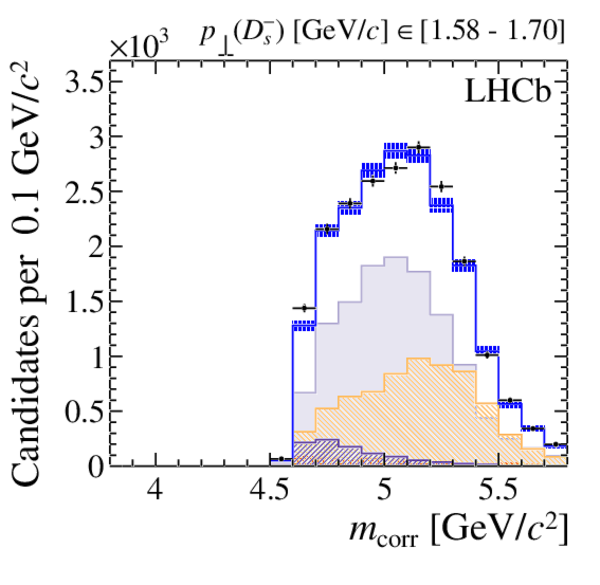
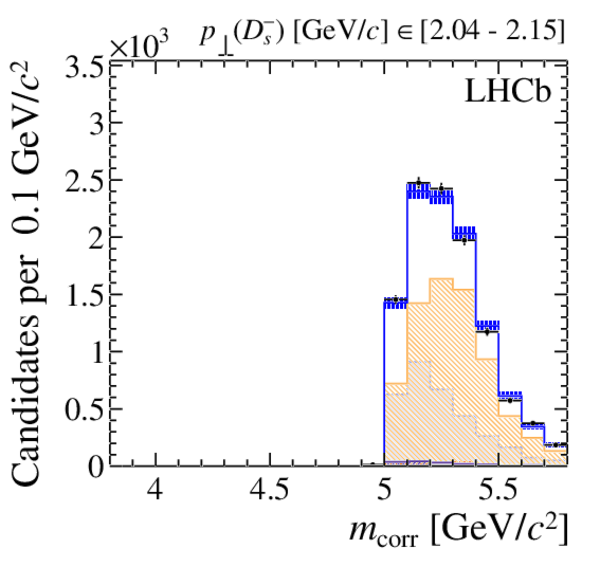
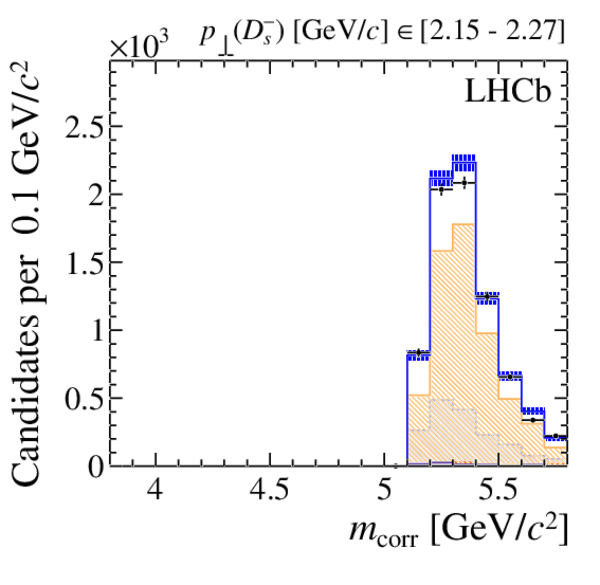
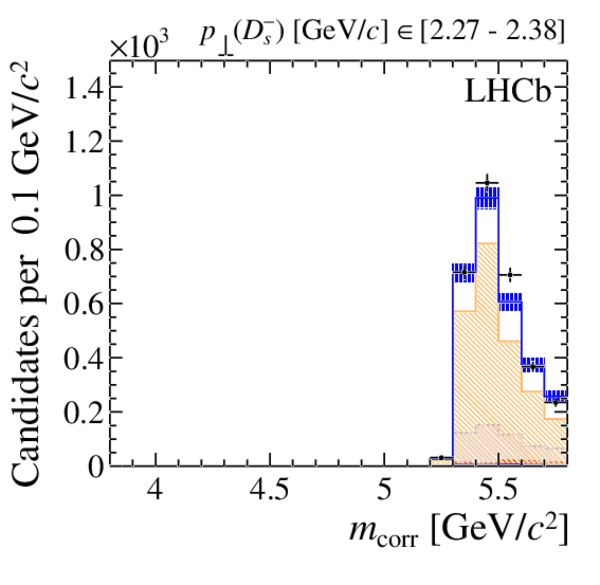
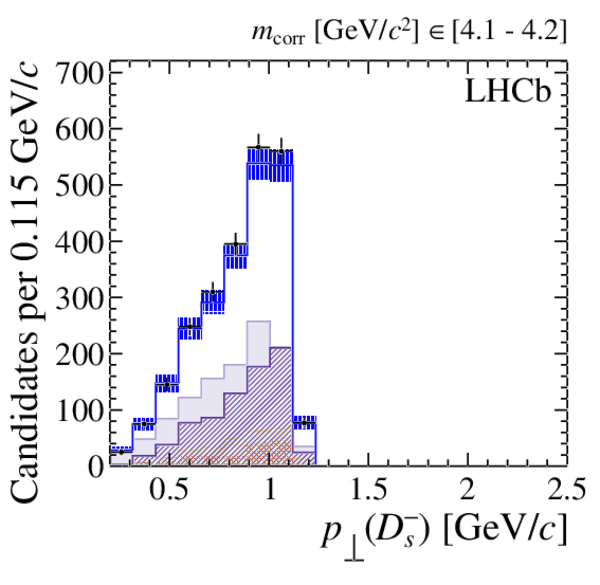
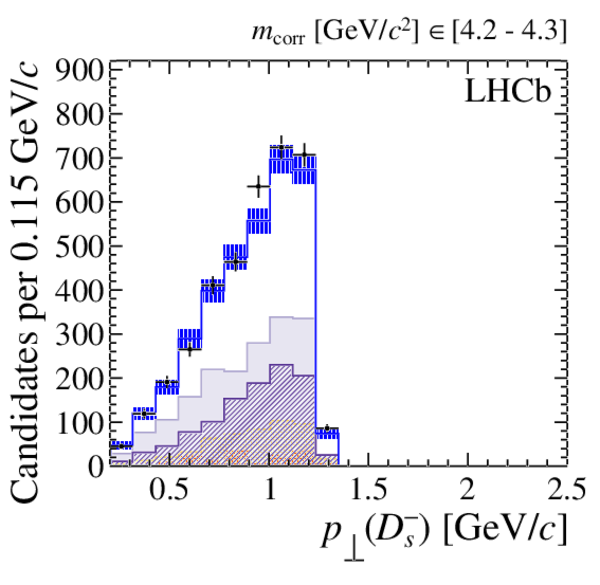
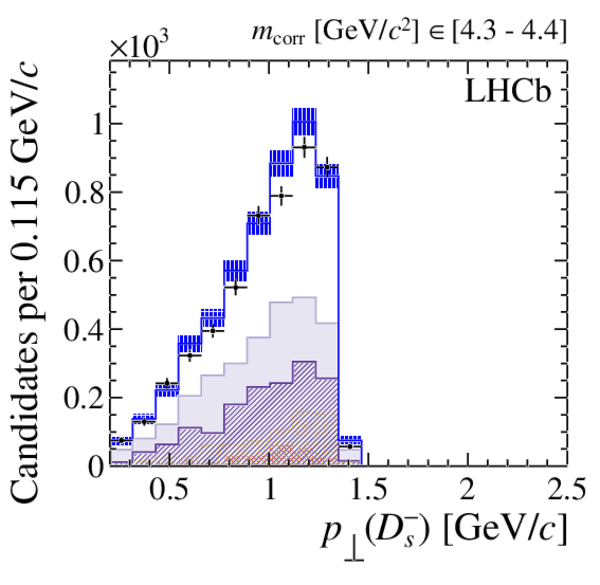
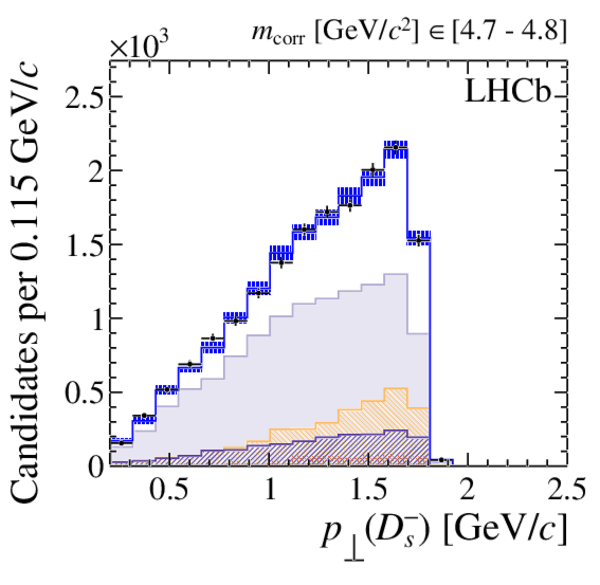
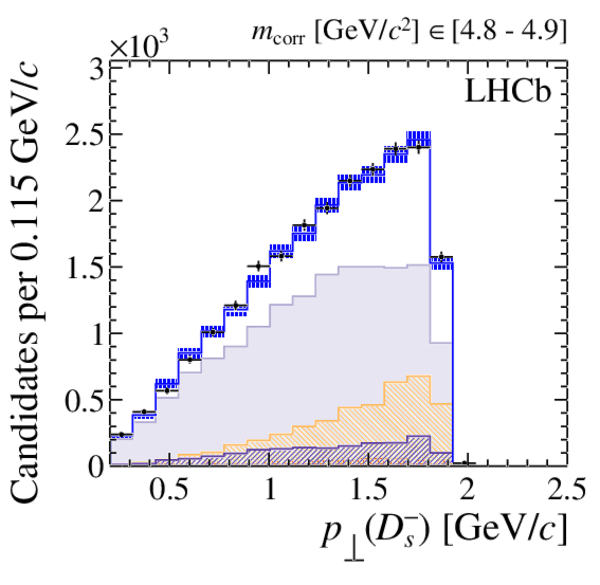
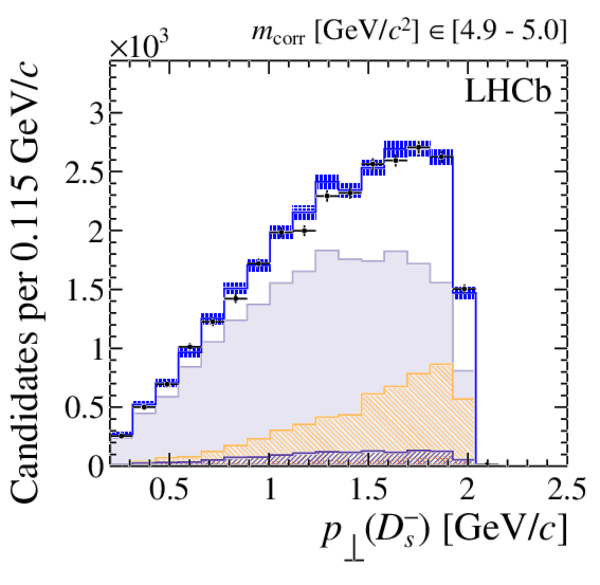
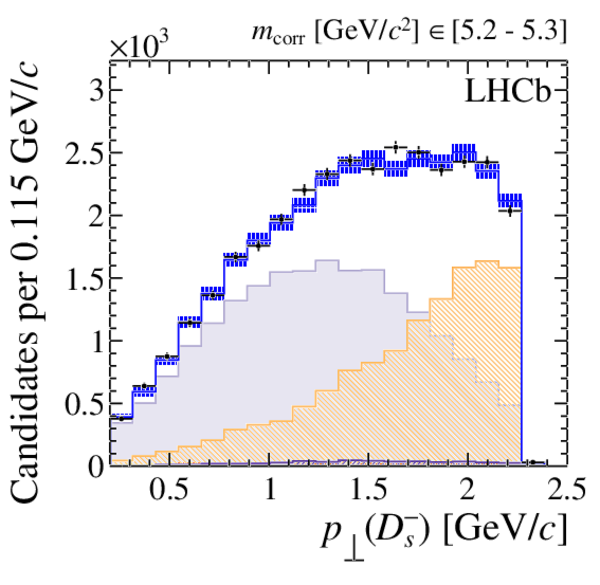
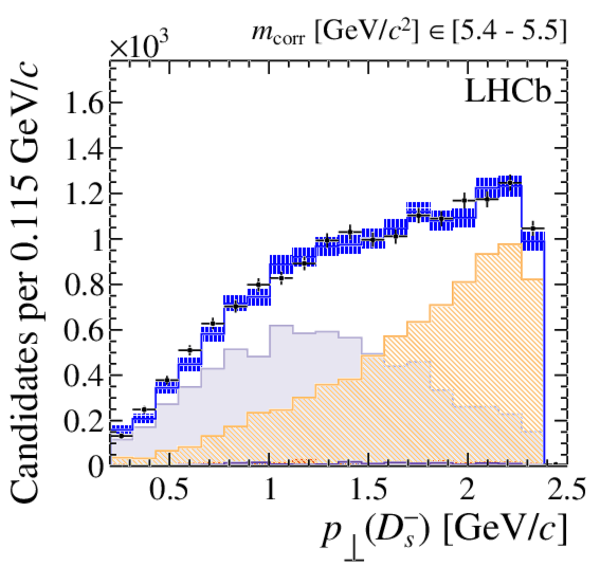
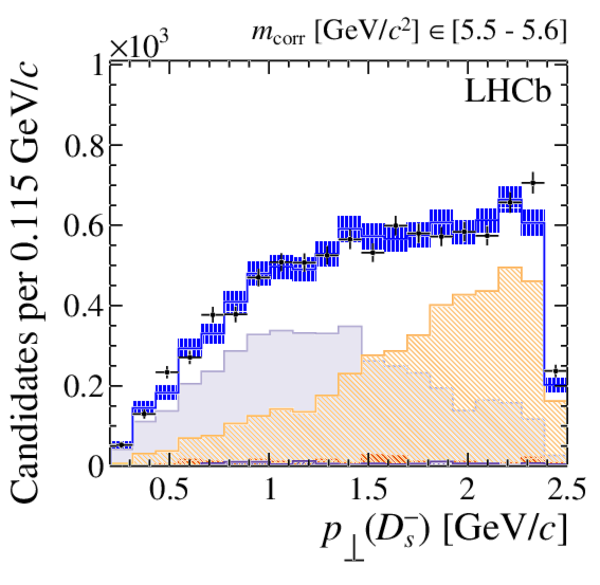
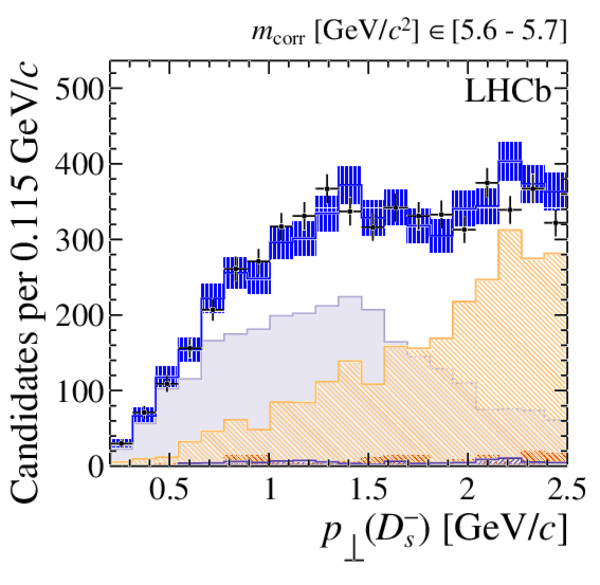
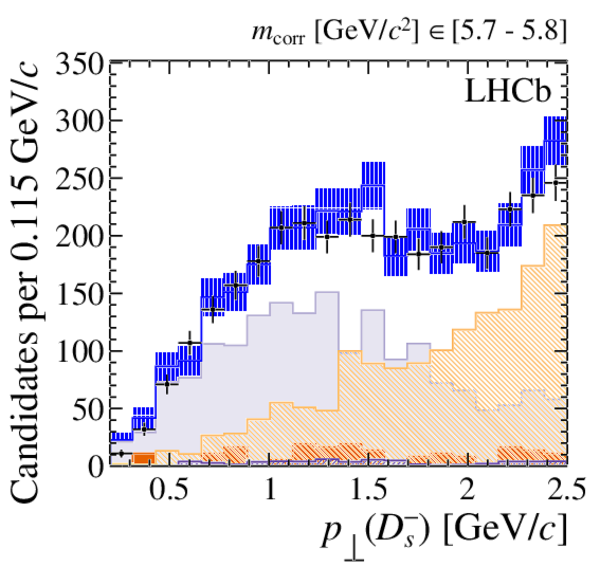
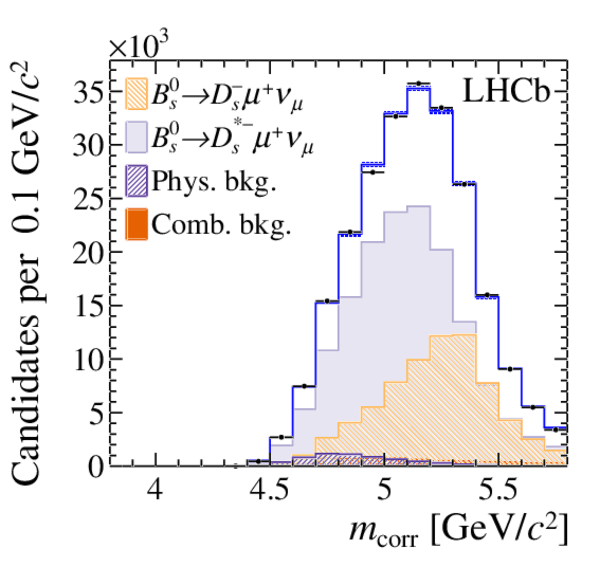
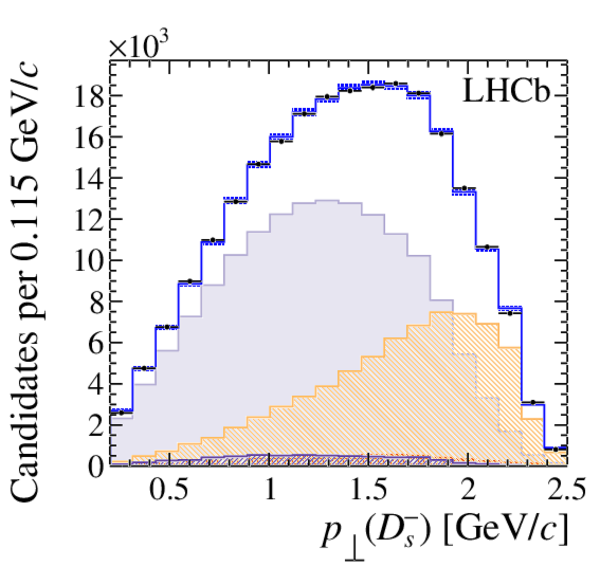
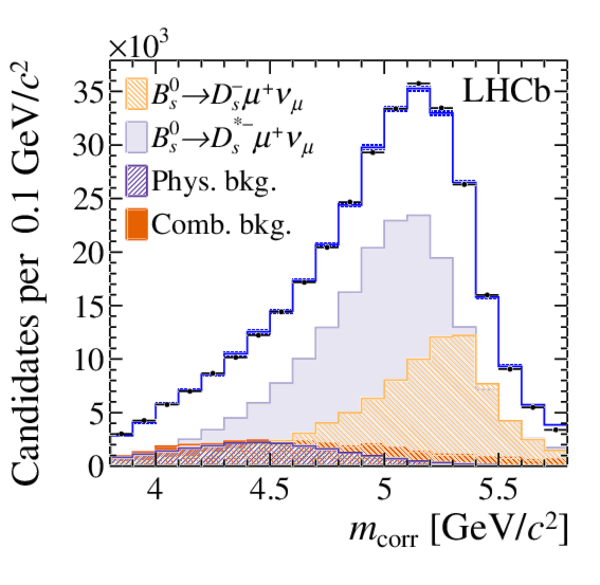
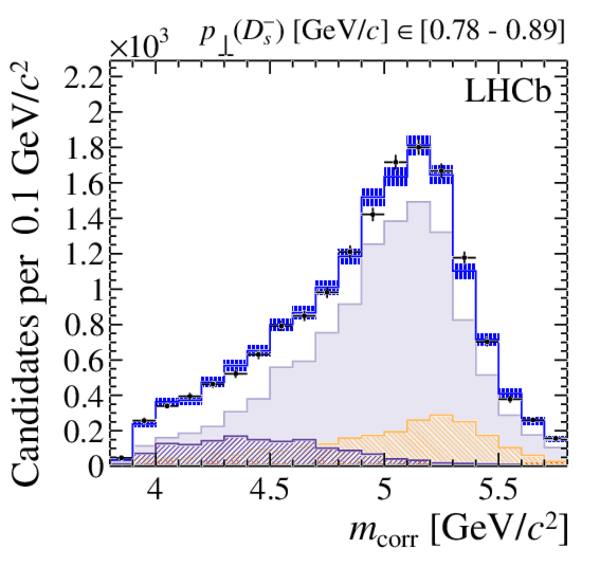
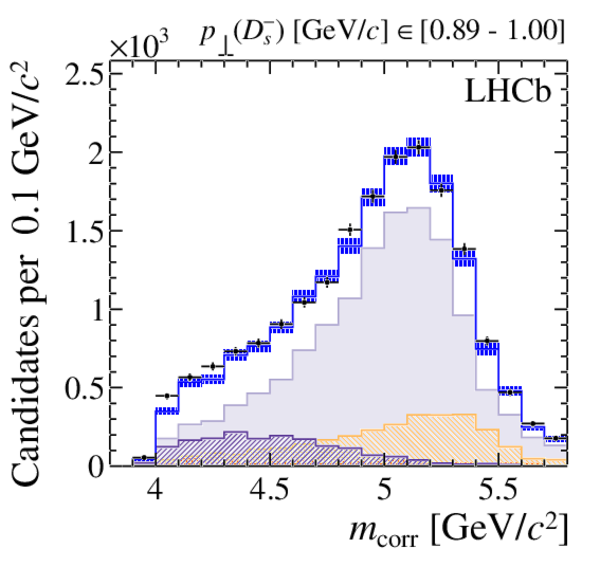
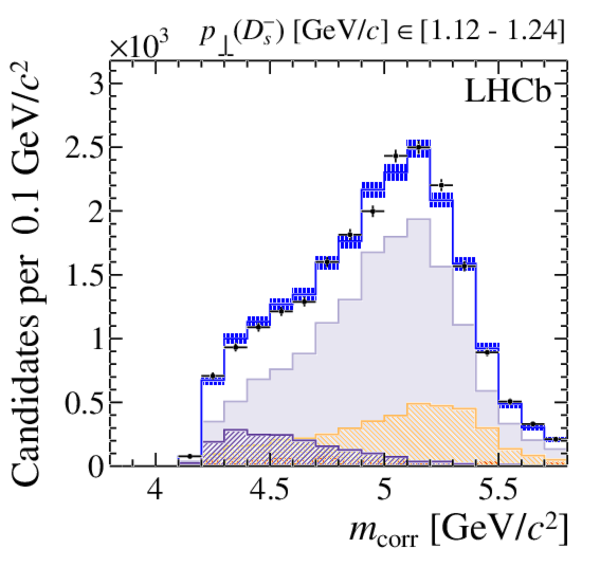
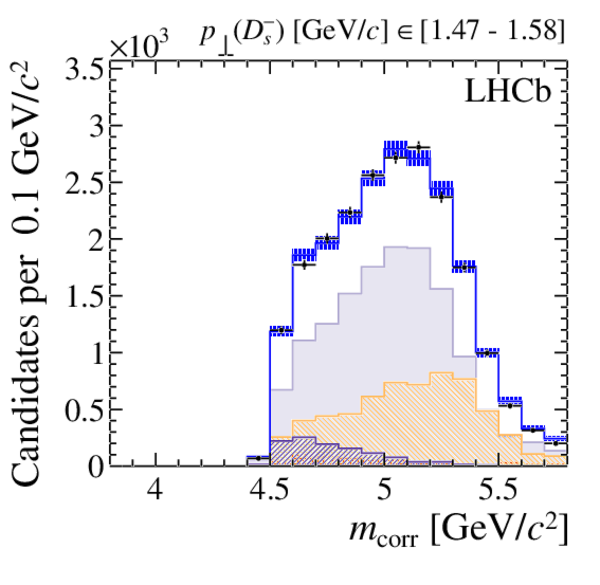
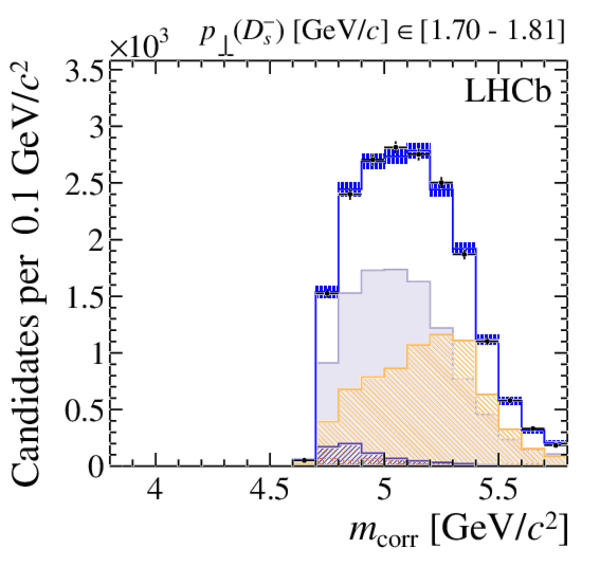
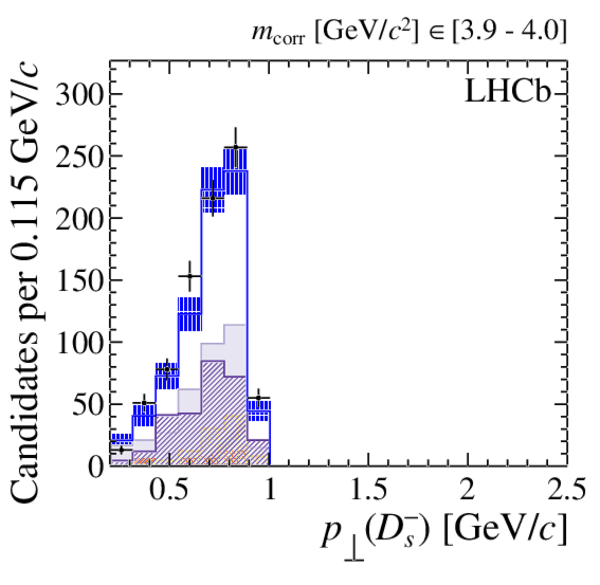
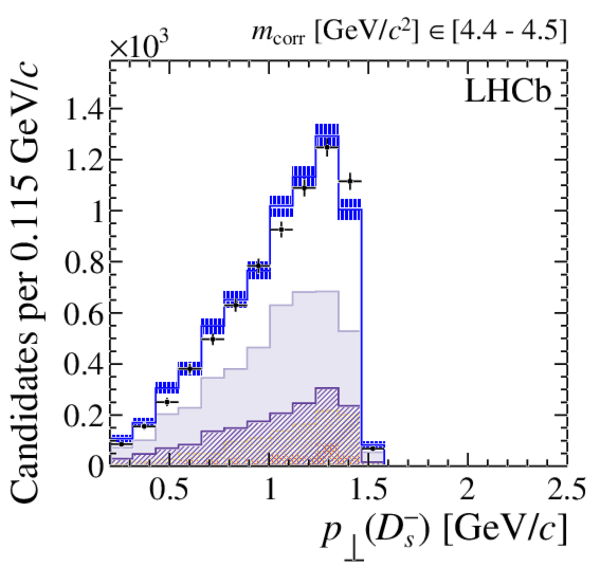
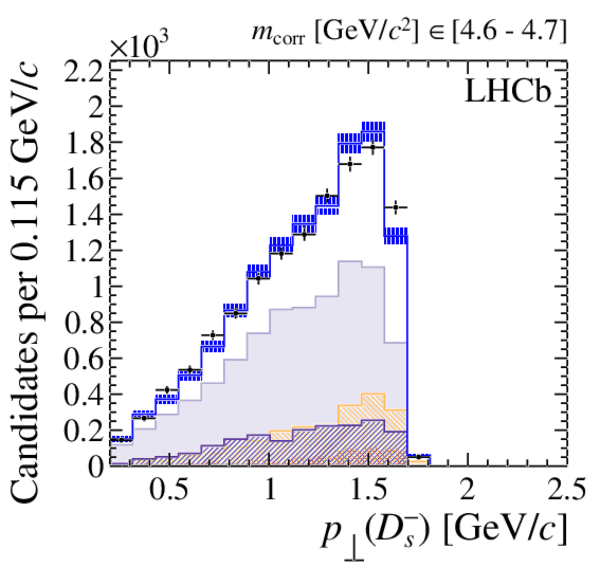
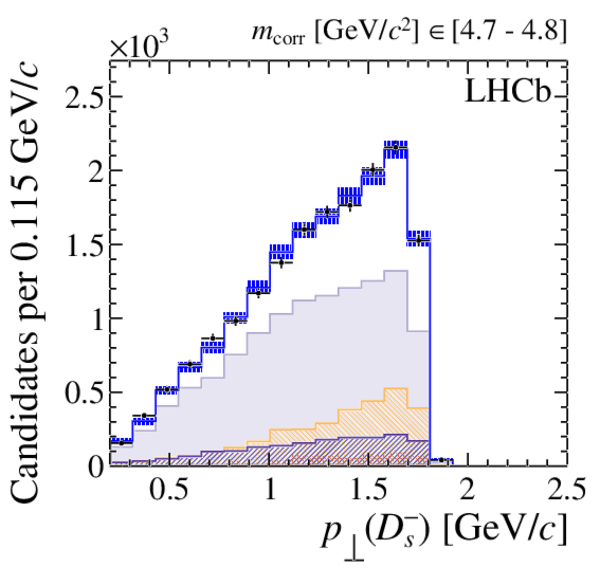
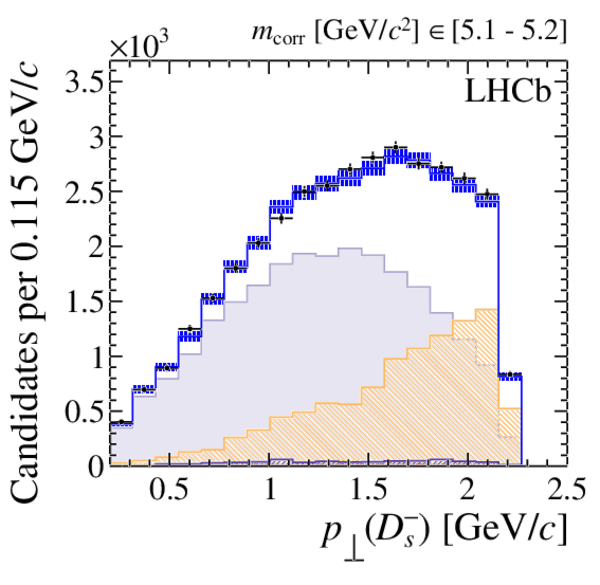
Distribution of (left) $ m_{\text{corr}}$ and (right) $ p_{\perp} ( D ^-_ s )$ for the inclusive sample of signal $ D ^-_ s \mu ^+ $ candidates, with fit projections based on the CLN parametrization overlaid. The projections of the two physics background components are merged together for displaying purposes. |
fit_mc[..].pdf [21 KiB] HiDef png [773 KiB] Thumbnail [388 KiB] *.C file |

|
|
fit_pp[..].pdf [19 KiB] HiDef png [961 KiB] Thumbnail [439 KiB] *.C file |

|
|
|
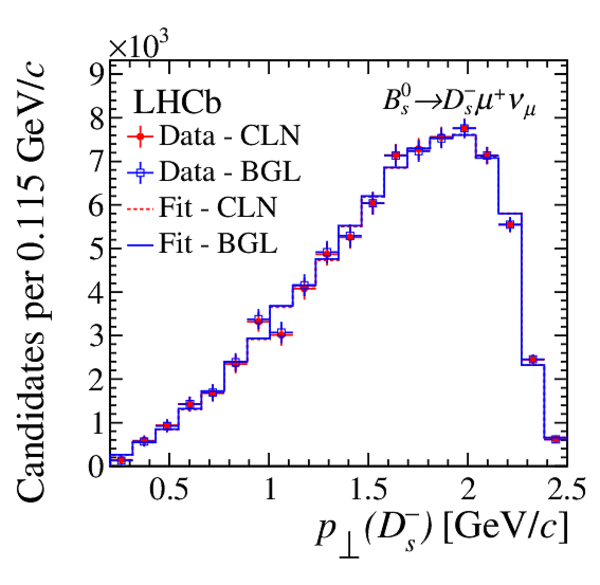
Background-subtracted distribution of $ p_{\perp} ( D ^-_ s )$ for (left) $ B ^0_ s \rightarrow D ^-_ s \mu ^+ \nu _\mu $ and (right) $ B ^0_ s \rightarrow D _{ s }^{*-} \mu ^+ \nu _\mu $ decays obtained from the fit based on the (red closed points, dashed line) CLN and (blue open points, solid line) BGL parametrizations, with corresponding fit projections overlaid. |
BGLvsC[..].pdf [17 KiB] HiDef png [242 KiB] Thumbnail [226 KiB] *.C file |
|
|
BGLvsC[..].pdf [16 KiB] HiDef png [205 KiB] Thumbnail [185 KiB] *.C file |

|
|
|
Animated gif made out of all figures. |
PAPER-2019-041.gif Thumbnail |

|
Tables and captions
|
Functions describing the differential decay rate of $ B \rightarrow D ^{*} \mu\nu$ decays, separately for the cases in which the $ D ^{*}$ meson decays to $ D \gamma$ or $ D \pi^0$. |
Table_1.pdf [66 KiB] HiDef png [70 KiB] Thumbnail [32 KiB] tex code |

|
|
Pole masses for the $ B _ c ^+$ resonances considered in the BGL parameterization of the $ B ^0_ s $ decays, with the $\tilde{\chi}_{J^P}(0)$ constants of the outer functions and the $C_{J^P}$ constants of the Blaschke factors \cite{Bigi:2017njr}. For $ B ^0$ decays, the Blaschke factors do not include the last $1^-$ resonance and $C_{1^\pm}$ have both unit value. |
Table_2.pdf [65 KiB] HiDef png [67 KiB] Thumbnail [31 KiB] tex code |

|
|
External inputs based on experimental measurements. |
Table_3.pdf [79 KiB] HiDef png [81 KiB] Thumbnail [37 KiB] tex code |

|
|
External inputs based on theory calculations. The values and their correlations are derived in Appendix ???, based on Ref. \cite{McLean:2019qcx}. |
Table_4.pdf [84 KiB] HiDef png [109 KiB] Thumbnail [51 KiB] tex code |

|
|
Fit results in the CLN parametrization. The uncertainty is split into two contributions, statistical $\text{ (stat)}$ and that due to the external inputs $\text{ (ext)}$ . |
Table_5.pdf [66 KiB] HiDef png [94 KiB] Thumbnail [43 KiB] tex code |

|
|
Fit results in the BGL parametrization. The uncertainty is split into two contributions, statistical $\text{ (stat)}$ and that due to the uncertainty on the external inputs $\text{ (ext)}$ . |
Table_6.pdf [66 KiB] HiDef png [102 KiB] Thumbnail [47 KiB] tex code |

|
|
Summary of the uncertainties affecting the measured parameters. The upper section reports the systematic uncertainties due to the external inputs $\text{ (ext)}$ , the middle section those due to the experimental methods $\text{ (syst)}$ , and the lower section the statistical uncertainties $\text{ (stat)}$ . For the first source of uncertainty the multiplication by $\tau$ holds only for the $ |V_{ c b }|$ fits. |
Table_7.pdf [85 KiB] Thumbnail [31 KiB] tex code |

|
|
Coefficients of the $f_+(w)$ form factor in the BCL parametrization from Ref. \cite{McLean:2019qcx}. |
Table_8.pdf [51 KiB] HiDef png [53 KiB] Thumbnail [23 KiB] tex code |

|
|
Detailed results for the $ |V_{ c b }|$ fits. The uncertainties on the free parameters include the statistical contribution and that due to the external inputs. |
Table_9.pdf [81 KiB] HiDef png [141 KiB] Thumbnail [61 KiB] tex code |

|
|
Correlations (in %) for the $ |V_{ c b }|$ fit in the CLN parametrization. The top section includes contributions from statistical sources and external inputs, the bottom section contributions from the experimental systematic uncertainties. |
[Error creating the table] | |
|
Correlations (in %) for the $ |V_{ c b }|$ fit in the BGL parametrization. The top section includes contributions from statistical sources and external inputs, the bottom section contributions from the experimental systematic uncertainties. |
[Error creating the table] | |
|
Detailed results for the $\mathcal{R}$ and $\mathcal{R}^*$ fit. The uncertainties on the free parameters include the statistical contribution and that due to the external inputs. |
Table_12.pdf [67 KiB] HiDef png [49 KiB] Thumbnail [24 KiB] tex code |

|
|
Correlations (in %) for the $\mathcal{R}$ and $\mathcal{R}^*$ fit. The top section includes contributions from statistical sources and external inputs, the bottom section contributions from the experimental systematic uncertainties. |
Table_13.pdf [63 KiB] HiDef png [26 KiB] Thumbnail [12 KiB] tex code |

|
Supplementary Material [file]


![HiDef png [1 MiB]](Directory_LHCb-PAPER-2019-041/hidef_AnglesDefinition.png)
![HiDef png [239 KiB]](Directory_LHCb-PAPER-2019-041/hidef_mcorr_vs_pperp_0.png)
![HiDef png [254 KiB]](Directory_LHCb-PAPER-2019-041/hidef_mcorr_vs_pperp_1.png)
![HiDef png [242 KiB]](Directory_LHCb-PAPER-2019-041/hidef_mcorr_vs_pperp_2.png)
![HiDef png [246 KiB]](Directory_LHCb-PAPER-2019-041/hidef_mcorr_vs_pperp_3.png)
![HiDef png [203 KiB]](Directory_LHCb-PAPER-2019-041/hidef_Ds_w_vs_pperp.png)
![HiDef png [229 KiB]](Directory_LHCb-PAPER-2019-041/hidef_DsS_w_vs_pperp.png)
![HiDef png [254 KiB]](Directory_LHCb-PAPER-2019-041/hidef_ctd_vs_pperp.png)
![HiDef png [233 KiB]](Directory_LHCb-PAPER-2019-041/hidef_ctl_vs_pperp.png)
![HiDef png [1 MiB]](Directory_LHCb-PAPER-2019-041/hidef_fit_mcorr_BdKKpi_1112_RFit_oldCut_weigths3_allFFfree_26092019.png)
![HiDef png [1 MiB]](Directory_LHCb-PAPER-2019-041/hidef_fit_pperp_BdKKpi_1112_RFit_oldCut_weigths3_allFFfree_26092019.png)
![HiDef png [773 KiB]](Directory_LHCb-PAPER-2019-041/hidef_fit_mcorr_BsKKpi_1112_VcbFit_oldCut_weigths3_CLNgaussLQCD_26092019.png)
![HiDef png [961 KiB]](Directory_LHCb-PAPER-2019-041/hidef_fit_pperp_BsKKpi_1112_VcbFit_oldCut_weigths3_CLNgaussLQCD_26092019.png)
![HiDef png [242 KiB]](Directory_LHCb-PAPER-2019-041/hidef_BGLvsCLN_bkgsubtracted_BsDs.png)
![HiDef png [205 KiB]](Directory_LHCb-PAPER-2019-041/hidef_BGLvsCLN_bkgsubtracted_BsDsS.png)
![HiDef png [70 KiB]](Directory_LHCb-PAPER-2019-041/hidef_Table_1.png)
![HiDef png [67 KiB]](Directory_LHCb-PAPER-2019-041/hidef_Table_2.png)
![HiDef png [81 KiB]](Directory_LHCb-PAPER-2019-041/hidef_Table_3.png)
![HiDef png [109 KiB]](Directory_LHCb-PAPER-2019-041/hidef_Table_4.png)
![HiDef png [94 KiB]](Directory_LHCb-PAPER-2019-041/hidef_Table_5.png)
![HiDef png [102 KiB]](Directory_LHCb-PAPER-2019-041/hidef_Table_6.png)
![HiDef png [53 KiB]](Directory_LHCb-PAPER-2019-041/hidef_Table_8.png)
![HiDef png [141 KiB]](Directory_LHCb-PAPER-2019-041/hidef_Table_9.png)
![HiDef png [49 KiB]](Directory_LHCb-PAPER-2019-041/hidef_Table_12.png)
![HiDef png [26 KiB]](Directory_LHCb-PAPER-2019-041/hidef_Table_13.png)
![HiDef png [697 KiB]](Directory_LHCb-PAPER-2019-041/supplementary/hidef_Fig1-S.png)
![HiDef png [644 KiB]](Directory_LHCb-PAPER-2019-041/supplementary/hidef_Fig10a-S.png)
![HiDef png [583 KiB]](Directory_LHCb-PAPER-2019-041/supplementary/hidef_Fig10b-S.png)
![HiDef png [592 KiB]](Directory_LHCb-PAPER-2019-041/supplementary/hidef_Fig10c-S.png)
![HiDef png [588 KiB]](Directory_LHCb-PAPER-2019-041/supplementary/hidef_Fig10d-S.png)
![HiDef png [609 KiB]](Directory_LHCb-PAPER-2019-041/supplementary/hidef_Fig10e-S.png)
![HiDef png [643 KiB]](Directory_LHCb-PAPER-2019-041/supplementary/hidef_Fig10f-S.png)
![HiDef png [622 KiB]](Directory_LHCb-PAPER-2019-041/supplementary/hidef_Fig10g-S.png)
![HiDef png [633 KiB]](Directory_LHCb-PAPER-2019-041/supplementary/hidef_Fig10h-S.png)
![HiDef png [617 KiB]](Directory_LHCb-PAPER-2019-041/supplementary/hidef_Fig10i-S.png)
![HiDef png [636 KiB]](Directory_LHCb-PAPER-2019-041/supplementary/hidef_Fig10j-S.png)
![HiDef png [646 KiB]](Directory_LHCb-PAPER-2019-041/supplementary/hidef_Fig10k-S.png)
![HiDef png [655 KiB]](Directory_LHCb-PAPER-2019-041/supplementary/hidef_Fig10l-S.png)
![HiDef png [665 KiB]](Directory_LHCb-PAPER-2019-041/supplementary/hidef_Fig10m-S.png)
![HiDef png [688 KiB]](Directory_LHCb-PAPER-2019-041/supplementary/hidef_Fig10n-S.png)
![HiDef png [691 KiB]](Directory_LHCb-PAPER-2019-041/supplementary/hidef_Fig10o-S.png)
![HiDef png [629 KiB]](Directory_LHCb-PAPER-2019-041/supplementary/hidef_Fig10p-S.png)
![HiDef png [607 KiB]](Directory_LHCb-PAPER-2019-041/supplementary/hidef_Fig10q-S.png)
![HiDef png [566 KiB]](Directory_LHCb-PAPER-2019-041/supplementary/hidef_Fig10r-S.png)
![HiDef png [507 KiB]](Directory_LHCb-PAPER-2019-041/supplementary/hidef_Fig10s-S.png)
![HiDef png [534 KiB]](Directory_LHCb-PAPER-2019-041/supplementary/hidef_Fig10t-S.png)
![HiDef png [523 KiB]](Directory_LHCb-PAPER-2019-041/supplementary/hidef_Fig11a-S.png)
![HiDef png [529 KiB]](Directory_LHCb-PAPER-2019-041/supplementary/hidef_Fig11b-S.png)
![HiDef png [517 KiB]](Directory_LHCb-PAPER-2019-041/supplementary/hidef_Fig11c-S.png)
![HiDef png [568 KiB]](Directory_LHCb-PAPER-2019-041/supplementary/hidef_Fig11d-S.png)
![HiDef png [628 KiB]](Directory_LHCb-PAPER-2019-041/supplementary/hidef_Fig11e-S.png)
![HiDef png [622 KiB]](Directory_LHCb-PAPER-2019-041/supplementary/hidef_Fig11f-S.png)
![HiDef png [598 KiB]](Directory_LHCb-PAPER-2019-041/supplementary/hidef_Fig11g-S.png)
![HiDef png [611 KiB]](Directory_LHCb-PAPER-2019-041/supplementary/hidef_Fig11h-S.png)
![HiDef png [602 KiB]](Directory_LHCb-PAPER-2019-041/supplementary/hidef_Fig11i-S.png)
![HiDef png [567 KiB]](Directory_LHCb-PAPER-2019-041/supplementary/hidef_Fig11j-S.png)
![HiDef png [611 KiB]](Directory_LHCb-PAPER-2019-041/supplementary/hidef_Fig11k-S.png)
![HiDef png [664 KiB]](Directory_LHCb-PAPER-2019-041/supplementary/hidef_Fig11l-S.png)
![HiDef png [782 KiB]](Directory_LHCb-PAPER-2019-041/supplementary/hidef_Fig11m-S.png)
![HiDef png [874 KiB]](Directory_LHCb-PAPER-2019-041/supplementary/hidef_Fig11n-S.png)
![HiDef png [1 MiB]](Directory_LHCb-PAPER-2019-041/supplementary/hidef_Fig11o-S.png)
![HiDef png [1 MiB]](Directory_LHCb-PAPER-2019-041/supplementary/hidef_Fig11p-S.png)
![HiDef png [1 MiB]](Directory_LHCb-PAPER-2019-041/supplementary/hidef_Fig11q-S.png)
![HiDef png [1 MiB]](Directory_LHCb-PAPER-2019-041/supplementary/hidef_Fig11r-S.png)
![HiDef png [1 MiB]](Directory_LHCb-PAPER-2019-041/supplementary/hidef_Fig11s-S.png)
![HiDef png [1 MiB]](Directory_LHCb-PAPER-2019-041/supplementary/hidef_Fig11t-S.png)
![HiDef png [307 KiB]](Directory_LHCb-PAPER-2019-041/supplementary/hidef_Fig2a-S.png)
![HiDef png [856 KiB]](Directory_LHCb-PAPER-2019-041/supplementary/hidef_Fig2b-S.png)
![HiDef png [776 KiB]](Directory_LHCb-PAPER-2019-041/supplementary/hidef_Fig3a-S.png)
![HiDef png [968 KiB]](Directory_LHCb-PAPER-2019-041/supplementary/hidef_Fig3b-S.png)
![HiDef png [696 KiB]](Directory_LHCb-PAPER-2019-041/supplementary/hidef_Fig4a-S.png)
![HiDef png [970 KiB]](Directory_LHCb-PAPER-2019-041/supplementary/hidef_Fig4b-S.png)
![HiDef png [697 KiB]](Directory_LHCb-PAPER-2019-041/supplementary/hidef_Fig4c-S.png)
![HiDef png [973 KiB]](Directory_LHCb-PAPER-2019-041/supplementary/hidef_Fig4d-S.png)
![HiDef png [819 KiB]](Directory_LHCb-PAPER-2019-041/supplementary/hidef_Fig5a-S.png)
![HiDef png [836 KiB]](Directory_LHCb-PAPER-2019-041/supplementary/hidef_Fig5b-S.png)
![HiDef png [831 KiB]](Directory_LHCb-PAPER-2019-041/supplementary/hidef_Fig5c-S.png)
![HiDef png [840 KiB]](Directory_LHCb-PAPER-2019-041/supplementary/hidef_Fig5d-S.png)
![HiDef png [238 KiB]](Directory_LHCb-PAPER-2019-041/supplementary/hidef_Fig6a-S.png)
![HiDef png [241 KiB]](Directory_LHCb-PAPER-2019-041/supplementary/hidef_Fig6b-S.png)
![HiDef png [212 KiB]](Directory_LHCb-PAPER-2019-041/supplementary/hidef_Fig6c-S.png)
![HiDef png [238 KiB]](Directory_LHCb-PAPER-2019-041/supplementary/hidef_Fig6d-S.png)
![HiDef png [104 KiB]](Directory_LHCb-PAPER-2019-041/supplementary/hidef_Fig7a-S.png)
![HiDef png [123 KiB]](Directory_LHCb-PAPER-2019-041/supplementary/hidef_Fig7b-S.png)
![HiDef png [128 KiB]](Directory_LHCb-PAPER-2019-041/supplementary/hidef_Fig7c-S.png)
![HiDef png [134 KiB]](Directory_LHCb-PAPER-2019-041/supplementary/hidef_Fig7d-S.png)
![HiDef png [237 KiB]](Directory_LHCb-PAPER-2019-041/supplementary/hidef_Fig7e-S.png)
![HiDef png [228 KiB]](Directory_LHCb-PAPER-2019-041/supplementary/hidef_Fig7f-S.png)
![HiDef png [637 KiB]](Directory_LHCb-PAPER-2019-041/supplementary/hidef_Fig8a-S.png)
![HiDef png [576 KiB]](Directory_LHCb-PAPER-2019-041/supplementary/hidef_Fig8b-S.png)
![HiDef png [585 KiB]](Directory_LHCb-PAPER-2019-041/supplementary/hidef_Fig8c-S.png)
![HiDef png [582 KiB]](Directory_LHCb-PAPER-2019-041/supplementary/hidef_Fig8d-S.png)
![HiDef png [599 KiB]](Directory_LHCb-PAPER-2019-041/supplementary/hidef_Fig8e-S.png)
![HiDef png [634 KiB]](Directory_LHCb-PAPER-2019-041/supplementary/hidef_Fig8f-S.png)
![HiDef png [613 KiB]](Directory_LHCb-PAPER-2019-041/supplementary/hidef_Fig8g-S.png)
![HiDef png [625 KiB]](Directory_LHCb-PAPER-2019-041/supplementary/hidef_Fig8h-S.png)
![HiDef png [610 KiB]](Directory_LHCb-PAPER-2019-041/supplementary/hidef_Fig8i-S.png)
![HiDef png [627 KiB]](Directory_LHCb-PAPER-2019-041/supplementary/hidef_Fig8j-S.png)
![HiDef png [637 KiB]](Directory_LHCb-PAPER-2019-041/supplementary/hidef_Fig8k-S.png)
![HiDef png [652 KiB]](Directory_LHCb-PAPER-2019-041/supplementary/hidef_Fig8l-S.png)
![HiDef png [663 KiB]](Directory_LHCb-PAPER-2019-041/supplementary/hidef_Fig8m-S.png)
![HiDef png [686 KiB]](Directory_LHCb-PAPER-2019-041/supplementary/hidef_Fig8n-S.png)
![HiDef png [690 KiB]](Directory_LHCb-PAPER-2019-041/supplementary/hidef_Fig8o-S.png)
![HiDef png [629 KiB]](Directory_LHCb-PAPER-2019-041/supplementary/hidef_Fig8p-S.png)
![HiDef png [607 KiB]](Directory_LHCb-PAPER-2019-041/supplementary/hidef_Fig8q-S.png)
![HiDef png [566 KiB]](Directory_LHCb-PAPER-2019-041/supplementary/hidef_Fig8r-S.png)
![HiDef png [507 KiB]](Directory_LHCb-PAPER-2019-041/supplementary/hidef_Fig8s-S.png)
![HiDef png [534 KiB]](Directory_LHCb-PAPER-2019-041/supplementary/hidef_Fig8t-S.png)
![HiDef png [517 KiB]](Directory_LHCb-PAPER-2019-041/supplementary/hidef_Fig9a-S.png)
![HiDef png [519 KiB]](Directory_LHCb-PAPER-2019-041/supplementary/hidef_Fig9b-S.png)
![HiDef png [507 KiB]](Directory_LHCb-PAPER-2019-041/supplementary/hidef_Fig9c-S.png)
![HiDef png [555 KiB]](Directory_LHCb-PAPER-2019-041/supplementary/hidef_Fig9d-S.png)
![HiDef png [613 KiB]](Directory_LHCb-PAPER-2019-041/supplementary/hidef_Fig9e-S.png)
![HiDef png [604 KiB]](Directory_LHCb-PAPER-2019-041/supplementary/hidef_Fig9f-S.png)
![HiDef png [580 KiB]](Directory_LHCb-PAPER-2019-041/supplementary/hidef_Fig9g-S.png)
![HiDef png [594 KiB]](Directory_LHCb-PAPER-2019-041/supplementary/hidef_Fig9h-S.png)
![HiDef png [591 KiB]](Directory_LHCb-PAPER-2019-041/supplementary/hidef_Fig9i-S.png)
![HiDef png [562 KiB]](Directory_LHCb-PAPER-2019-041/supplementary/hidef_Fig9j-S.png)
![HiDef png [605 KiB]](Directory_LHCb-PAPER-2019-041/supplementary/hidef_Fig9k-S.png)
![HiDef png [660 KiB]](Directory_LHCb-PAPER-2019-041/supplementary/hidef_Fig9l-S.png)
![HiDef png [777 KiB]](Directory_LHCb-PAPER-2019-041/supplementary/hidef_Fig9m-S.png)
![HiDef png [873 KiB]](Directory_LHCb-PAPER-2019-041/supplementary/hidef_Fig9n-S.png)
![HiDef png [1 MiB]](Directory_LHCb-PAPER-2019-041/supplementary/hidef_Fig9o-S.png)
![HiDef png [1 MiB]](Directory_LHCb-PAPER-2019-041/supplementary/hidef_Fig9p-S.png)
![HiDef png [1 MiB]](Directory_LHCb-PAPER-2019-041/supplementary/hidef_Fig9q-S.png)
![HiDef png [1 MiB]](Directory_LHCb-PAPER-2019-041/supplementary/hidef_Fig9r-S.png)
![HiDef png [1 MiB]](Directory_LHCb-PAPER-2019-041/supplementary/hidef_Fig9s-S.png)
![HiDef png [1 MiB]](Directory_LHCb-PAPER-2019-041/supplementary/hidef_Fig9t-S.png)
Created on 27 April 2024.