Search for the lepton flavour violating decay $B^+ \rightarrow K^+ \mu^- \tau^+$ using $B_{s2}^{*0}$ decays
[to restricted-access page]Information
LHCb-PAPER-2019-043
CERN-EP-2020-020
arXiv:2003.04352 [PDF]
(Submitted on 09 Mar 2020)
JHEP 06 (2020) 129
Inspire 1784811
Tools
Abstract
A search is presented for the lepton flavour violating decay $B^+ \rightarrow K^+ \mu^- \tau^+$ using a sample of proton--proton collisions at centre-of-mass energies of 7, 8, and 13 TeV, collected with the LHCb detector and corresponding to a total integrated luminosity of 9 fb${}^{-1}$. The $\tau$ leptons are selected inclusively, primarily via decays with a single charged particle. The four-momentum of the $\tau$ lepton is determined by using $B^+$ mesons from $B_{s2}^{*0} \rightarrow B^+ K^-$ decays. No significant excess is observed, and an upper limit is set on the branching fraction $B(B^+ \rightarrow K^+ \mu^- \tau^+) < 3.9 \times 10^{-5}$ at 90 confidence level. The obtained limit is comparable to the world-best limit.
Figures and captions
|
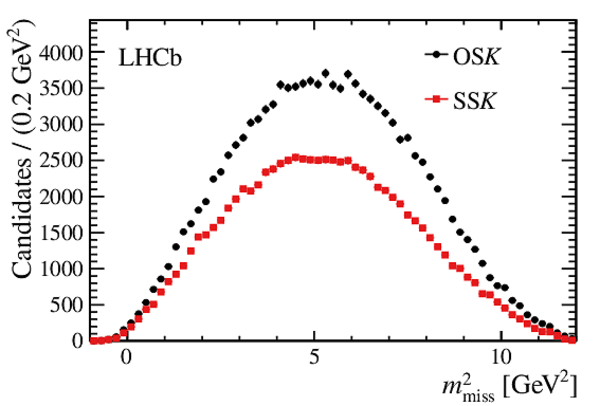
Missing mass squared, $ m_{\mathrm{miss}}^2$ , distributions for (left) simulated signal $ B ^+ \rightarrow K ^+ \mu ^- \tau ^+ $ decays and (right) all selected candidates in data before applying the signal optimisation described in \cref{sec:signal}. |
Fig1a.pdf [18 KiB] HiDef png [204 KiB] Thumbnail [172 KiB] *.C file |

|
|
Fig1b.pdf [19 KiB] HiDef png [188 KiB] Thumbnail [177 KiB] *.C file |
|
|
|
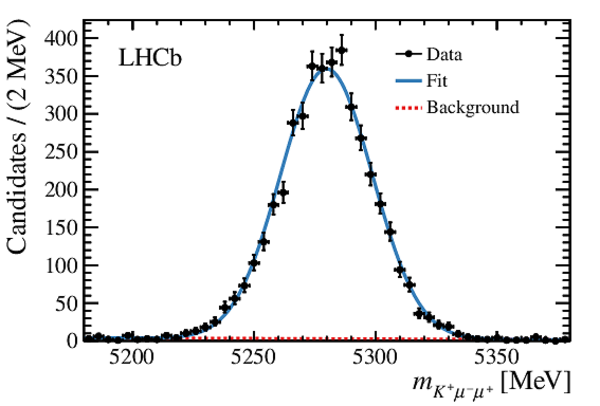
Distributions of normalization candidates in (left) mass, $m_{ K ^+ \mu ^- \mu ^+ }$, and (right) the mass difference, $m_{ B ^+ K ^- } - m_{ B ^+ } - m_{ K ^- }$. The result of each fit is shown as a solid line, with the background component as a dashed line. |
Fig2a.pdf [21 KiB] HiDef png [218 KiB] Thumbnail [177 KiB] *.C file |
|
|
Fig2b.pdf [35 KiB] HiDef png [238 KiB] Thumbnail [201 KiB] *.C file |

|
|
|
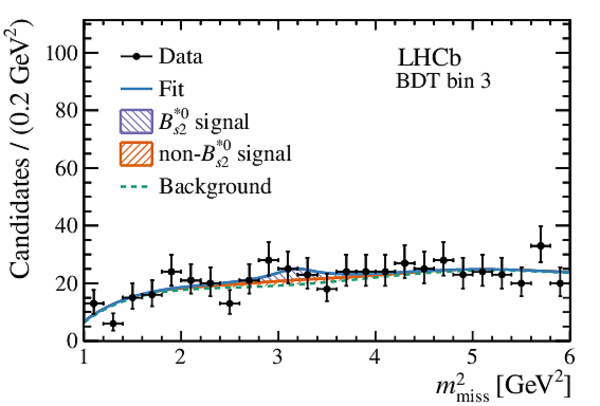
Fits to the missing-mass-squared distribution \text{OS} $ K $ signal sample in each bin of BDT output included in the final fit. The best fit is overlaid. BDT bin 1 is the most background-like. The fit is performed using a fifth degree polynomial description of the background. |
Fig3a.pdf [20 KiB] HiDef png [218 KiB] Thumbnail [186 KiB] *.C file |

|
|
Fig3b.pdf [20 KiB] HiDef png [229 KiB] Thumbnail [189 KiB] *.C file |

|
|
|
Fig3c.pdf [20 KiB] HiDef png [234 KiB] Thumbnail [185 KiB] *.C file |
|
|
|
Fig3d.pdf [21 KiB] HiDef png [271 KiB] Thumbnail [212 KiB] *.C file |

|
|
|
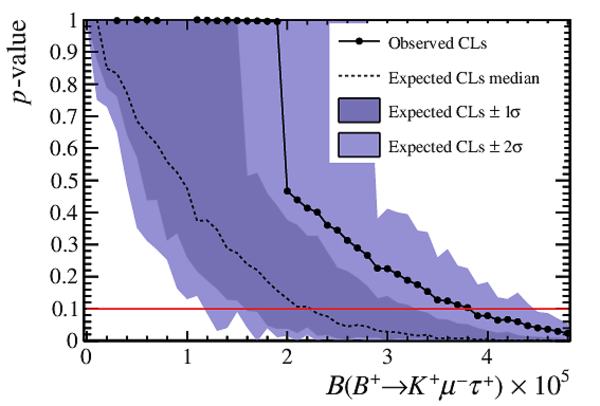
Scan of the $p$-value in the signal branching fraction used to determine the CLs upper limits, compared to the expected one. The horizontal red line shows a $p$-value of 0.1, used to define the 90% CL upper limit. |
Fig4.pdf [17 KiB] HiDef png [333 KiB] Thumbnail [240 KiB] *.C file |
|
|
Animated gif made out of all figures. |
PAPER-2019-043.gif Thumbnail |

|
![HiDef png [204 KiB]](Directory_LHCb-PAPER-2019-043/hidef_Fig1a.png)
![HiDef png [188 KiB]](Directory_LHCb-PAPER-2019-043/hidef_Fig1b.png)
![HiDef png [218 KiB]](Directory_LHCb-PAPER-2019-043/hidef_Fig2a.png)
![HiDef png [238 KiB]](Directory_LHCb-PAPER-2019-043/hidef_Fig2b.png)
![HiDef png [218 KiB]](Directory_LHCb-PAPER-2019-043/hidef_Fig3a.png)
![HiDef png [229 KiB]](Directory_LHCb-PAPER-2019-043/hidef_Fig3b.png)
![HiDef png [234 KiB]](Directory_LHCb-PAPER-2019-043/hidef_Fig3c.png)
![HiDef png [271 KiB]](Directory_LHCb-PAPER-2019-043/hidef_Fig3d.png)
![HiDef png [333 KiB]](Directory_LHCb-PAPER-2019-043/hidef_Fig4.png)
Created on 27 April 2024.