Information
LHCb-PAPER-2020-001
CERN-EP-2020-023
arXiv:2003.03999 [PDF]
(Submitted on 09 Mar 2020)
Phys. Rev. Lett. 124 (2020) 211802
Inspire 1784438
Tools
Abstract
A search for the decays $B^0_s\to e^+e^-$ and $B^0\to e^+e^-$ is performed using data collected with the LHCb experiment in proton-proton collisions at center-of-mass energies of $7$, $8$ and $13 \text{TeV}$, corresponding to integrated luminosities of $1$, $2$ and $2 \text{fb}^{-1}$, respectively. No signal is observed. Assuming no contribution from $B^0\to e^+e^-$ decays, an upper limit of $\mathcal{B}(B^0_s\to e^+e^-)<9.4 (11.2)\times10^{-9}$ is obtained at $90 (95) \%$ confidence level. If no $B^0_s\to e^+e^-$ contribution is assumed, a limit of $\mathcal{B}(B^0\to e^+e^-)<2.5 (3.0)\times10^{-9}$ is determined at $90 (95) \%$ confidence level. These upper limits are more than one order of magnitude lower than the previous values.
Figures and captions
|
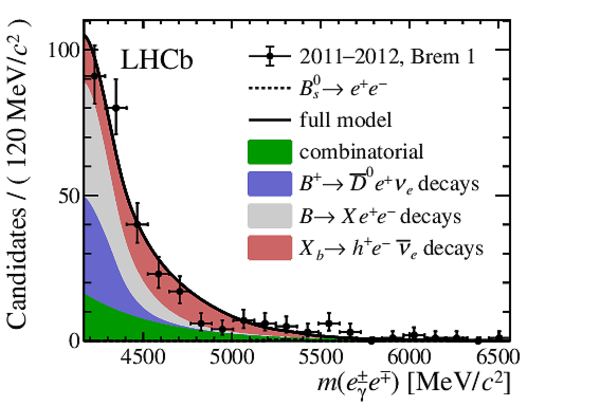
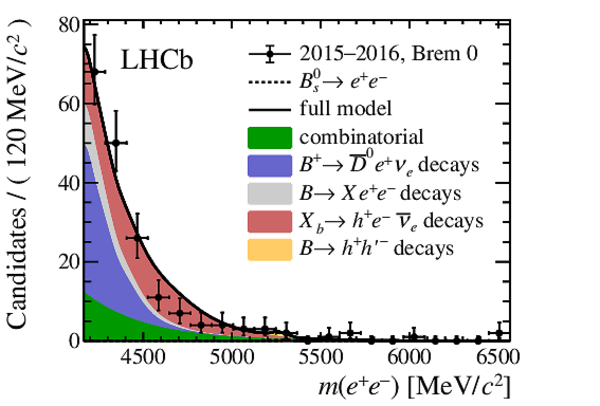
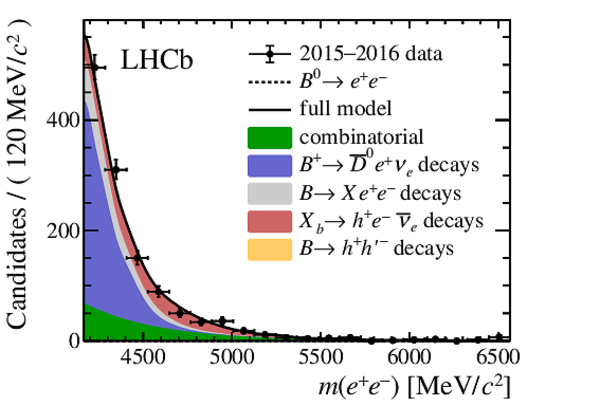
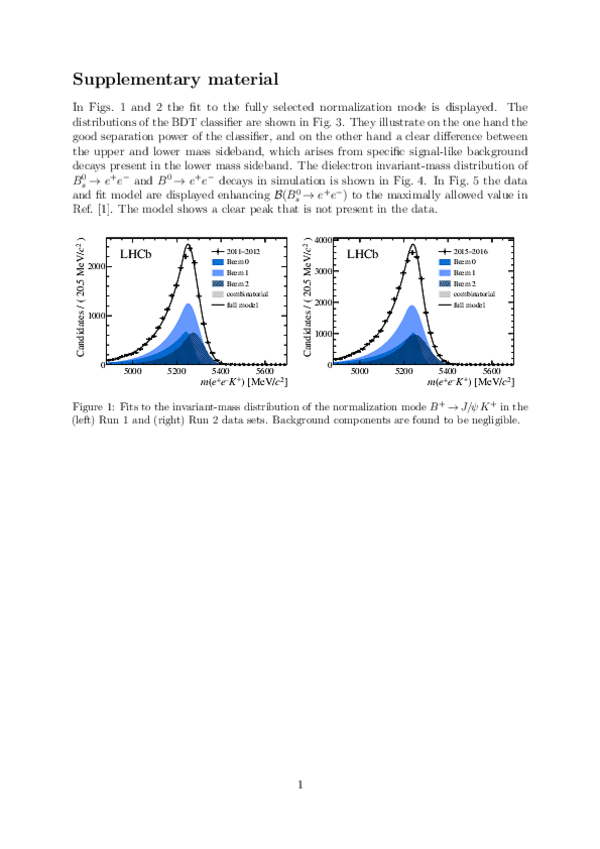
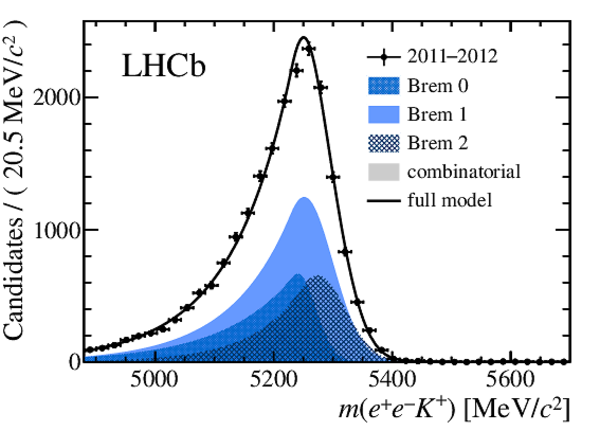
Simultaneous fit to the dielectron invariant-mass distribution, with $\mathcal{B}( B ^0 \rightarrow e ^+ e ^- )$ fixed to zero. The sum of bremsstrahlung categories is shown for (left) Run 1 and (right) Run 2. The relative proportions of background contributions change between Run 1 and Run 2 due to different performances of the particle identification algorithms and BDT selections. |
Fig1a.pdf [18 KiB] HiDef png [275 KiB] Thumbnail [236 KiB] *.C file |

|
|
Fig1b.pdf [18 KiB] HiDef png [258 KiB] Thumbnail [216 KiB] *.C file |

|
|
|
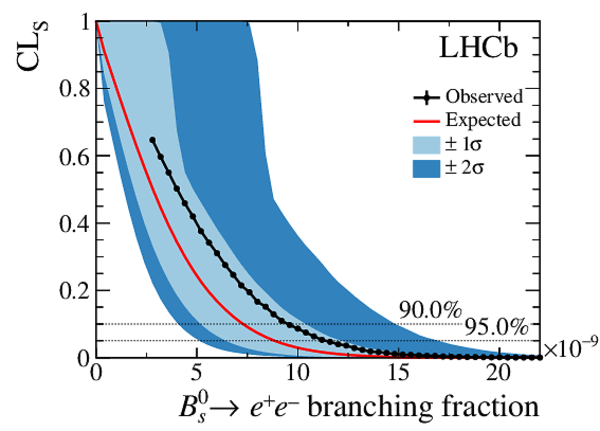
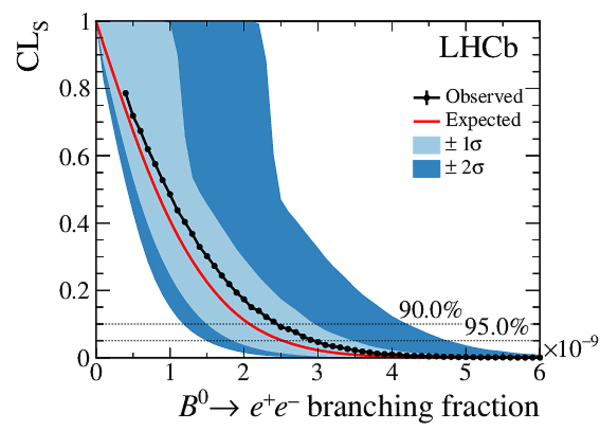
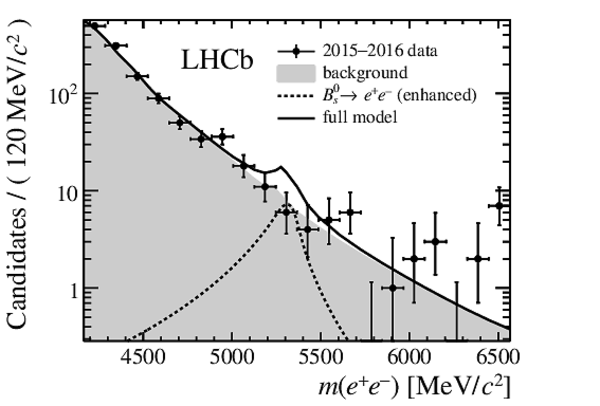
CL$_s$ values as a function of the branching fractions of the decays (left) $ B ^0_ s \rightarrow e ^+ e ^- $ and (right) $ B ^0 \rightarrow e ^+ e ^- $ . The red solid line (black solid line with data points) corresponds to the distribution of the expected (observed) upper limits, and the light blue (dark blue) band contains the $1\sigma$ $(2\sigma)$ uncertainties on the expected upper limits. Thresholds corresponding to $90 \%$ and $95 \%$ confidence level are indicated with dashed lines. The observed values are plotted for branching fractions greater than the measured branching fraction in the data; the test statistic is defined to be nonzero only in that region. |
Fig2a.pdf [17 KiB] HiDef png [335 KiB] Thumbnail [234 KiB] *.C file |
|
|
Fig2b.pdf [17 KiB] HiDef png [343 KiB] Thumbnail [235 KiB] *.C file |
|
|
|
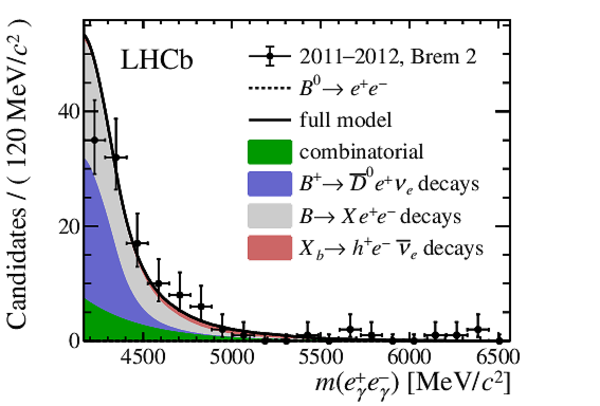
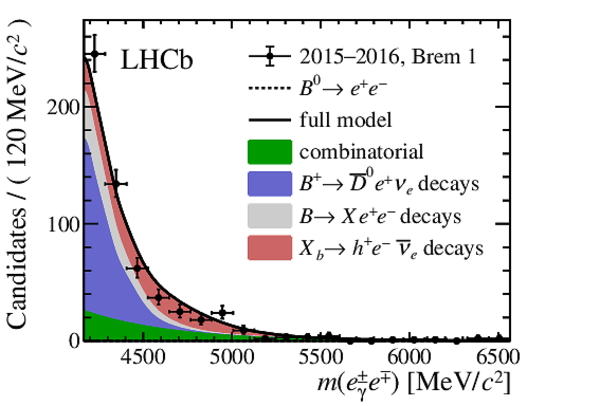
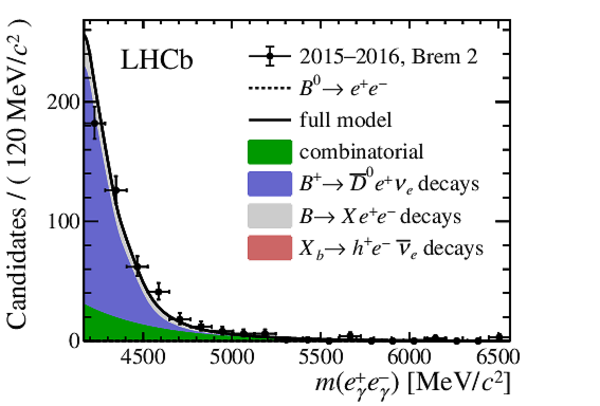
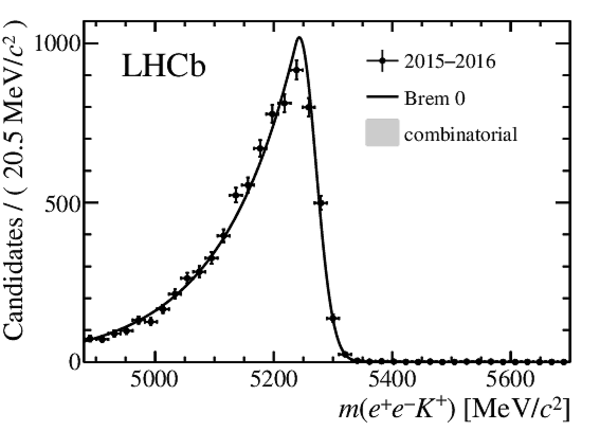
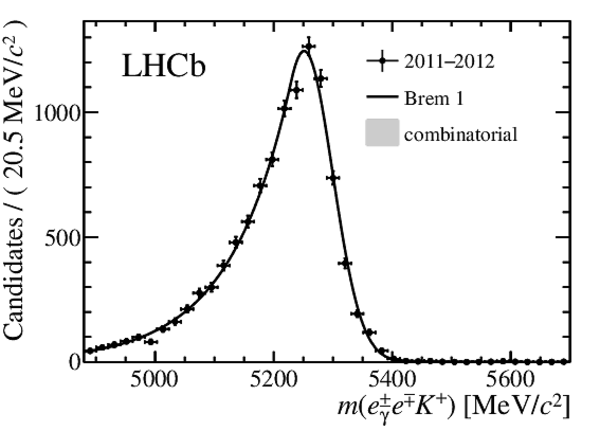
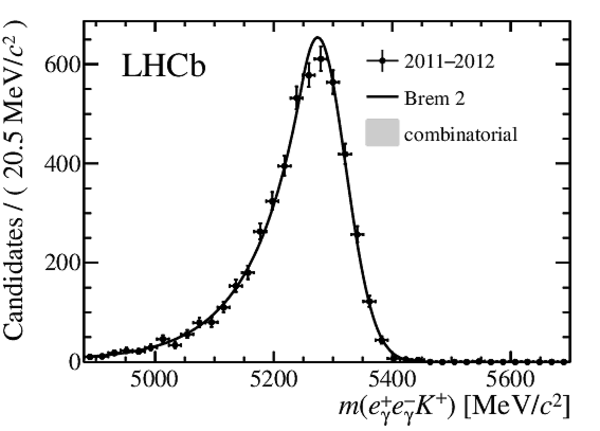
Simultaneous fit to the dielectron invariant-mass distribution in all categories, with $\mathcal{B}( B ^0 \rightarrow e ^+ e ^- )$ fixed to zero. The top figures show the three bremsstrahlung categories in the Run 1 data set and the bottom figures show the Run 2 data set. From left to right, the data sets correspond to the bremsstrahlung correction category with no correction, correcting one electron and correcting both electrons. The relative proportions of background contributions change between Run 1 and Run 2 due to different performances of the particle-identification algorithms and BDT selections. Their relative fractions between bremsstrahlung categories follow the expectation from simulation. |
Fig3a.pdf [18 KiB] HiDef png [258 KiB] Thumbnail [221 KiB] *.C file |

|
|
Fig3b.pdf [19 KiB] HiDef png [257 KiB] Thumbnail [218 KiB] *.C file |
|
|
|
Fig3c.pdf [18 KiB] HiDef png [239 KiB] Thumbnail [207 KiB] *.C file |

|
|
|
Fig3d.pdf [18 KiB] HiDef png [269 KiB] Thumbnail [229 KiB] *.C file |
|
|
|
Fig3e.pdf [19 KiB] HiDef png [250 KiB] Thumbnail [210 KiB] *.C file |

|
|
|
Fig3f.pdf [18 KiB] HiDef png [225 KiB] Thumbnail [197 KiB] *.C file |

|
|
|
Simultaneous fit to the dielectron invariant-mass distribution, with $\mathcal{B}( B ^0_ s \rightarrow e ^+ e ^- )$ fixed to zero. The bremsstrahlung categories are summed over the (left) Run 1 and (right) Run 2 data sets. The relative proportions of background contributions change between Run 1 and Run 2 due to different performances of the particle-identification algorithms and BDT selections. |
Fig4a.pdf [18 KiB] HiDef png [274 KiB] Thumbnail [236 KiB] *.C file |

|
|
Fig4b.pdf [18 KiB] HiDef png [258 KiB] Thumbnail [216 KiB] *.C file |
|
|
|
Simultaneous fit to the dielectron invariant-mass distribution in all categories, with $\mathcal{B}( B ^0_ s \rightarrow e ^+ e ^- )$ fixed to zero. The top figures show the three bremsstrahlung categories in the Run 1 data set and the bottom figures show the Run 2 data set. From left to right, the data sets correspond to the bremsstrahlung correction category with no correction, correcting one electron and correcting both electrons. The relative proportions of background contributions change between Run 1 and Run 2 due to different performances of the particle-identification algorithms and BDT selections. Their relative fractions between bremsstrahlung categories follow the expectation from simulation. |
Fig5a.pdf [18 KiB] HiDef png [258 KiB] Thumbnail [221 KiB] *.C file |

|
|
Fig5b.pdf [18 KiB] HiDef png [257 KiB] Thumbnail [219 KiB] *.C file |

|
|
|
Fig5c.pdf [18 KiB] HiDef png [240 KiB] Thumbnail [208 KiB] *.C file |
|
|
|
Fig5d.pdf [18 KiB] HiDef png [269 KiB] Thumbnail [229 KiB] *.C file |

|
|
|
Fig5e.pdf [18 KiB] HiDef png [251 KiB] Thumbnail [211 KiB] *.C file |
|
|
|
Fig5f.pdf [18 KiB] HiDef png [225 KiB] Thumbnail [198 KiB] *.C file |
|
|
|
Animated gif made out of all figures. |
PAPER-2020-001.gif Thumbnail |

|
Tables and captions
|
Normalization factors $\alpha$ for $ B _{( s )}^0 \rightarrow e ^+ e ^- $ . The bremsstrahlung category denotes whether zero, one or both electrons are corrected for bremsstrahlung losses. The uncertainties include statistical uncertainties and uncertainties due to limited size of the simulated samples. |
Table_1.pdf [60 KiB] HiDef png [47 KiB] Thumbnail [22 KiB] tex code |

|
|
Inputs for the normalization factors, the efficiency ratio $\varepsilon( B ^+ \rightarrow { J \mskip -3mu/\mskip -2mu\psi \mskip 2mu} K ^+ )/\varepsilon( B _{( s )}^0 \rightarrow e ^+ e ^- )$ and normalization yield $N( B ^+ \rightarrow { J \mskip -3mu/\mskip -2mu\psi \mskip 2mu} K ^+ )$. The bremsstrahlung category (Brem. cat.) denotes whether zero, one or both electrons are corrected for bremsstrahlung losses. The uncertainties on the efficiency ratios include statistical uncertainties from the calibration and uncertainties due to limited size of the simulated samples. |
Table_2.pdf [53 KiB] HiDef png [46 KiB] Thumbnail [12 KiB] tex code |

|
Supplementary Material [file]


![HiDef png [275 KiB]](Directory_LHCb-PAPER-2020-001/hidef_Fig1a.png)
![HiDef png [258 KiB]](Directory_LHCb-PAPER-2020-001/hidef_Fig1b.png)
![HiDef png [335 KiB]](Directory_LHCb-PAPER-2020-001/hidef_Fig2a.png)
![HiDef png [343 KiB]](Directory_LHCb-PAPER-2020-001/hidef_Fig2b.png)
![HiDef png [258 KiB]](Directory_LHCb-PAPER-2020-001/hidef_Fig3a.png)
![HiDef png [257 KiB]](Directory_LHCb-PAPER-2020-001/hidef_Fig3b.png)
![HiDef png [239 KiB]](Directory_LHCb-PAPER-2020-001/hidef_Fig3c.png)
![HiDef png [269 KiB]](Directory_LHCb-PAPER-2020-001/hidef_Fig3d.png)
![HiDef png [250 KiB]](Directory_LHCb-PAPER-2020-001/hidef_Fig3e.png)
![HiDef png [225 KiB]](Directory_LHCb-PAPER-2020-001/hidef_Fig3f.png)
![HiDef png [274 KiB]](Directory_LHCb-PAPER-2020-001/hidef_Fig4a.png)
![HiDef png [258 KiB]](Directory_LHCb-PAPER-2020-001/hidef_Fig4b.png)
![HiDef png [258 KiB]](Directory_LHCb-PAPER-2020-001/hidef_Fig5a.png)
![HiDef png [257 KiB]](Directory_LHCb-PAPER-2020-001/hidef_Fig5b.png)
![HiDef png [240 KiB]](Directory_LHCb-PAPER-2020-001/hidef_Fig5c.png)
![HiDef png [269 KiB]](Directory_LHCb-PAPER-2020-001/hidef_Fig5d.png)
![HiDef png [251 KiB]](Directory_LHCb-PAPER-2020-001/hidef_Fig5e.png)
![HiDef png [225 KiB]](Directory_LHCb-PAPER-2020-001/hidef_Fig5f.png)
![HiDef png [47 KiB]](Directory_LHCb-PAPER-2020-001/hidef_Table_1.png)
![HiDef png [46 KiB]](Directory_LHCb-PAPER-2020-001/hidef_Table_2.png)
![HiDef png [157 KiB]](Directory_LHCb-PAPER-2020-001/supplementary/hidef_Fig10a.png)
![HiDef png [153 KiB]](Directory_LHCb-PAPER-2020-001/supplementary/hidef_Fig10b.png)
![HiDef png [509 KiB]](Directory_LHCb-PAPER-2020-001/supplementary/hidef_Fig6a.png)
![HiDef png [503 KiB]](Directory_LHCb-PAPER-2020-001/supplementary/hidef_Fig6b.png)
![HiDef png [131 KiB]](Directory_LHCb-PAPER-2020-001/supplementary/hidef_Fig7a.png)
![HiDef png [127 KiB]](Directory_LHCb-PAPER-2020-001/supplementary/hidef_Fig7b.png)
![HiDef png [126 KiB]](Directory_LHCb-PAPER-2020-001/supplementary/hidef_Fig7c.png)
![HiDef png [134 KiB]](Directory_LHCb-PAPER-2020-001/supplementary/hidef_Fig7d.png)
![HiDef png [130 KiB]](Directory_LHCb-PAPER-2020-001/supplementary/hidef_Fig7e.png)
![HiDef png [128 KiB]](Directory_LHCb-PAPER-2020-001/supplementary/hidef_Fig7f.png)
![HiDef png [301 KiB]](Directory_LHCb-PAPER-2020-001/supplementary/hidef_Fig8a.png)
![HiDef png [303 KiB]](Directory_LHCb-PAPER-2020-001/supplementary/hidef_Fig8b.png)
![HiDef png [176 KiB]](Directory_LHCb-PAPER-2020-001/supplementary/hidef_Fig9a.png)
![HiDef png [176 KiB]](Directory_LHCb-PAPER-2020-001/supplementary/hidef_Fig9b.png)
Created on 27 April 2024.