Information
LHCb-PAPER-2020-008
CERN-EP-2020-086
arXiv:2005.13419 [PDF]
(Submitted on 27 May 2020)
Phys. Rev. D102 (2020) 092005
Inspire 1798038
Tools
Abstract
A study of the lineshape of the $\chi_{c1}(3872)$ state is made using a data sample corresponding to an integrated luminosity of $3 $fb$^{-1}$ collected in $pp$ collisions at centre-of-mass energies of 7 and 8 TeV with the LHCb detector. Candidate $\chi_{c1}(3872)$ and $\psi(2S)$ mesons from b-hadron decays are selected in the $ J/\psi \pi^+ \pi^-$ decay mode. Describing the { lineshape} with a Breit--Wigner function, the mass splitting between the $\chi_{c1}(3872)$ and $\psi(2S)$ states, $\Delta m$, and the width of the $\chi_{c1}(3872)$ state, $\Gamma_{\mathrm{BW}}$, are determined to be \begin{eqnarray*} \Delta m & = & 185.598 \pm 0.067 \pm 0.068 \mathrm{MeV} , \\ \Gamma_{\mathrm{BW}} & = & \phantom{00}1.39\phantom{0} \pm 0.24\phantom{0} \pm 0.10\phantom{0} \mathrm{MeV} , \end{eqnarray*} where the first uncertainty is statistical and the second systematic. Using a Flatt\'e-inspired model, the mode and full width at half maximum of the lineshape are determined to be \begin{eqnarray*} \mathrm{mode} & = 3871.69^{ + 0.00 + 0.05}_{ - 0.04 - 0.13} &\mathrm{MeV} \\ \mathrm{FWHM} & = 0.22^{ + 0.07 + 0.11}_{ - 0.06 - 0.13}& \mathrm{MeV} . \end{eqnarray*} An investigation of the analytic structure of the Flatt\'e amplitude reveals a pole structure, which is compatible with a quasi-bound $D^0\bar{D}^{*0}$ state but a quasi-virtual state is still allowed at the level of $2$ standard deviations.
Figures and captions
|
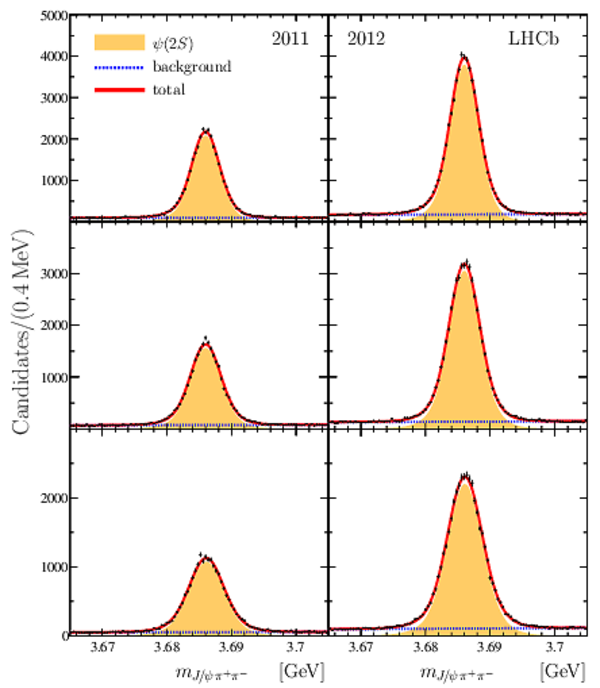
Mass distributions for $ { J \mskip -3mu/\mskip -2mu\psi \mskip 2mu} \pi ^+ \pi ^- $ candidates in the $\psi {(2S)} $ region for (top) the low, (middle) mid and (bottom) high $p_{\pi ^+ \pi ^- }$ bins. The left (right)-hand plot is for 2011 (2012) data. The projection of the fit described in the text is superimposed. |
Figure1.pdf [191 KiB] HiDef png [444 KiB] Thumbnail [309 KiB] *.C file |
|
|
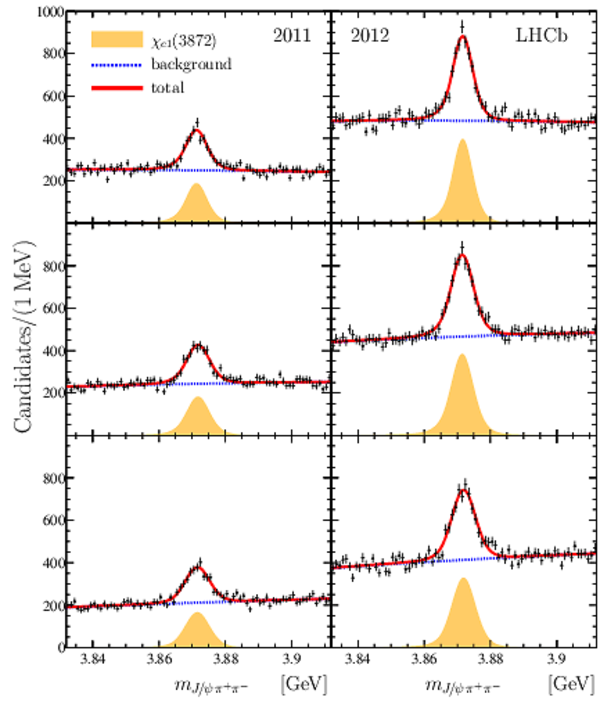
Mass distributions for $ { J \mskip -3mu/\mskip -2mu\psi \mskip 2mu} \pi ^+ \pi ^- $ candidates in the $\chi _{ c 1} (3872)$ region for (top) the low, (middle) mid and (bottom) high $p_{\pi ^+ \pi ^- }$ bins. The left (right)-hand plot is for 2011 (2012) data. The projection of the fit described in the text is superimposed. |
Figure2.pdf [203 KiB] HiDef png [488 KiB] Thumbnail [407 KiB] *.C file |
|
|
The coupling to the $ D \overline{ D }{} ^*$ channels $g$ as a function of Flatt\'e energy parameter $E_f$ (black points with error bars). The corresponding change in negative log likelihood, $\Delta\mathrm{LL}$ is shown as well (red dots). |
Fig3.pdf [15 KiB] HiDef png [90 KiB] Thumbnail [72 KiB] *.C file |

|
|
Comparison of the Flatt\'e (solid, red) and Breit--Wigner (dotted, black) lineshapes. The left plot shows the raw lineshapes for the default fits. The location of the $ D ^0$ $\overline{ D }{} {}^{*0}$ threshold is indicated by the blue vertical line. On the right the distributions are shown after applying smearing with the resolution function and adding background. |
Figure4.pdf [108 KiB] HiDef png [204 KiB] Thumbnail [192 KiB] *.C file |

|
|
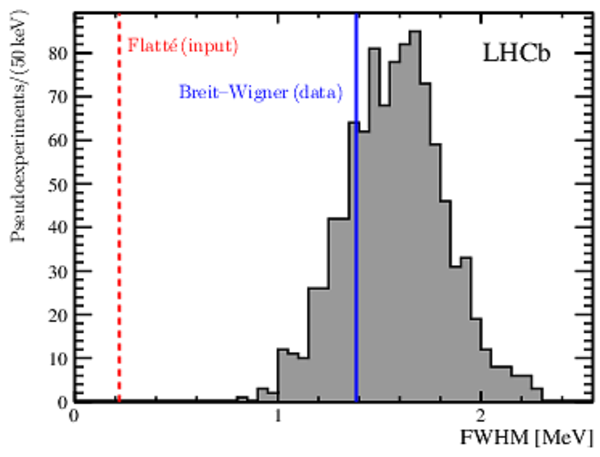
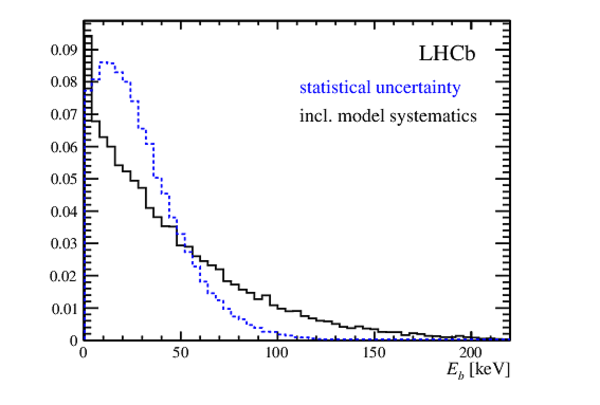
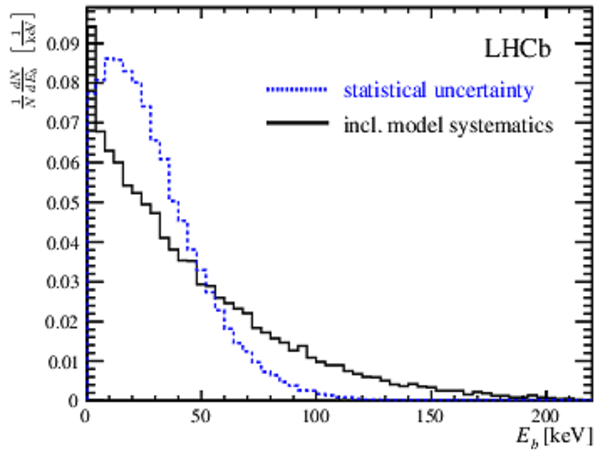
Distribution of the FWHM obtained for simulated experiments generated from the result of the Flatt\'e model and fitted with the Breit--Wigner model (filled histogram). Both models account for the experimental resolution. The dashed red line shows the FWHM of the Flatt\'e lineshape, while the solid blue line indicates the value of the Breit--Wigner width observed in data. |
Figure5.pdf [34 KiB] HiDef png [139 KiB] Thumbnail [177 KiB] *.C file |
|
|
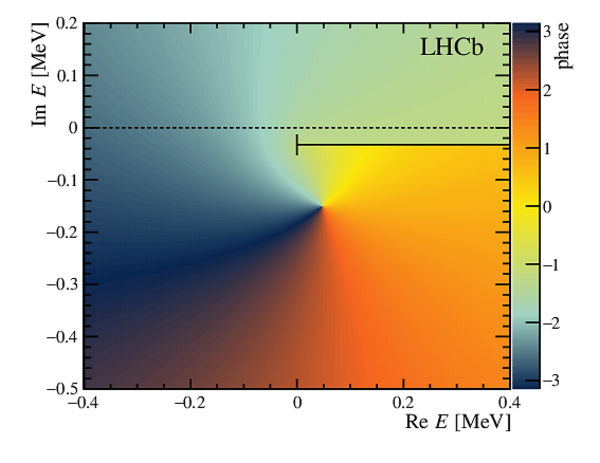
The phase of the Flatt\'e amplitude obtained from the fit to the data with $m_0=3864.5\mathrm{ Me V} $ on sheets I (for $\operatorname{Im} E>0$) and II (for $\operatorname{Im} E<0$) of the complex energy plane. The pole singularity is visible at $E_{\mathrm{II}}=(0.06 - 0.13\:i)\mathrm{ Me V} $. The branch cut is highlighted with the black line. The trajectory of the pole taken when the couplings to all but the $ D \overline{ D }{} {}^* $ channel are scaled down to zero is indicated in red. |
Fig6.pdf [1 MiB] HiDef png [3 MiB] Thumbnail [767 KiB] *.C file |

|
|
The phase of the Flatt\'e amplitude as obtained from the fit with a finite $ D ^{*0}$ width of $\Gamma_ D ^{*0} =65.5\mathrm{ ke V} $ on sheets I (for $\operatorname{Im} E>-\Gamma_{ D ^{*0} }/2$) and II (for $\operatorname{Im} E<-\Gamma_{ D ^{*0} }/2$) of the complex energy plane. Since the $\overline{ D }{} {}^{*0}$ meson is treated as an unstable particle, the $ D ^0$ $\overline{ D }{} {}^{*0}$ branch cut, indicated by the black solid line, is located at $\operatorname{Im} E=-\Gamma_{ D ^{*0} }/2$. The location of the pole is on the physical sheet with respect to the $ D ^0$ $\overline{ D }{} {}^{*0}$ system. |
Fig7.pdf [1 MiB] HiDef png [3 MiB] Thumbnail [764 KiB] *.C file |
|
|
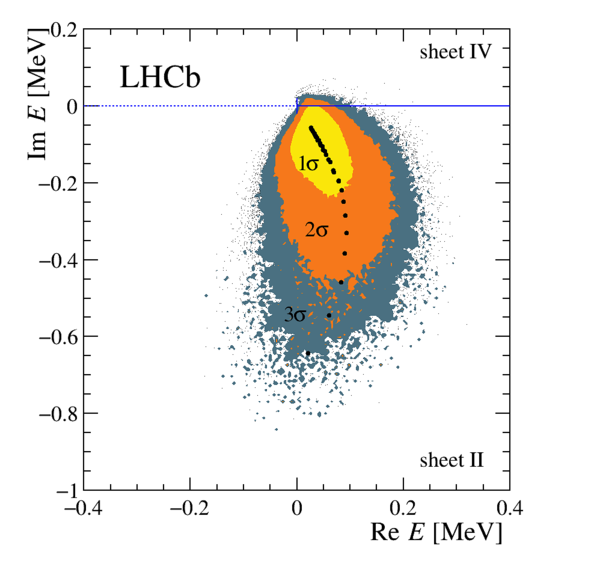
Confidence regions for the pole position on sheets II and IV in the complex energy plane. The displayed uncertainties include statistical contributions and the modeling uncertainty. The poles are extracted at a Flatt\'e mass point of $m_0=3864.5\mathrm{ Me V} $. The shaded areas are the 1, 2 and 3$\sigma$ confidence regions. The branch cut is shown as the blue line. The location of the branch cut singularity is indicated with a vertical bar at $E=0+0\:i$. The best estimates for the pole position is indicated by a cross. The black points indicate the samples from the pseudoexperiments procedure that lie outside the $3\sigma$ region. |
Fig8a.pdf [89 KiB] HiDef png [802 KiB] Thumbnail [421 KiB] *.C file |

|
|
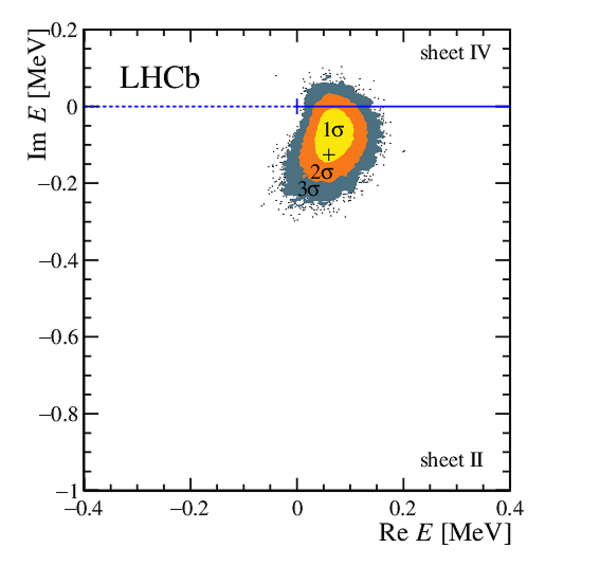
Confidence regions for the pole position on sheet III in the complex energy plane. The displayed uncertainties include statistical contributions and the modeling uncertainty. The poles are extracted at a Flatt\'e mass point of $m_0=3864.5\mathrm{ Me V} $. The shaded areas are the 1, 2 and 3$\sigma$ confidence regions. The branch cut is shown as the blue line. The location of the branch cut singularity is indicated with a vertical bar at $E=0+0\:i$. The best estimate for the pole positions is indicated by a cross. The confidence region for the pole on sheets II/IV is shown in outline for comparison. The black points indicate the samples from the pseudoexperiments procedure that lie outside the $3\sigma$ region. |
Fig8b.pdf [57 KiB] HiDef png [361 KiB] Thumbnail [177 KiB] *.C file |

|
|
Confidence regions for the pole on sheet II in the complex energy plane. The displayed uncertainties include statistical contributions and the uncertainty from the choice of the Flatt\'e mass parameter $m_0$. Modelling uncertainties are not shown. The shaded areas are the 1, 2 and 3$\sigma$ confidence regions. The branch cut is shown as the blue line. The location of the branch cut singularity is indicated with a vertical bar at $E=0+0\:i$. The black circles indicate the best estimates for the pole position for the different choices of $m_0$. |
Fig9_small.pdf [23 KiB] HiDef png [460 KiB] Thumbnail [251 KiB] *.C file |
|
|
Confidence regions for the pole on sheet II in the complex energy plane, in the case that the mass scale is shifted up by $0.066\mathrm{ Me V} $, due to systematic uncertainty of the momentum scale. Only the statistical uncertainties are displayed. The shaded areas are the 1, 2 and 3$\sigma$ confidence regions. The cross indicates the location of the pole found in the default fit, with the nominal momentum scale. The branch cut is shown as the blue line. The location of the branch cut singularity is indicated with a vertical bar at $E=0+0\:i$. |
Fig10.pdf [1022 KiB] HiDef png [181 KiB] Thumbnail [140 KiB] *.C file |
|
|
Animated gif made out of all figures. |
PAPER-2020-008.gif Thumbnail |

|
![HiDef png [444 KiB]](Directory_LHCb-PAPER-2020-008/hidef_Figure1.png)
![HiDef png [488 KiB]](Directory_LHCb-PAPER-2020-008/hidef_Figure2.png)
![HiDef png [90 KiB]](Directory_LHCb-PAPER-2020-008/hidef_Fig3.png)
![HiDef png [204 KiB]](Directory_LHCb-PAPER-2020-008/hidef_Figure4.png)
![HiDef png [139 KiB]](Directory_LHCb-PAPER-2020-008/hidef_Figure5.png)
![HiDef png [3 MiB]](Directory_LHCb-PAPER-2020-008/hidef_Fig6.png)
![HiDef png [3 MiB]](Directory_LHCb-PAPER-2020-008/hidef_Fig7.png)
![HiDef png [802 KiB]](Directory_LHCb-PAPER-2020-008/hidef_Fig8a.png)
![HiDef png [361 KiB]](Directory_LHCb-PAPER-2020-008/hidef_Fig8b.png)
![HiDef png [460 KiB]](Directory_LHCb-PAPER-2020-008/hidef_Fig9_small.png)
![HiDef png [181 KiB]](Directory_LHCb-PAPER-2020-008/hidef_Fig10.png)
Tables and captions
|
Results of the $\psi {(2S)} $ mass and scale factor $s_f$ obtained for the nominal fit model. The quoted uncertainties on the $\psi {(2S)} $ mass and $s_f$ are statistical. |
Table_1.pdf [74 KiB] HiDef png [60 KiB] Thumbnail [27 KiB] tex code |

|
|
Results for $\Delta m$ and $\Gamma_{\mathrm{BW}}$ and $\chi _{ c 1} (3872)$ signal yields. The quoted uncertainties are statistical. |
Table_2.pdf [82 KiB] HiDef png [93 KiB] Thumbnail [47 KiB] tex code |

|
|
Systematic uncertainties on the measurement of the mass difference $\Delta m$. |
Table_3.pdf [41 KiB] HiDef png [39 KiB] Thumbnail [16 KiB] tex code |

|
|
Results from the constrained Flatt\'e fit. The uncertainties are statistical. |
Table_4.pdf [58 KiB] HiDef png [16 KiB] Thumbnail [7 KiB] tex code |

|
|
Systematic uncertainty on the measurement of the Flatt\'e parameters. |
Table_5.pdf [69 KiB] HiDef png [63 KiB] Thumbnail [29 KiB] tex code |

|
|
Results of the fit with the Flatt\'e lineshape including statistical and systematic uncertainties. The Flatt\'e mass parameter $m_0=3864.5\mathrm{ Me V} $ is used. |
Table_6.pdf [59 KiB] HiDef png [23 KiB] Thumbnail [10 KiB] tex code |

|
![HiDef png [60 KiB]](Directory_LHCb-PAPER-2020-008/hidef_Table_1.png)
![HiDef png [93 KiB]](Directory_LHCb-PAPER-2020-008/hidef_Table_2.png)
![HiDef png [39 KiB]](Directory_LHCb-PAPER-2020-008/hidef_Table_3.png)
![HiDef png [16 KiB]](Directory_LHCb-PAPER-2020-008/hidef_Table_4.png)
![HiDef png [63 KiB]](Directory_LHCb-PAPER-2020-008/hidef_Table_5.png)
![HiDef png [23 KiB]](Directory_LHCb-PAPER-2020-008/hidef_Table_6.png)
Supplementary Material [file]
| Supplementary material full pdf |
supple[..].pdf [255 KiB] |

|
|
Figures: - Fig*.* : figures ins different formats - Figure*.* : final (ready-to-use) figures in different format |
FigS1.pdf [13 KiB] HiDef png [93 KiB] Thumbnail [68 KiB] *C file |

|
|
FigS2.pdf [14 KiB] HiDef png [145 KiB] Thumbnail [124 KiB] *C file |
|
|
|
FigureS1.pdf [121 KiB] HiDef png [181 KiB] Thumbnail [113 KiB] *C file |

|
|
|
FigureS2.pdf [41 KiB] HiDef png [182 KiB] Thumbnail [223 KiB] *C file |
|
|
|
lhcb-logo.pdf [4 KiB] HiDef png [269 KiB] Thumbnail [142 KiB] *C file |
|
![HiDef png [93 KiB]](Directory_LHCb-PAPER-2020-008/supplementary/hidef_FigS1.png)
![HiDef png [145 KiB]](Directory_LHCb-PAPER-2020-008/supplementary/hidef_FigS2.png)
![HiDef png [181 KiB]](Directory_LHCb-PAPER-2020-008/supplementary/hidef_FigureS1.png)
![HiDef png [182 KiB]](Directory_LHCb-PAPER-2020-008/supplementary/hidef_FigureS2.png)
![HiDef png [269 KiB]](Directory_LHCb-PAPER-2020-008/supplementary/hidef_lhcb-logo.png)
![Thumbnail [142 KiB]](Directory_LHCb-PAPER-2020-008/supplementary/thumbnail_lhcb-logo.png)
Created on 26 April 2024.