Strong constraints on the $b \to s\gamma$ photon polarisation from $B^0\to K^{*0} e^+ e^-$ decays
[to restricted-access page]Information
LHCb-PAPER-2020-020
CERN-EP-2020-176
arXiv:2010.06011 [PDF]
(Submitted on 12 Oct 2020)
JHEP 12 (2020) 081
Inspire 1822447
Tools
Abstract
An angular analysis of the $B^0 \to K^{*0} e^+ e^-$ decay is performed using a data sample corresponding to an integrated luminosity of $9 {\rm fb}^{-1}$ of $pp$ collisions collected with the LHCb experiment. The analysis is conducted in the very low dielectron mass squared ($q^2$) interval between $0.0008$ and $0.257 {\rm GeV}^2$, where the rate is dominated by the $B^0\to K^{\ast 0}\gamma$ transition with a virtual photon. The fraction of longitudinal polarisation of the $K^{\ast 0}$ meson, $F_{\rm L}$, is measured to be $F_{\rm L} = (4.4 \pm 2.6 \pm 1.4)\%$, where the first uncertainty is statistical and the second systematic. The $A_{\rm T}^{\rm Re}$ observable, which is related to the lepton forward-backward asymmetry, is measured to be $A_{\rm T}^{\rm Re}=-0.06 \pm 0.08 \pm 0.02$. The $A_{\rm T}^{(2)}$ and $A_{\rm T}^{\rm Im}$ transverse asymmetries, which are sensitive to the virtual photon polarisation, are found to be $A_{\rm T}^{(2)} = 0.11 \pm 0.10 \ \pm 0.02$ and $A_{\rm T}^{\rm Im} = 0.02 \pm 0.10 \pm 0.01$. The results are consistent with Standard Model predictions and provide the world's best constraint on the $b\to s\gamma$ photon polarisation.
Figures and captions
|
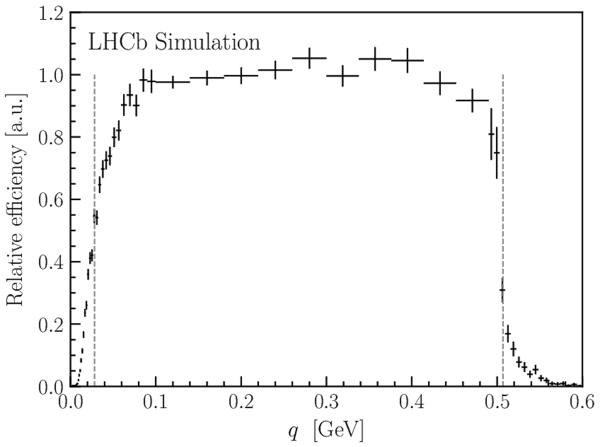
Relative efficiency as a function of the dielectron invariant mass ($q$). The points represent the efficiency obtained from simulation, while the vertical lines represent the effective $ q^2$ boundary defined in the text. |
Fig1.pdf [69 KiB] HiDef png [85 KiB] Thumbnail [46 KiB] *.C file |
|
|
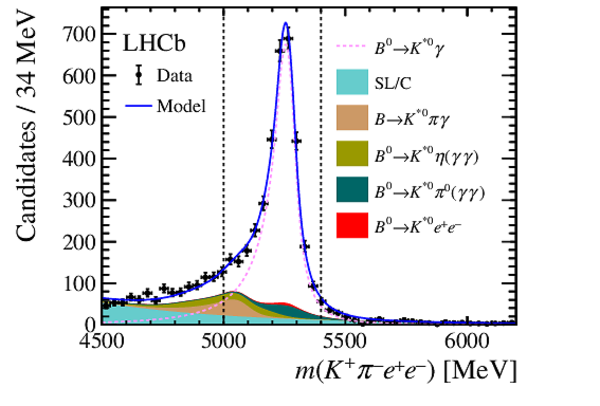
Distributions of the (left) $ K ^+ \pi ^- e ^+ e ^- $ invariant mass and (right) $\cos{\theta_K}$ of $ B ^0 \rightarrow K ^{*0} \gamma $ candidates. The black points represent the data, while the solid blue curve shows the total PDF. The signal component is represented by the dashed pink line and the shaded areas are the background components, as detailed in the legend. The SL/C component is composed of semileptonic and combinatorial background contributions. The dashed vertical lines indicate the restricted mass range used in the angular analysis. |
Fig2a.pdf [23 KiB] HiDef png [287 KiB] Thumbnail [226 KiB] *.C file |
|
|
Fig2b.pdf [17 KiB] HiDef png [214 KiB] Thumbnail [161 KiB] *.C file |

|
|
|
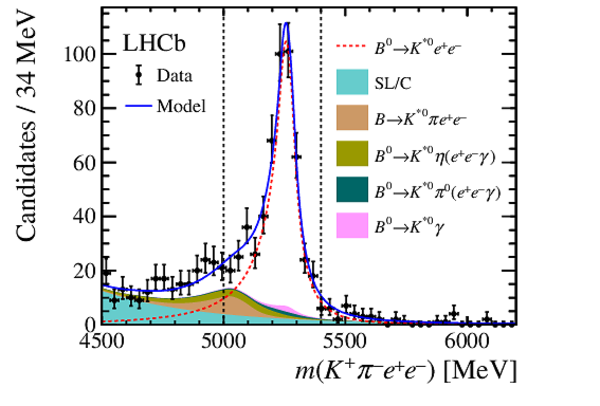
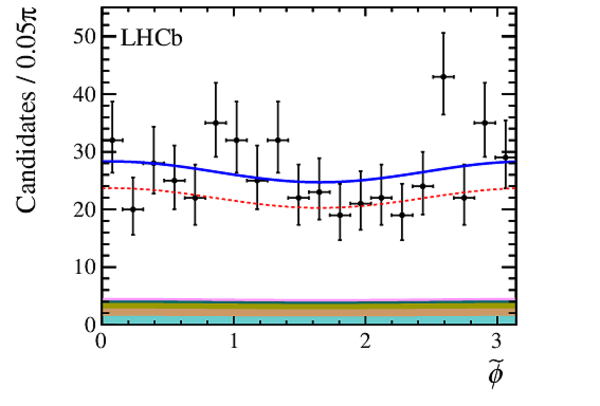
Distributions of the (top left) $ K ^+ \pi ^- e ^+ e ^- $ invariant mass, (top right) $\cos{\theta_\ell}$ , (bottom left) $\cos{\theta_K}$ and (bottom right) $\tilde\phi$ variables of $ B ^0 \rightarrow K ^{*0} e ^+ e ^- $ candidates in the reconstructed $ q^2$ range between $10^{-4}\text{ Ge V} ^2 $ and 0.25 $\text{ Ge V} ^2$ . The black points represent the data, while the solid blue curve shows the total PDF. The signal component is represented by the dashed red line and the shaded areas are the background components, as detailed in the legend. The SL/C component is composed of semileptonic and combinatorial background contributions. The dashed vertical lines indicate the restricted mass range used in the angular analysis. |
Fig3a.pdf [22 KiB] HiDef png [291 KiB] Thumbnail [229 KiB] *.C file |
|
|
Fig3b.pdf [17 KiB] HiDef png [195 KiB] Thumbnail [146 KiB] *.C file |

|
|
|
Fig3c.pdf [17 KiB] HiDef png [204 KiB] Thumbnail [153 KiB] *.C file |

|
|
|
Fig3d.pdf [39 KiB] HiDef png [139 KiB] Thumbnail [120 KiB] *.C file |
|
|
|
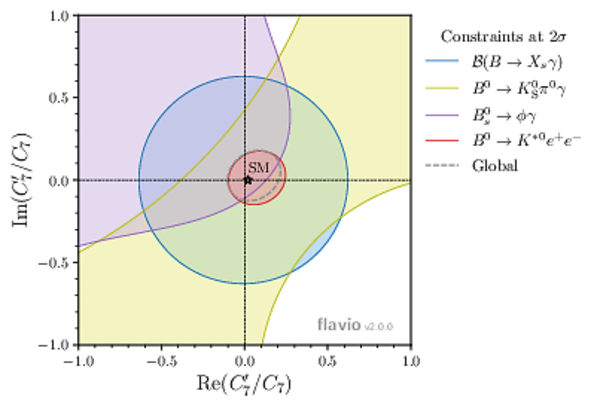
Constraints at $2 \sigma$ level on the real and imaginary parts of the ratio of right- and left-handed Wilson coefficients, $C_7^{\prime}$ and $C_7$. The $C_7$ coefficient is fixed to its SM value. The measurements of the inclusive branching fraction, ${\cal B}(B\rightarrow X_s\gamma)$, and the $ B ^0 \rightarrow K ^0_{\mathrm{S}} \pi ^0 \gamma$ mixing-induced $ C P$ asymmetry by the Belle and BaBar experiments [11,12,13,14,15,16,17] are shown in blue and yellow, respectively, the $ B ^0_ s \rightarrow \phi \gamma $ measurements at LHCb [18] in purple and the measurement presented in this paper in red. The global fit is shown in dashed lines and the SM prediction is represented by a black star and corresponds to the ratio of $s$- and $b$-quark masses. |
Fig4.pdf [441 KiB] HiDef png [298 KiB] Thumbnail [217 KiB] *.C file |
|
|
Animated gif made out of all figures. |
PAPER-2020-020.gif Thumbnail |

|
![HiDef png [85 KiB]](Directory_LHCb-PAPER-2020-020/hidef_Fig1.png)
![HiDef png [287 KiB]](Directory_LHCb-PAPER-2020-020/hidef_Fig2a.png)
![HiDef png [214 KiB]](Directory_LHCb-PAPER-2020-020/hidef_Fig2b.png)
![HiDef png [291 KiB]](Directory_LHCb-PAPER-2020-020/hidef_Fig3a.png)
![HiDef png [195 KiB]](Directory_LHCb-PAPER-2020-020/hidef_Fig3b.png)
![HiDef png [204 KiB]](Directory_LHCb-PAPER-2020-020/hidef_Fig3c.png)
![HiDef png [139 KiB]](Directory_LHCb-PAPER-2020-020/hidef_Fig3d.png)
![HiDef png [298 KiB]](Directory_LHCb-PAPER-2020-020/hidef_Fig4.png)
Tables and captions
|
Summary of systematic uncertainties on the four angular observables, $ A_{\mathrm{T}}^{(2)}$ , $ A_{\mathrm{T}}^{\mathrm{Im}}$ , $ A_{\mathrm{T}}^{\mathrm{Re}}$ and $ F_{\mathrm{L}}$ . The total systematic uncertainty is the sum in quadrature of all the contributions. For comparison, the statistical uncertainties are shown in the last row of the table. |
Table_1.pdf [66 KiB] HiDef png [119 KiB] Thumbnail [54 KiB] tex code |

|
![HiDef png [119 KiB]](Directory_LHCb-PAPER-2020-020/hidef_Table_1.png)
Created on 27 April 2024.