Measurement of the branching fraction of the $B^{0}\rightarrow D_{s}^{+}\pi^{-}$ decay
[to restricted-access page]Information
LHCb-PAPER-2020-021
CERN-EP-2020-183
arXiv:2010.11986 [PDF]
(Submitted on 22 Oct 2020)
Eur. Phys. J. C81 (2021) 314
Inspire 1825957
Tools
Abstract
A branching fraction measurement of the $B^{0}\rightarrow D_{s}^{+}\pi^{-}$ decay is presented using proton-proton collision data collected with the LHCb experiment, corresponding to an integrated luminosity of $5.0 $fb$^{-1}$. The branching fraction is found to be ${\mathcal{B}(B^{0}\rightarrow D_{s}^{+}\pi^{-}) = (19.4 \pm 1.8\pm 1.3 \pm 1.2)\times 10^{-6}}$, where the first uncertainty is statistical, the second systematic and the third is due to the uncertainty on the $B^0 \to D^{-}\pi^{+}$, $D_{s}^{+}\rightarrow K^{+}K^{-}\pi^{+}$ and $D^{-}\rightarrow K^{+}\pi^{-}\pi^{-}$ branching fractions. This is the most precise single measurement of this quantity to date. As this decay proceeds through a single amplitude involving a $b \to u$ charged-current transition, the result provides information on non-factorisable strong interaction effects and the magnitude of the Cabibbo-Kobayashi-Maskawa matrix element $V_{ub}$. Additionally, the collision energy dependence of the hadronisation-fraction ratio $f_s/f_d$ is measured through $\bar{B}{}_{s}^{0}\rightarrow D_{s}^{+}\pi^{-}$ and $B^0 \to D^{-}\pi^{+}$ decays.
Figures and captions
|
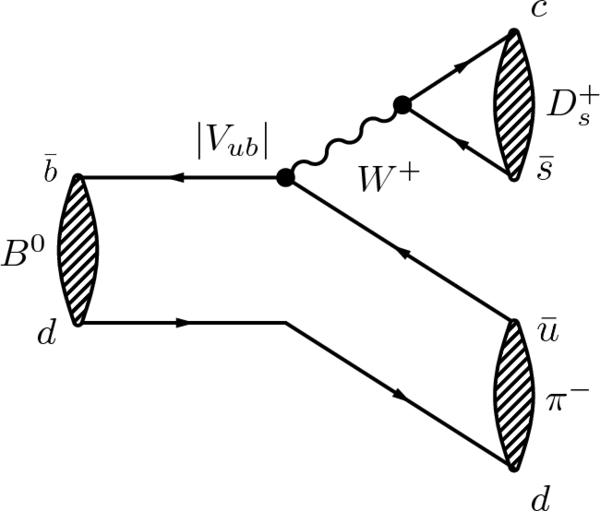
Tree diagram of the $ B ^0 \rightarrow D ^+_ s \pi ^- $ decay, in which a $ B ^0$ meson decays through the weak interaction to a $ D ^+_ s $ meson and a charged pion. This diagram represents the only (leading order) process contributing to this decay. Strong interaction between the $ D ^+_ s $ meson and the pion lead to a non-factorisable contribution to the decay amplitude. |
Bd2DsP[..].png [19 KiB] HiDef png [109 KiB] Thumbnail [31 KiB] *.C file |
|
|
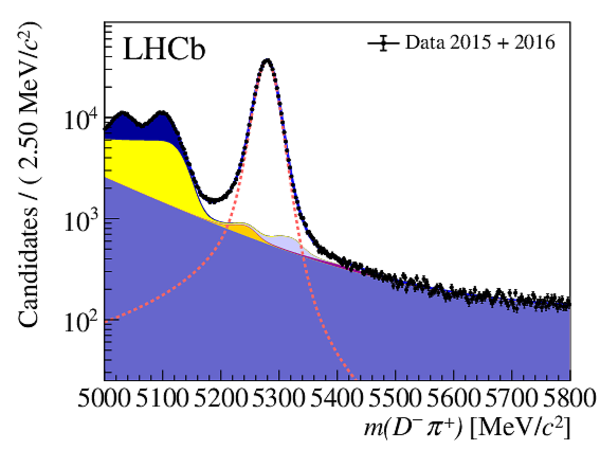
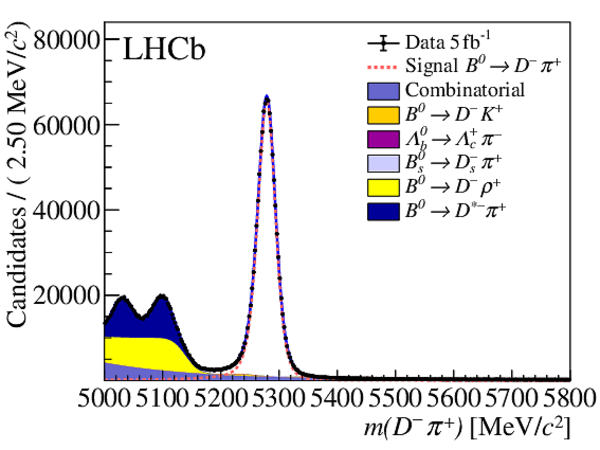
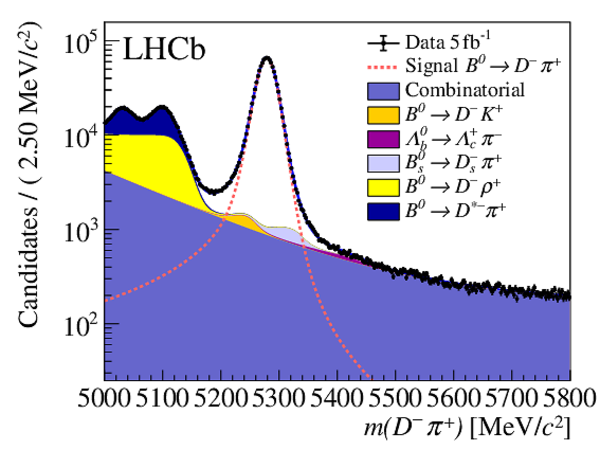
The invariant mass distributions of normalisation $ B ^0 \rightarrow D ^- \pi ^+ $ candidates, for (left) Run 1 and (right) Run 2 data samples. Overlaid are the fit projections along with the signal and background contributions. |
mass_B[..].pdf [84 KiB] HiDef png [373 KiB] Thumbnail [276 KiB] *.C file |

|
|
mass_B[..].pdf [83 KiB] HiDef png [299 KiB] Thumbnail [217 KiB] *.C file |
|
|
|
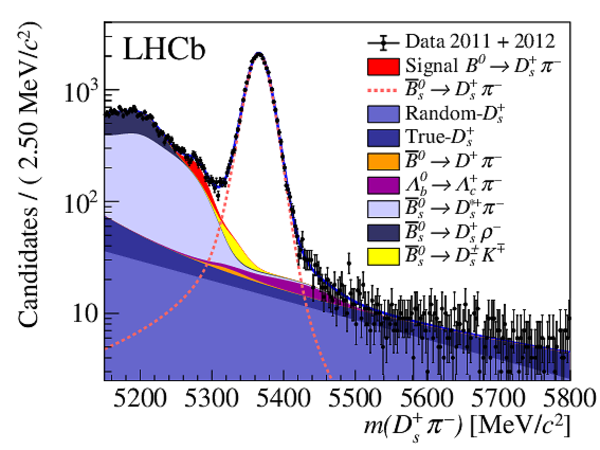
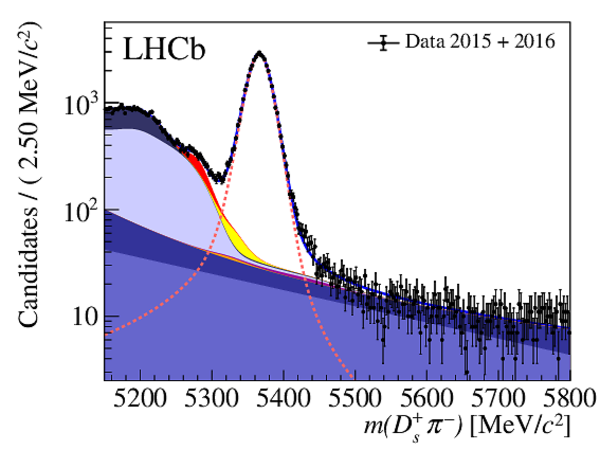
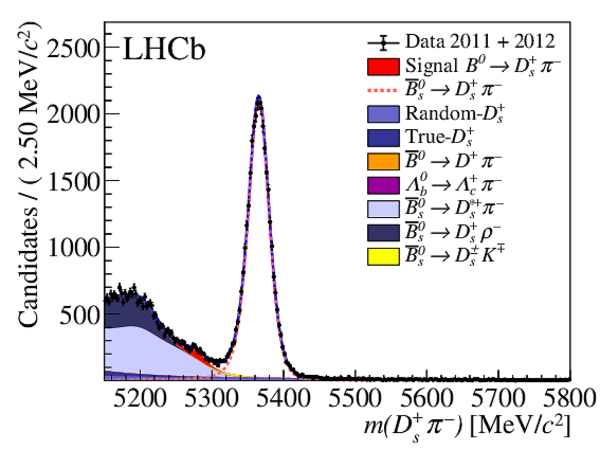
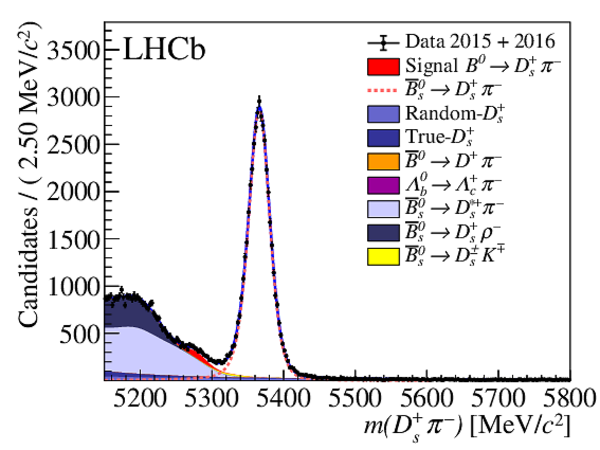
The (top) $ D ^+_ s \pi ^- $ and (bottom) $ K ^+ K ^- \pi ^+ $ invariant mass distributions of signal $ B ^0 \rightarrow D ^+_ s \pi ^- $ candidates, for (left) Run 1 and (right) Run 2 data samples. Overlaid are the fit projections along with the signal and background contributions. |
mass_B[..].pdf [71 KiB] HiDef png [464 KiB] Thumbnail [337 KiB] *.C file |
|
|
mass_B[..].pdf [72 KiB] HiDef png [400 KiB] Thumbnail [270 KiB] *.C file |
|
|
|
mass_B[..].pdf [74 KiB] HiDef png [446 KiB] Thumbnail [288 KiB] *.C file |

|
|
|
mass_B[..].pdf [75 KiB] HiDef png [422 KiB] Thumbnail [276 KiB] *.C file |

|
|
|
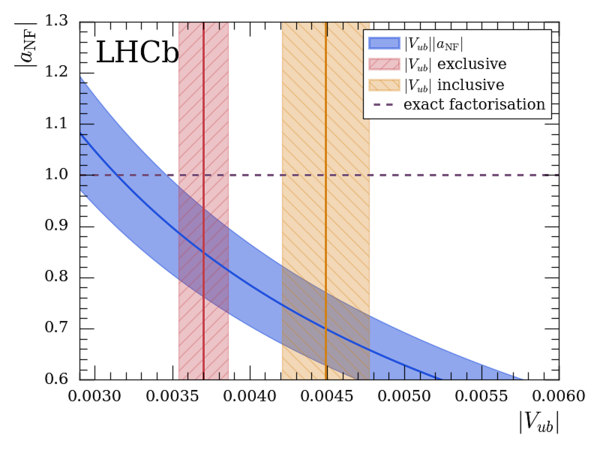
Result of the determination of $|V_{ub}||a_{\text{NF}}|$. The blue line represents the result of this measurement, the vertical bands are the known exclusive and inclusive measurements of $|V_{ub}|$, which are $(3.70\pm 0.16)\times 10^{-3}$ and $(4.49\pm 0.28)\times 10^{-3}$, respectively [38]. The horizontal dashed line at $|a_{\text{NF}}|=1.0$ represents exact factorisation. The error bands represent an uncertainty of one standard deviation. |
Plot_a[..].png [70 KiB] HiDef png [192 KiB] Thumbnail [86 KiB] *.C file |
|
|
Visualisation of the $pp$ collision energy dependence of the efficiency-corrected yield ratio of $\overline{ B } {}^0_ s \rightarrow D ^+_ s \pi ^- $ and $ B ^0 \rightarrow D ^- \pi ^+ $ decays, which scales with $f_{s}/f_{d}$. The inner error bars indicate the statistical uncertainty only, whereas the outer indicate the uncorrelated, including statistical, uncertainties. The correlated systematic uncertainty is not shown. The red dotted line represents a linear fit through the three values of $\mathcal{R}$ with uncorrelated, including statistical, uncertainties. |
R_Ener[..].pdf [14 KiB] HiDef png [137 KiB] Thumbnail [123 KiB] *.C file |

|
|
Animated gif made out of all figures. |
PAPER-2020-021.gif Thumbnail |

|
![Bd2DsP[..].png [19 KiB]](Directory_LHCb-PAPER-2020-021/Bd2DsPi_diagram.png)
![HiDef png [109 KiB]](Directory_LHCb-PAPER-2020-021/hidef_Bd2DsPi_diagram.png)
![HiDef png [373 KiB]](Directory_LHCb-PAPER-2020-021/hidef_mass_Bd2DPi_BeautyMass_kpipi_both_run1_log_run1run2_PaperDraft_Paper.png)
![HiDef png [299 KiB]](Directory_LHCb-PAPER-2020-021/hidef_mass_Bd2DPi_BeautyMass_kpipi_both_20152016_log_run1run2_PaperDraft_PaperNoLeg.png)
![HiDef png [464 KiB]](Directory_LHCb-PAPER-2020-021/hidef_mass_Bs2DsPi_BeautyMass_phipi_both_run1_log_run1run2_PaperDraft_Paper.png)
![HiDef png [400 KiB]](Directory_LHCb-PAPER-2020-021/hidef_mass_Bs2DsPi_BeautyMass_phipi_both_20152016_log_run1run2_PaperDraft_PaperNoLeg.png)
![HiDef png [446 KiB]](Directory_LHCb-PAPER-2020-021/hidef_mass_Bs2DsPi_CharmMass_phipi_both_run1_log_run1run2_PaperDraft_PaperNoLeg.png)
![HiDef png [422 KiB]](Directory_LHCb-PAPER-2020-021/hidef_mass_Bs2DsPi_CharmMass_phipi_both_20152016_log_run1run2_PaperDraft_PaperNoLeg.png)
![Plot_a[..].png [70 KiB]](Directory_LHCb-PAPER-2020-021/Plot_aNF_Vub_result.png)
![HiDef png [192 KiB]](Directory_LHCb-PAPER-2020-021/hidef_Plot_aNF_Vub_result.png)
![HiDef png [137 KiB]](Directory_LHCb-PAPER-2020-021/hidef_R_EnergyDependence.png)
Tables and captions
|
Relative systematic uncertainty $\sigma$ on the $ B ^0 \rightarrow D ^+_ s \pi ^- $ branching fraction measurement. |
Table_1.pdf [72 KiB] HiDef png [82 KiB] Thumbnail [38 KiB] tex code |

|
|
Relative systematic uncertainty $\sigma$ on the ratio of the efficiency-corrected $\overline{ B } {}^0_ s \rightarrow D ^+_ s \pi ^- $ and $ B ^0 \rightarrow D ^- \pi ^+ $ yield ratios. The ratios $\mathcal{R}_{13\text{ Te V} }/\mathcal{R}_{7\text{ Te V} }$ and $\mathcal{R}_{13\text{ Te V} }/\mathcal{R}_{8\text{ Te V} }$ are reported together as the difference of the systematic uncertainty for 7 and 8 $\text{ Te V}$ is negligible. |
Table_2.pdf [71 KiB] HiDef png [57 KiB] Thumbnail [26 KiB] tex code |

|
|
Results of $ B ^0 \rightarrow D ^+_ s \pi ^- $ and $ B ^0 \rightarrow D ^- \pi ^+ $ signal efficiencies and yields, as well as the branching fractions used as input for this measurement [38]. |
Table_3.pdf [90 KiB] HiDef png [58 KiB] Thumbnail [28 KiB] tex code |

|
![HiDef png [82 KiB]](Directory_LHCb-PAPER-2020-021/hidef_Table_1.png)
![HiDef png [57 KiB]](Directory_LHCb-PAPER-2020-021/hidef_Table_2.png)
![HiDef png [58 KiB]](Directory_LHCb-PAPER-2020-021/hidef_Table_3.png)
Supplementary Material [file]
| Supplementary material full pdf |
Supple[..].pdf [787 KiB] |
|
|
This ZIP file contains supplemetary material for the publication LHCb-PAPER-2020-021. The files are: Supplementary.pdf : An overview of the extra figures supplementary.tex : LaTeX document with extra figures *.pdf, *.png, *.eps, *.C : The figures in variuous formats |
Fig1a-S.pdf [83 KiB] HiDef png [314 KiB] Thumbnail [254 KiB] *C file |

|
|
Fig1b-S.pdf [85 KiB] HiDef png [299 KiB] Thumbnail [237 KiB] *C file |

|
|
|
Fig2a-S.pdf [85 KiB] HiDef png [293 KiB] Thumbnail [231 KiB] *C file |
|
|
|
Fig2b-S.pdf [84 KiB] HiDef png [334 KiB] Thumbnail [259 KiB] *C file |
|
|
|
Fig3a-S.pdf [72 KiB] HiDef png [315 KiB] Thumbnail [247 KiB] *C file |
|
|
|
Fig3b-S.pdf [73 KiB] HiDef png [321 KiB] Thumbnail [260 KiB] *C file |
|
|
|
Fig4a-S.pdf [73 KiB] HiDef png [313 KiB] Thumbnail [250 KiB] *C file |

|
|
|
Fig4b-S.pdf [73 KiB] HiDef png [449 KiB] Thumbnail [323 KiB] *C file |

|
|
|
Fig4c-S.pdf [76 KiB] HiDef png [473 KiB] Thumbnail [327 KiB] *C file |

|
![HiDef png [314 KiB]](Directory_LHCb-PAPER-2020-021/supplementary/hidef_Fig1a-S.png)
![HiDef png [299 KiB]](Directory_LHCb-PAPER-2020-021/supplementary/hidef_Fig1b-S.png)
![HiDef png [293 KiB]](Directory_LHCb-PAPER-2020-021/supplementary/hidef_Fig2a-S.png)
![HiDef png [334 KiB]](Directory_LHCb-PAPER-2020-021/supplementary/hidef_Fig2b-S.png)
![HiDef png [315 KiB]](Directory_LHCb-PAPER-2020-021/supplementary/hidef_Fig3a-S.png)
![HiDef png [321 KiB]](Directory_LHCb-PAPER-2020-021/supplementary/hidef_Fig3b-S.png)
![HiDef png [313 KiB]](Directory_LHCb-PAPER-2020-021/supplementary/hidef_Fig4a-S.png)
![HiDef png [449 KiB]](Directory_LHCb-PAPER-2020-021/supplementary/hidef_Fig4b-S.png)
![HiDef png [473 KiB]](Directory_LHCb-PAPER-2020-021/supplementary/hidef_Fig4c-S.png)
Created on 02 May 2024.