Information
LHCb-PAPER-2020-032
CERN-EP-2020-190
arXiv:2010.14485 [PDF]
(Submitted on 27 Oct 2020)
Phys. Rev. D103 (2021) 012004
Inspire 1826502
Tools
Abstract
Using a proton-proton collision data sample collected by the LHCb experiment, corresponding to an integrated luminosity of 8.5 fb$^{-1}$, the observation of a new excited $\Xi_b^0$ resonance decaying to the $\Xi_b^-\pi^+$ final state is presented. The state, referred to as $\Xi_b(6227)^0$, has a measured mass and natural width of $m(\Xi_b(6227)^0) = 6227.1^{ +1.4}_{ -1.5}\pm0.5$ MeV, $\Gamma(\Xi_b(6227)^0) = 18.6^{ +5.0}_{ -4.1}\pm1.4$ MeV, where the uncertainties are statistical and systematic. The production rate of the $\Xi_b(6227)^0$ state relative to that of the $\Xi_b^-$ baryon in the kinematic region $2<\eta<5$ and $p_{\rm T}<30$ GeV is measured to be $\frac{f_{\Xi_b(6227)^0}}{f_{\Xi_b^-}}{\mathcal{B}}(\Xi_b(6227)^0\to\Xi_b^-\pi^+) = 0.045\pm0.008\pm0.004$, where ${\mathcal{B}}(\Xi_b(6227)^0\to\Xi_b^-\pi^+)$ is the branching fraction of the decay, and $f_{\Xi_b(6227)^0}$ and $f_{\Xi_b^-}$ represent fragmentation fractions. Improved measurements of the mass and natural width of the previously observed $\Xi_b(6227)^-$ state, along with the mass of the $\Xi_b^-$ baryon, are also reported. Both measurements are significantly more precise than, and consistent with, previously reported values.
Figures and captions
|
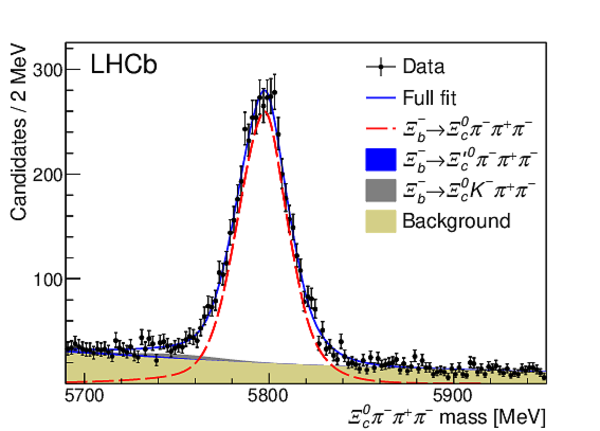
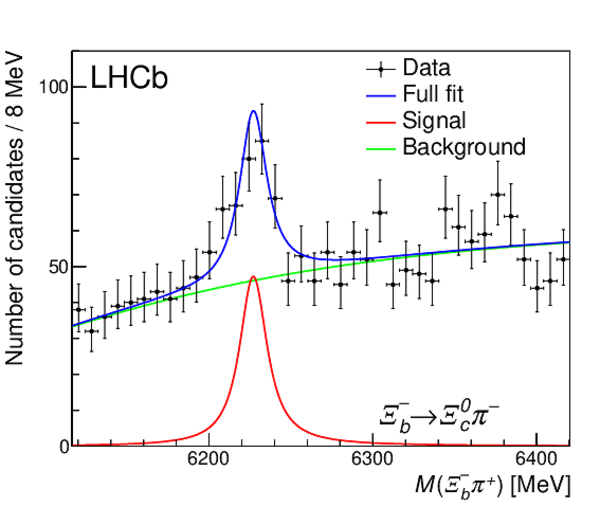
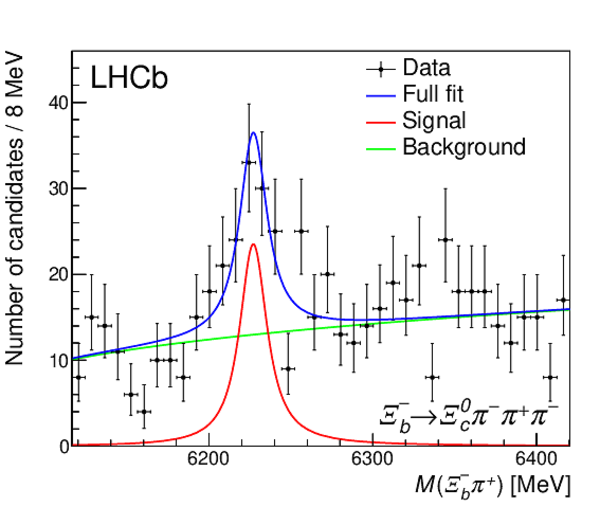
Invariant-mass spectra for (left) $\Xi ^-_ b \rightarrow \Xi ^0_ c \pi ^- $ and (right) $\Xi ^-_ b \rightarrow \Xi ^0_ c \pi ^- \pi ^+ \pi ^- $ candidates after all selection requirements. Projections of the fits to the data are overlaid. |
Fig1a.pdf [35 KiB] HiDef png [222 KiB] Thumbnail [158 KiB] *.C file |

|
|
Fig1b.pdf [36 KiB] HiDef png [286 KiB] Thumbnail [201 KiB] *.C file |
|
|
|
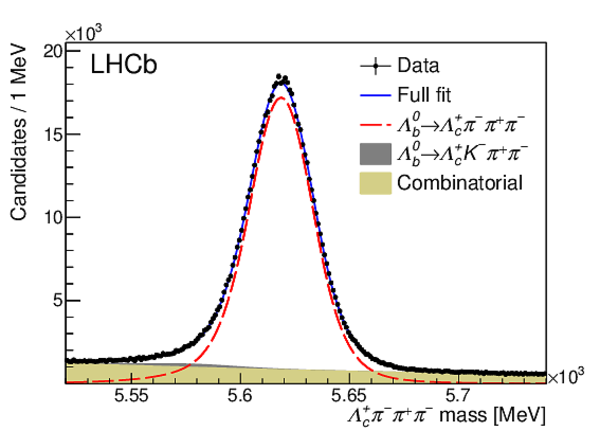
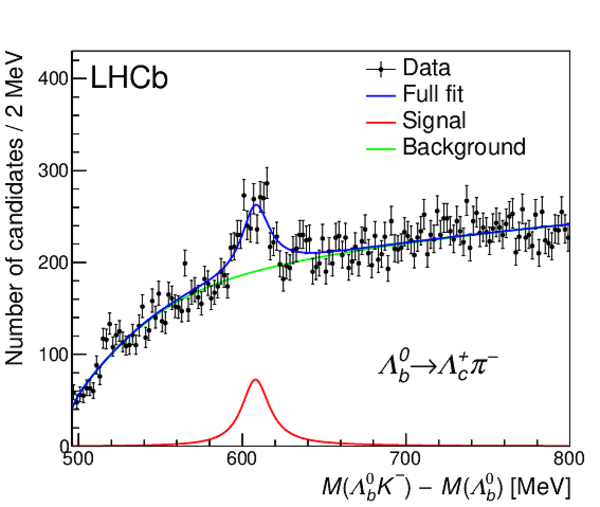
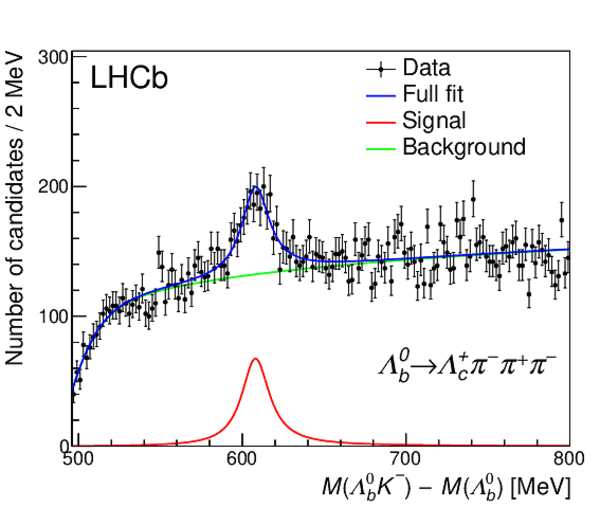
Invariant-mass spectra for (left) $\Lambda ^0_ b \rightarrow \Lambda ^+_ c \pi ^- $ and (right) $\Lambda ^0_ b \rightarrow \Lambda ^+_ c \pi ^- \pi ^+ \pi ^- $ candidates after all selection requirements. Projections of the fits to the data are overlaid. |
Fig2a.pdf [35 KiB] HiDef png [193 KiB] Thumbnail [141 KiB] *.C file |

|
|
Fig2b.pdf [35 KiB] HiDef png [216 KiB] Thumbnail [161 KiB] *.C file |
|
|
|
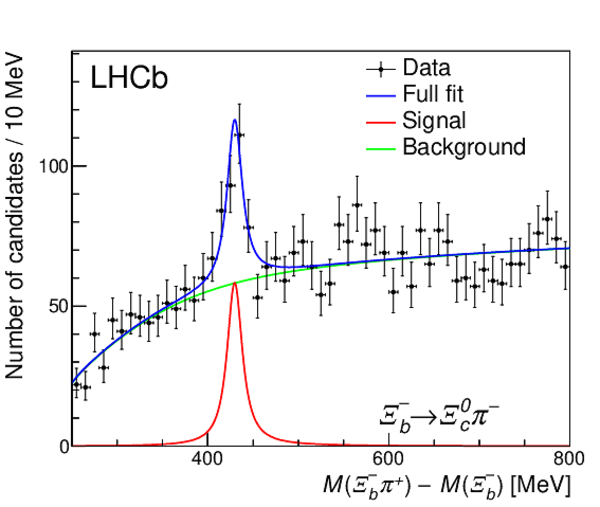
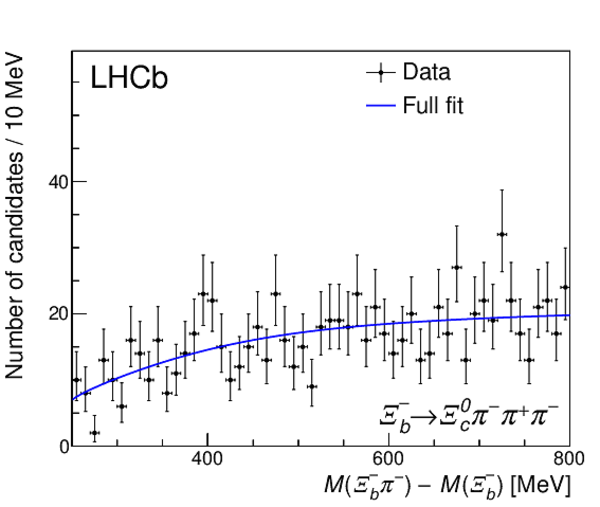
Distribution of reconstructed $\delta M_{\pi}=M(\Xi ^-_ b \pi ^+ )-M(\Xi ^-_ b )$ in $\Xi _ b (6227)^{0} \rightarrow \Xi ^-_ b \pi ^+ $ candidate decays, with (top) $\Xi ^-_ b \rightarrow \Xi ^0_ c \pi ^- $ decays, and (bottom) $\Xi ^-_ b \rightarrow \Xi ^0_ c \pi ^- \pi ^+ \pi ^- $ decays. The left column shows the right-sign candidates and the right column shows the wrong-sign candidates. The fit projections are overlaid. |
Fig3a.pdf [20 KiB] HiDef png [242 KiB] Thumbnail [190 KiB] *.C file |
|
|
Fig3b.pdf [19 KiB] HiDef png [178 KiB] Thumbnail [153 KiB] *.C file |

|
|
|
Fig3c.pdf [20 KiB] HiDef png [252 KiB] Thumbnail [196 KiB] *.C file |

|
|
|
Fig3d.pdf [18 KiB] HiDef png [181 KiB] Thumbnail [154 KiB] *.C file |
|
|
|
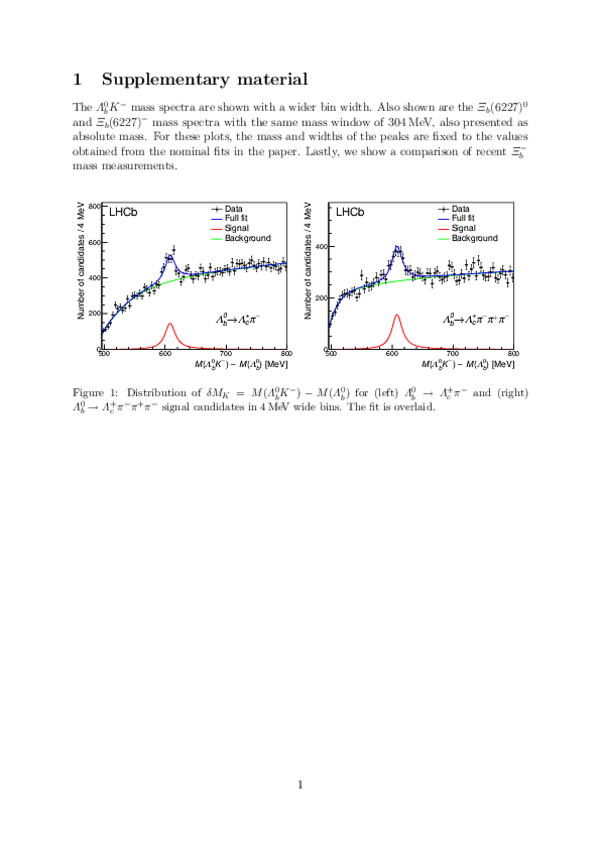
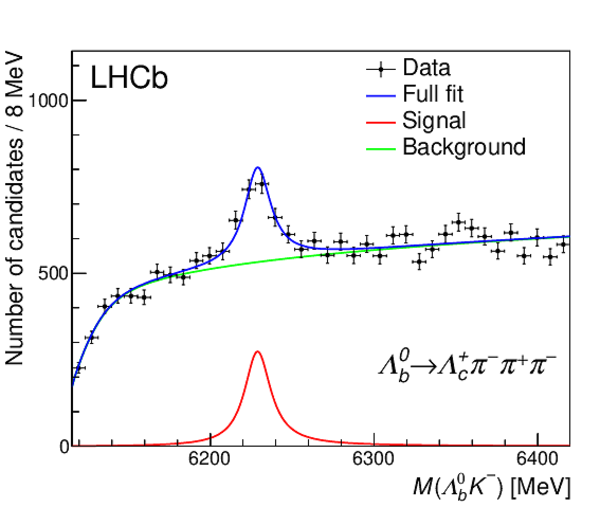
Distribution of reconstructed $\delta M_K = M(\Lambda ^0_ b K ^- )-M(\Lambda ^0_ b )$ in $\Xi _ b (6227)^{-} \rightarrow \Lambda ^0_ b K ^- $ candidate decays, with (left) $\Lambda ^0_ b \rightarrow \Lambda ^+_ c \pi ^- $ and (right) $\Lambda ^0_ b \rightarrow \Lambda ^+_ c \pi ^- \pi ^+ \pi ^- $ candidates. The fit projections are overlaid. |
Fig4a.pdf [28 KiB] HiDef png [271 KiB] Thumbnail [227 KiB] *.C file |
|
|
Fig4b.pdf [27 KiB] HiDef png [281 KiB] Thumbnail [235 KiB] *.C file |
|
|
|
Distribution of (left) $\Xi ^0_ c \pi ^- $ and (right) $\Lambda ^+_ c \pi ^- $ invariant mass for the combined Run 1 and Run 2 data sets, with extra PID selection requirements with respect to the samples shown in Figs. 1 and 2. The fit projections are overlaid. |
Fig5a.pdf [34 KiB] HiDef png [204 KiB] Thumbnail [144 KiB] *.C file |

|
|
Fig5b.pdf [34 KiB] HiDef png [174 KiB] Thumbnail [127 KiB] *.C file |

|
|
|
Animated gif made out of all figures. |
PAPER-2020-032.gif Thumbnail |

|
![HiDef png [222 KiB]](Directory_LHCb-PAPER-2020-032/hidef_Fig1a.png)
![HiDef png [286 KiB]](Directory_LHCb-PAPER-2020-032/hidef_Fig1b.png)
![HiDef png [193 KiB]](Directory_LHCb-PAPER-2020-032/hidef_Fig2a.png)
![HiDef png [216 KiB]](Directory_LHCb-PAPER-2020-032/hidef_Fig2b.png)
![HiDef png [242 KiB]](Directory_LHCb-PAPER-2020-032/hidef_Fig3a.png)
![HiDef png [178 KiB]](Directory_LHCb-PAPER-2020-032/hidef_Fig3b.png)
![HiDef png [252 KiB]](Directory_LHCb-PAPER-2020-032/hidef_Fig3c.png)
![HiDef png [181 KiB]](Directory_LHCb-PAPER-2020-032/hidef_Fig3d.png)
![HiDef png [271 KiB]](Directory_LHCb-PAPER-2020-032/hidef_Fig4a.png)
![HiDef png [281 KiB]](Directory_LHCb-PAPER-2020-032/hidef_Fig4b.png)
![HiDef png [204 KiB]](Directory_LHCb-PAPER-2020-032/hidef_Fig5a.png)
![HiDef png [174 KiB]](Directory_LHCb-PAPER-2020-032/hidef_Fig5b.png)
Tables and captions
|
Signal yields of $\Xi ^-_ b $ and $\Xi _ b (6227)^{0} $ decays for the full data set after all selection requirements, and the corresponding Run 2 signal yields used for the measurement of $R(\Xi ^-_ b \pi ^+ )$ at 13 $\text{ Te V}$ . |
Table_1.pdf [65 KiB] HiDef png [33 KiB] Thumbnail [16 KiB] tex code |

|
|
Signal yields of $\Lambda ^0_ b $ and $\Xi _ b (6227)^{-} $ decays for the full data set after all selection requirements. |
Table_2.pdf [62 KiB] HiDef png [30 KiB] Thumbnail [15 KiB] tex code |

|
|
The fitted signal yields and masses of the $\Xi ^-_ b $ and $\Lambda ^0_ b $ peaks and the mass differences, $m_{\rm diff}\equiv m_{\rm fit}(\Xi ^-_ b )-m_{\rm fit}(\Lambda ^0_ b )$, for each center-of-mass energy and for the full data sample. For the last row, the known $\Lambda ^0_ b $ mass [62] is used. Uncertainties are statistical only. |
Table_3.pdf [67 KiB] HiDef png [62 KiB] Thumbnail [29 KiB] tex code |

|
|
Summary of systematic uncertainties on quantities related to the $\Xi _ b (6227)^{0} $ ($\delta m^{\rm peak}_{\pi}$, $\Gamma(\Xi _ b (6227)^{0} )$, $R(\Xi ^-_ b \pi ^+ )$), the $\Xi _ b (6227)^{-} $ ($\delta m^{\rm peak}_{K}$, $\Gamma(\Xi _ b (6227)^{-} $), and the $\Xi ^-_ b $ mass ($m_{\rm diff}$) measurements. The statistical uncertainties are also reported for comparison. |
Table_4.pdf [66 KiB] HiDef png [107 KiB] Thumbnail [50 KiB] tex code |

|
![HiDef png [33 KiB]](Directory_LHCb-PAPER-2020-032/hidef_Table_1.png)
![HiDef png [30 KiB]](Directory_LHCb-PAPER-2020-032/hidef_Table_2.png)
![HiDef png [62 KiB]](Directory_LHCb-PAPER-2020-032/hidef_Table_3.png)
![HiDef png [107 KiB]](Directory_LHCb-PAPER-2020-032/hidef_Table_4.png)
Supplementary Material [file]
| Supplementary material full pdf |
supple[..].pdf [184 KiB] |
|
|
This ZIP file contains supplemetary material for the publication LHCb-PAPER-2020-032. The files are: Supplementary.pdf : An overview of the extra figures *.pdf, *.png, *.eps : The figures in various formats |
Fig1a-S.pdf [23 KiB] HiDef png [241 KiB] Thumbnail [193 KiB] *C file |

|
|
Fig1b-S.pdf [23 KiB] HiDef png [245 KiB] Thumbnail [194 KiB] *C file |

|
|
|
Fig2a-S.pdf [18 KiB] HiDef png [211 KiB] Thumbnail [166 KiB] *C file |

|
|
|
Fig2b-S.pdf [18 KiB] HiDef png [215 KiB] Thumbnail [169 KiB] *C file |
|
|
|
Fig3a-S.pdf [18 KiB] HiDef png [231 KiB] Thumbnail [178 KiB] *C file |
|
|
|
Fig3b-S.pdf [18 KiB] HiDef png [246 KiB] Thumbnail [191 KiB] *C file |
|
|
|
Fig4-S.pdf [15 KiB] HiDef png [233 KiB] Thumbnail [127 KiB] *C file |
|
![HiDef png [241 KiB]](Directory_LHCb-PAPER-2020-032/supplementary/hidef_Fig1a-S.png)
![HiDef png [245 KiB]](Directory_LHCb-PAPER-2020-032/supplementary/hidef_Fig1b-S.png)
![HiDef png [211 KiB]](Directory_LHCb-PAPER-2020-032/supplementary/hidef_Fig2a-S.png)
![HiDef png [215 KiB]](Directory_LHCb-PAPER-2020-032/supplementary/hidef_Fig2b-S.png)
![HiDef png [231 KiB]](Directory_LHCb-PAPER-2020-032/supplementary/hidef_Fig3a-S.png)
![HiDef png [246 KiB]](Directory_LHCb-PAPER-2020-032/supplementary/hidef_Fig3b-S.png)
![HiDef png [233 KiB]](Directory_LHCb-PAPER-2020-032/supplementary/hidef_Fig4-S.png)
Created on 26 April 2024.