Information
LHCb-PAPER-2020-033
CERN-EP-2020-204
arXiv:2011.06847 [PDF]
(Submitted on 13 Nov 2020)
Chin. Phys. C45 (2021) 043001
Inspire 1830226
Tools
Abstract
A search for the rare decay $B^0 \rightarrow J/\psi \phi$ is performed using $pp$ collision data collected with the LHCb detector at centre-of-mass energies of 7, 8 and 13 TeV, corresponding to an integrated luminosity of 9 ${\rm fb}^{-1}$. No significant signal of the decay is observed and an upper limit of $1.1 \times 10^{-7}$ at 90 confidence level is set on the branching fraction.
Figures and captions
|
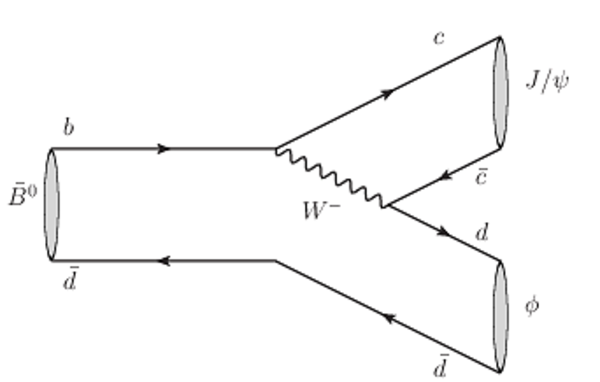
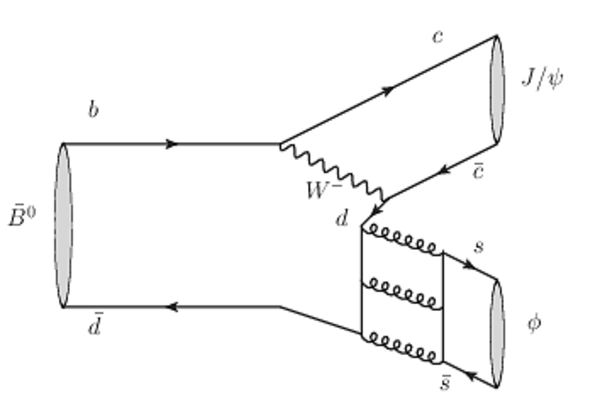
Feynman diagrams for the decay $ B ^0 \rightarrow { J \mskip -3mu/\mskip -2mu\psi } \phi$ via (a) $\omega-\phi$ mixing and (b) tri-gluon fusion. |
Fig1a.pdf [14 KiB] HiDef png [165 KiB] Thumbnail [102 KiB] *.C file |
|
|
Fig1b.pdf [15 KiB] HiDef png [204 KiB] Thumbnail [121 KiB] *.C file |
|
|
|
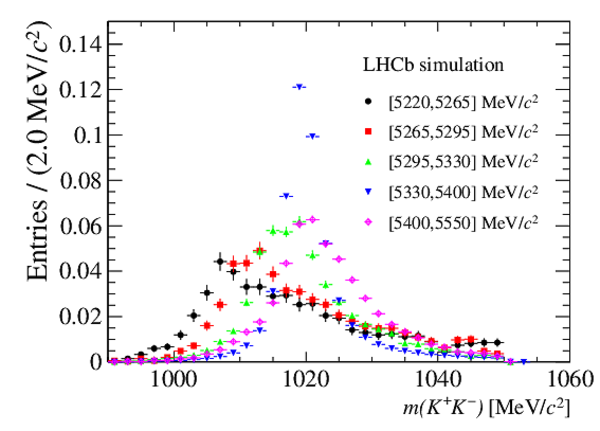
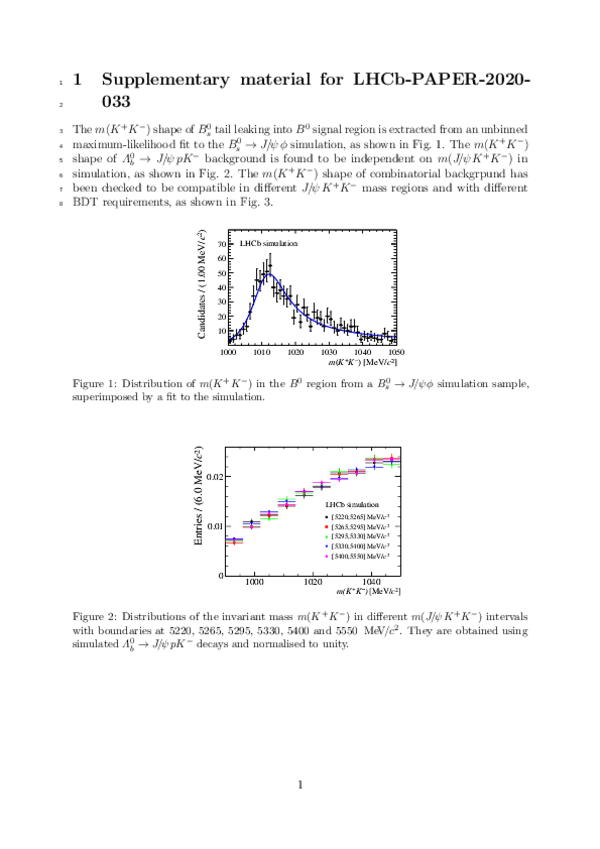
Distributions of the invariant mass $m( K ^+ K ^- )$ in different $m( { J \mskip -3mu/\mskip -2mu\psi } K ^+ K ^- )$ intervals with boundaries at 5220, 5265, 5295, 5330, 5400 and 5550 $\text{ Me V /}c^2$ . They are obtained using simulated $ B ^0_ s \rightarrow { J \mskip -3mu/\mskip -2mu\psi } \phi$ decays and normalised to unity. |
Fig2.pdf [21 KiB] HiDef png [251 KiB] Thumbnail [214 KiB] *.C file |
|
|
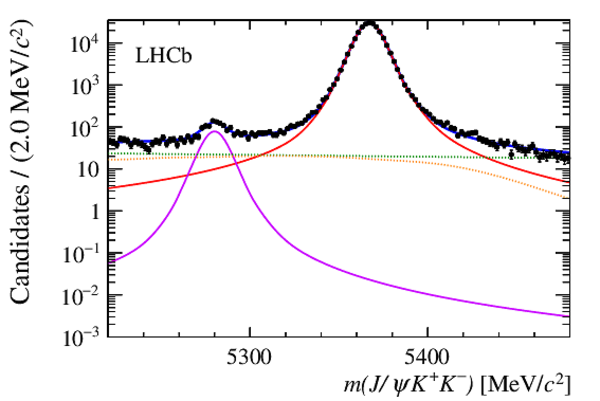
The distributions of $m( { J \mskip -3mu/\mskip -2mu\psi } K ^+ K ^- )$, superimposed by the fit results, for (left) Run 1 and (right) Run 2 data samples, respectively. The top row shows the full $ B ^0_ s $ signals in logarithmic scale while the bottom row is presented in a reduced vertical range to make the $ B ^0 $ peaks visible. The violet (red) solid lines represent the $B^{0}_{(s)}\rightarrow { J \mskip -3mu/\mskip -2mu\psi } K ^+ K ^- $ decays, the orange dotted lines show the $\Lambda ^0_ b $ background and the green dotted lines show the combinatorial background. |
Fig3a.pdf [42 KiB] HiDef png [259 KiB] Thumbnail [190 KiB] *.C file |

|
|
Fig3b.pdf [43 KiB] HiDef png [233 KiB] Thumbnail [171 KiB] *.C file |
|
|
|
Fig3c.pdf [37 KiB] HiDef png [304 KiB] Thumbnail [221 KiB] *.C file |

|
|
|
Fig3d.pdf [38 KiB] HiDef png [305 KiB] Thumbnail [225 KiB] *.C file |

|
|
|
Distribution of $m( K ^+ K ^- )$ in a $\Lambda ^0_ b \rightarrow { J \mskip -3mu/\mskip -2mu\psi } {p} K ^- $ simulation sample superimposed with a fit to a polynomial function. |
Fig4.pdf [32 KiB] HiDef png [176 KiB] Thumbnail [153 KiB] *.C file |

|
|
$m( K ^+ K ^- )$ distributions of the enhanced combinatorial background in the (left) Run 1 and (right) Run 2 data samples. The $ B ^0_ s \rightarrow { J \mskip -3mu/\mskip -2mu\psi } \phi$ and $\Lambda ^0_ b \rightarrow { J \mskip -3mu/\mskip -2mu\psi } {p} K ^- $ backgrounds are subtracted by injecting simulated events with negative weights. |
Fig5a.pdf [20 KiB] HiDef png [224 KiB] Thumbnail [187 KiB] *.C file |

|
|
Fig5b.pdf [20 KiB] HiDef png [212 KiB] Thumbnail [174 KiB] *.C file |

|
|
|
Distributions in the (top) $ B ^0_ s $ and (bottom) $ B ^0$ $m( K ^+ K ^- )$ regions, superimposed by the fit results. The left and right columns are shown using the Run 1 and Run 2 data samples, respectively. The violet (red) solid lines are $B^{0}_{(s)}\rightarrow { J \mskip -3mu/\mskip -2mu\psi } \phi$ decays, violet (red) dashed lines are non-$\phi$ $B_{(s)}^{0}\rightarrow { J \mskip -3mu/\mskip -2mu\psi } K ^+ K ^- $ signal, green dotted lines are the combinatorial background component and the orange dotted lines are the $\Lambda ^0_ b $ background component. |
Fig6a.pdf [37 KiB] HiDef png [266 KiB] Thumbnail [210 KiB] *.C file |

|
|
Fig6b.pdf [37 KiB] HiDef png [271 KiB] Thumbnail [215 KiB] *.C file |

|
|
|
Fig6c.pdf [18 KiB] HiDef png [246 KiB] Thumbnail [185 KiB] *.C file |

|
|
|
Fig6d.pdf [21 KiB] HiDef png [270 KiB] Thumbnail [202 KiB] *.C file |

|
|
|
Smeared profile likelihood ratio curve shown as the blue solid line, and the 90% confidence interval indicated by the red area. |
Fig7.pdf [60 KiB] HiDef png [140 KiB] Thumbnail [102 KiB] *.C file |

|
|
Animated gif made out of all figures. |
PAPER-2020-033.gif Thumbnail |

|
Tables and captions
|
Measured yields of all contributions from the fit to $ { J \mskip -3mu/\mskip -2mu\psi } K ^+ K ^- $ mass distribution, showing the results for the full mass range and for the $ B ^0_ s $ and $ B ^0$ regions. |
Table_1.pdf [67 KiB] HiDef png [19 KiB] Thumbnail [7 KiB] tex code |

|
|
Systematic uncertainties on $\mathcal{B}( B ^0 \rightarrow { J \mskip -3mu/\mskip -2mu\psi } \phi)$ for multiplicative and additive sources. |
Table_2.pdf [94 KiB] HiDef png [105 KiB] Thumbnail [46 KiB] tex code |

|
Supplementary Material [file]


![HiDef png [165 KiB]](Directory_LHCb-PAPER-2020-033/hidef_Fig1a.png)
![HiDef png [204 KiB]](Directory_LHCb-PAPER-2020-033/hidef_Fig1b.png)
![HiDef png [251 KiB]](Directory_LHCb-PAPER-2020-033/hidef_Fig2.png)
![HiDef png [259 KiB]](Directory_LHCb-PAPER-2020-033/hidef_Fig3a.png)
![HiDef png [233 KiB]](Directory_LHCb-PAPER-2020-033/hidef_Fig3b.png)
![HiDef png [304 KiB]](Directory_LHCb-PAPER-2020-033/hidef_Fig3c.png)
![HiDef png [305 KiB]](Directory_LHCb-PAPER-2020-033/hidef_Fig3d.png)
![HiDef png [176 KiB]](Directory_LHCb-PAPER-2020-033/hidef_Fig4.png)
![HiDef png [224 KiB]](Directory_LHCb-PAPER-2020-033/hidef_Fig5a.png)
![HiDef png [212 KiB]](Directory_LHCb-PAPER-2020-033/hidef_Fig5b.png)
![HiDef png [266 KiB]](Directory_LHCb-PAPER-2020-033/hidef_Fig6a.png)
![HiDef png [271 KiB]](Directory_LHCb-PAPER-2020-033/hidef_Fig6b.png)
![HiDef png [246 KiB]](Directory_LHCb-PAPER-2020-033/hidef_Fig6c.png)
![HiDef png [270 KiB]](Directory_LHCb-PAPER-2020-033/hidef_Fig6d.png)
![HiDef png [140 KiB]](Directory_LHCb-PAPER-2020-033/hidef_Fig7.png)
![HiDef png [19 KiB]](Directory_LHCb-PAPER-2020-033/hidef_Table_1.png)
![HiDef png [105 KiB]](Directory_LHCb-PAPER-2020-033/hidef_Table_2.png)
![HiDef png [193 KiB]](Directory_LHCb-PAPER-2020-033/supplementary/hidef_Fig1.png)
![HiDef png [179 KiB]](Directory_LHCb-PAPER-2020-033/supplementary/hidef_Fig2.png)
![HiDef png [243 KiB]](Directory_LHCb-PAPER-2020-033/supplementary/hidef_Fig3a.png)
![HiDef png [268 KiB]](Directory_LHCb-PAPER-2020-033/supplementary/hidef_Fig3b.png)
Created on 27 April 2024.