Measurement of $C P$ observables in $B^\pm \to D^{(*)} K^\pm$ and $B^\pm \to D^{(*)} \pi^\pm$ decays using two-body $D$ final states
[to restricted-access page]Information
LHCb-PAPER-2020-036
CERN-EP-2020-225
arXiv:2012.09903 [PDF]
(Submitted on 17 Dec 2020)
JHEP 04 (2021) 081
Inspire 1838001
Tools
Abstract
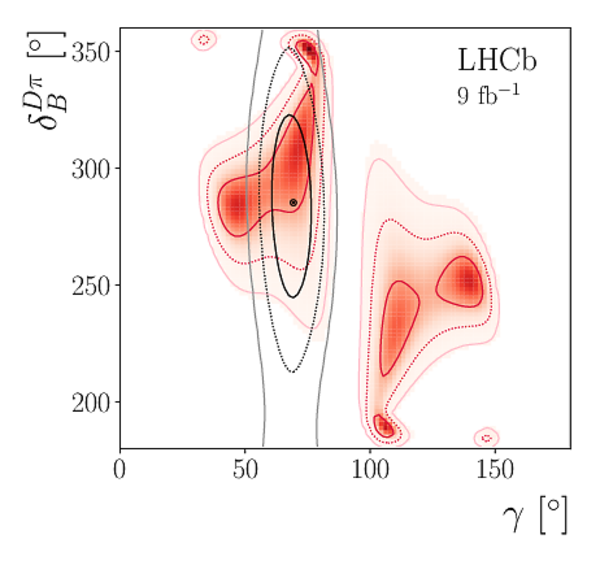
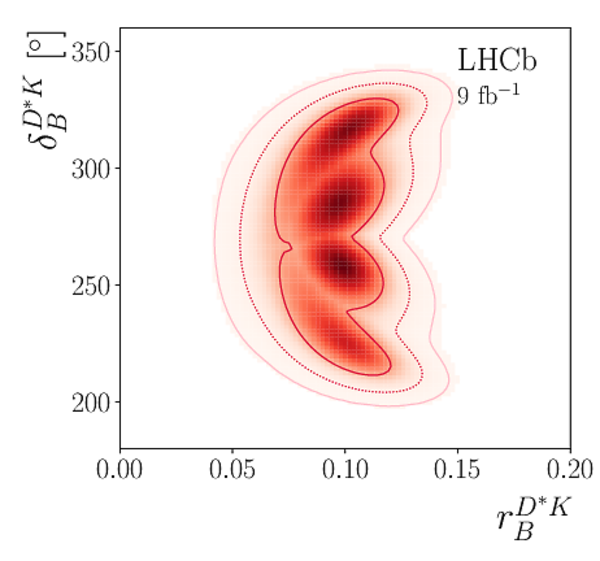
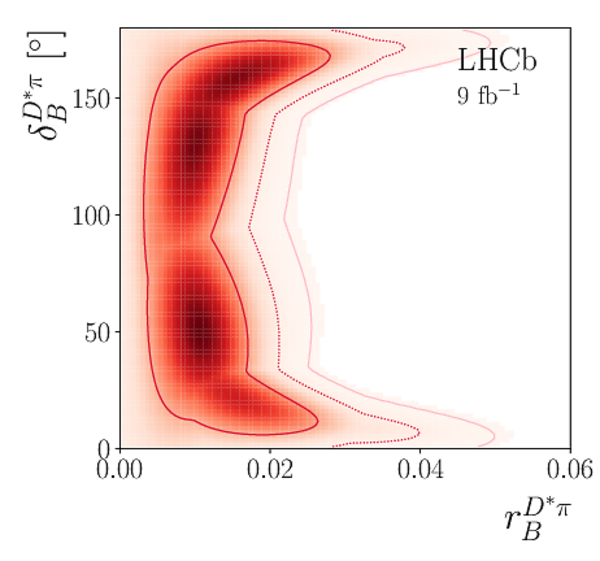
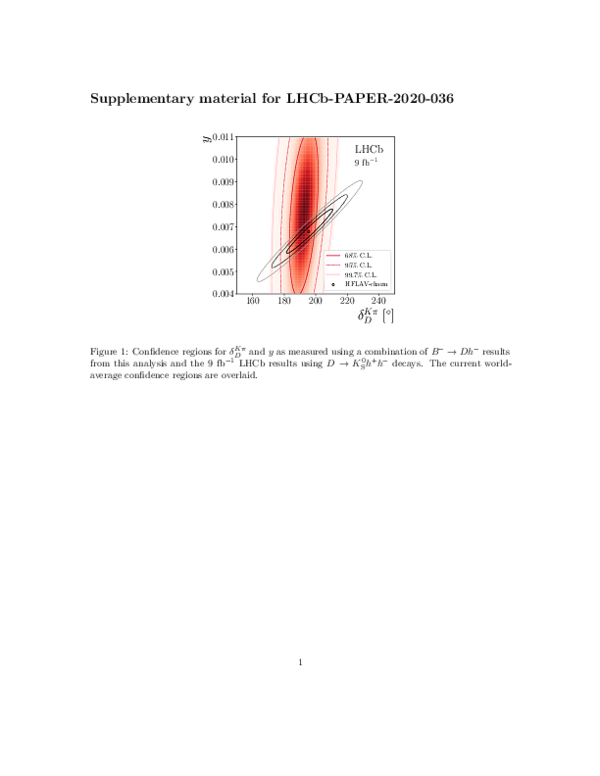
Measurements of $C P$ observables in $B^\pm \rightarrow D^{(*)} K^\pm$ and $B^\pm \rightarrow D^{(*)} \pi^\pm$ decays are presented, where $D^{(*)}$ indicates a neutral $D$ or $D^*$ meson that is an admixture of meson and anti-meson states. Decays of the $D^*$ meson to the $D\pi^0$ and $D\gamma$ final states are partially reconstructed without inclusion of the neutral pion or photon. Decays of the $D$ meson are reconstructed in the $K^\pm \pi^\mp$, $K^+K^-$, and $\pi^+\pi^-$ final states. The analysis uses a sample of charged $B$ mesons produced in proton-proton collisions and collected with the LHCb experiment, corresponding to integrated luminosities of 2.0, 1.0, and 5.7 fb$^{-1}$ taken at centre-of-mass energies of 7, 8, and 13 TeV, respectively. The measurements of partially reconstructed $B^\pm \to D^* K^\pm$ and $B^\pm \to D^* \pi^\pm$ with $D \to K^\mp \pi^\pm$ decays are the first of their kind, and a first observation of the $B^\pm \to (D \pi^0)_{D^*} \pi^\pm$ decay is made with a significance of 6.1 standard deviations. All $C P$ observables are measured with world-best precision, and in combination with other LHCb results will provide strong constraints on the CKM angle $\gamma$.
Figures and captions


![HiDef png [121 KiB]](Directory_LHCb-PAPER-2020-036/hidef_Fig1.png)
![HiDef png [218 KiB]](Directory_LHCb-PAPER-2020-036/hidef_Fig2a.png)
![HiDef png [221 KiB]](Directory_LHCb-PAPER-2020-036/hidef_Fig2b.png)
![HiDef png [228 KiB]](Directory_LHCb-PAPER-2020-036/hidef_Fig2c.png)
![HiDef png [231 KiB]](Directory_LHCb-PAPER-2020-036/hidef_Fig2d.png)
![HiDef png [299 KiB]](Directory_LHCb-PAPER-2020-036/hidef_Fig3a.png)
![HiDef png [318 KiB]](Directory_LHCb-PAPER-2020-036/hidef_Fig3b.png)
![HiDef png [278 KiB]](Directory_LHCb-PAPER-2020-036/hidef_Fig3c.png)
![HiDef png [274 KiB]](Directory_LHCb-PAPER-2020-036/hidef_Fig3d.png)
![HiDef png [272 KiB]](Directory_LHCb-PAPER-2020-036/hidef_Fig4a.png)
![HiDef png [268 KiB]](Directory_LHCb-PAPER-2020-036/hidef_Fig4b.png)
![HiDef png [241 KiB]](Directory_LHCb-PAPER-2020-036/hidef_Fig4c.png)
![HiDef png [242 KiB]](Directory_LHCb-PAPER-2020-036/hidef_Fig4d.png)
![HiDef png [278 KiB]](Directory_LHCb-PAPER-2020-036/hidef_Fig5a.png)
![HiDef png [277 KiB]](Directory_LHCb-PAPER-2020-036/hidef_Fig5b.png)
![HiDef png [230 KiB]](Directory_LHCb-PAPER-2020-036/hidef_Fig5c.png)
![HiDef png [230 KiB]](Directory_LHCb-PAPER-2020-036/hidef_Fig5d.png)
![HiDef png [378 KiB]](Directory_LHCb-PAPER-2020-036/hidef_Fig6a.png)
![HiDef png [553 KiB]](Directory_LHCb-PAPER-2020-036/hidef_Fig6b.png)
![HiDef png [726 KiB]](Directory_LHCb-PAPER-2020-036/hidef_Fig6c.png)
![HiDef png [678 KiB]](Directory_LHCb-PAPER-2020-036/hidef_Fig6d.png)
![HiDef png [694 KiB]](Directory_LHCb-PAPER-2020-036/hidef_Fig6e.png)
![HiDef png [667 KiB]](Directory_LHCb-PAPER-2020-036/hidef_Fig6f.png)
![HiDef png [1 MiB]](Directory_LHCb-PAPER-2020-036/hidef_Fig6g.png)
![HiDef png [837 KiB]](Directory_LHCb-PAPER-2020-036/hidef_Fig6h.png)
Tables and captions
|
The nine $ C P$ observables measured using $ B ^- \rightarrow D h^-$ decays, defined in terms of $B$ meson decay widths. Where indicated, $h^+h^-$ represents an average of the $D \rightarrow K ^+ K ^- $ and $D \rightarrow \pi ^+ \pi ^- $ modes. The $R$ observables represent partial width ratios and double ratios. The $A$ observables represent $ C P$ asymmetries. |
Table_1.pdf [89 KiB] HiDef png [114 KiB] Thumbnail [61 KiB] tex code |

|
|
The 19 $ C P$ observables measured using $ B ^- \rightarrow D^* h^-$ decays, defined in terms of $B$ meson decay widths. Where indicated, $h^+h^-$ represents an average of the $D \rightarrow K ^+ K ^- $ and $D \rightarrow \pi ^+ \pi ^- $ modes. The $R$ observables represent partial width ratios and double ratios. The $A$ observables represent $ C P$ asymmetries. The $R_{K/\pi}^{K\pi,\gamma /\pi ^0 }$ observable is an average over the $D^* \rightarrow D \pi ^0 $ and $D^* \rightarrow D\gamma $ modes. |
Table_2.pdf [91 KiB] HiDef png [240 KiB] Thumbnail [124 KiB] tex code |

|
|
Yields for the 24 signal modes. |
Table_3.pdf [73 KiB] HiDef png [180 KiB] Thumbnail [88 KiB] tex code |

|
|
Table_4.pdf [91 KiB] HiDef png [51 KiB] Thumbnail [19 KiB] tex code |

|
|
|
Statistical correlation matrix for $ B ^\pm \rightarrow D h^\pm$ observables. |
Table_5.pdf [62 KiB] HiDef png [52 KiB] Thumbnail [24 KiB] tex code |

|
|
Systematic correlation matrix for $ B ^\pm \rightarrow D h^\pm$ observables. |
Table_6.pdf [63 KiB] HiDef png [52 KiB] Thumbnail [24 KiB] tex code |

|
|
Statistical correlation matrix for $ B ^\pm \rightarrow D^* h^\pm$ observables. |
Table_7.pdf [43 KiB] HiDef png [54 KiB] Thumbnail [20 KiB] tex code |

|
|
Systematic correlation matrix for $ B ^\pm \rightarrow D^* h^\pm$ observables. |
Table_8.pdf [44 KiB] HiDef png [55 KiB] Thumbnail [21 KiB] tex code |

|
![HiDef png [114 KiB]](Directory_LHCb-PAPER-2020-036/hidef_Table_1.png)
![HiDef png [240 KiB]](Directory_LHCb-PAPER-2020-036/hidef_Table_2.png)
![HiDef png [180 KiB]](Directory_LHCb-PAPER-2020-036/hidef_Table_3.png)
![HiDef png [51 KiB]](Directory_LHCb-PAPER-2020-036/hidef_Table_4.png)
![HiDef png [52 KiB]](Directory_LHCb-PAPER-2020-036/hidef_Table_5.png)
![HiDef png [52 KiB]](Directory_LHCb-PAPER-2020-036/hidef_Table_6.png)
![HiDef png [54 KiB]](Directory_LHCb-PAPER-2020-036/hidef_Table_7.png)
![HiDef png [55 KiB]](Directory_LHCb-PAPER-2020-036/hidef_Table_8.png)
Supplementary Material [file]
| Supplementary material full pdf |
supple[..].pdf [312 KiB] |
|
|
Fig1-s[..].pdf [301 KiB] HiDef png [834 KiB] Thumbnail [503 KiB] *C file |
|
![HiDef png [834 KiB]](Directory_LHCb-PAPER-2020-036/supplementary/hidef_Fig1-supplementary.png)
Created on 02 May 2024.