Information
LHCb-PAPER-2020-037
CERN-EP-2020-230
arXiv:2012.11341 [PDF]
(Submitted on 21 Dec 2020)
JHEP 03 (2021) 099
Inspire 1837607
Tools
Abstract
A search for the $B^0_s \rightarrow D^{*\pm} D^\mp$ decay is performed using proton-proton collision data at centre-of-mass energies of $7$, $8$ and $13 \text{TeV}$ collected by the LHCb experiment, corresponding to an integrated luminosity of $9 \text{fb}^{-1}$. The decay is observed with a high significance and its branching fraction relative to the $B^0 \rightarrow D^{*\pm} D^\mp$ decay is measured to be \begin{align*} \frac{\mathcal{B}(B_s^0 \rightarrow D^{\ast \pm} D^{\mp}) }{\mathcal{B}(B^0 \rightarrow D^{\ast \pm} D^{\mp}) } = 0.137 \pm 0.017 \pm 0.002 \pm 0.006 , \end{align*} where the first uncertainty is statistical, the second systematic and the third is due to the uncertainty on the ratio of the $B_s^0$ and $B^0$ hadronisation fractions.
Figures and captions
|
(Left) Tree-level and (right) penguin diagrams contributing to $ B ^0 \rightarrow D _{(s)}^{(*)\pm} D ^{(*)\mp}$ and $ B ^0_ s \rightarrow D _{(s)}^{(*)\pm} D _{s}^{(*)\mp}$ decays. |
Fig1a.pdf [33 KiB] HiDef png [37 KiB] Thumbnail [18 KiB] *.C file |

|
|
Fig1b.pdf [35 KiB] HiDef png [45 KiB] Thumbnail [21 KiB] *.C file |

|
|
|
(Left) $ W $ -exchange and (right) penguin-annihilation diagrams contributing to $ B _{(s)}^{0} \rightarrow D _{(s)}^{(*)+} D _{(s)}^{(*)-}$ decays. |
Fig2a.pdf [33 KiB] HiDef png [37 KiB] Thumbnail [18 KiB] *.C file |

|
|
Fig2b.pdf [39 KiB] HiDef png [46 KiB] Thumbnail [22 KiB] *.C file |

|
|
|
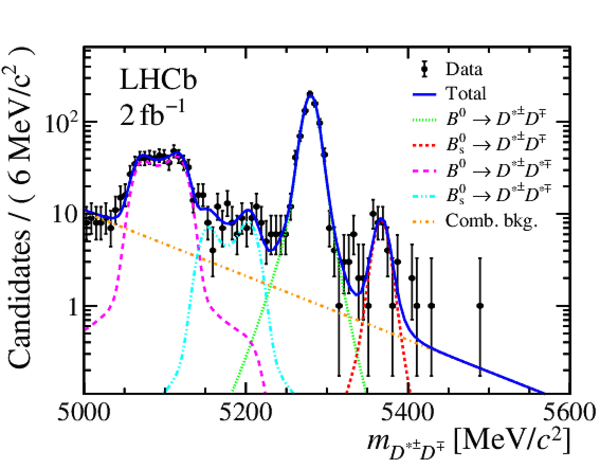
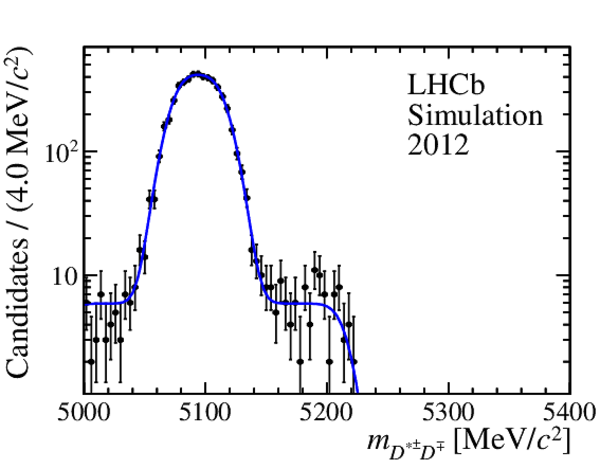
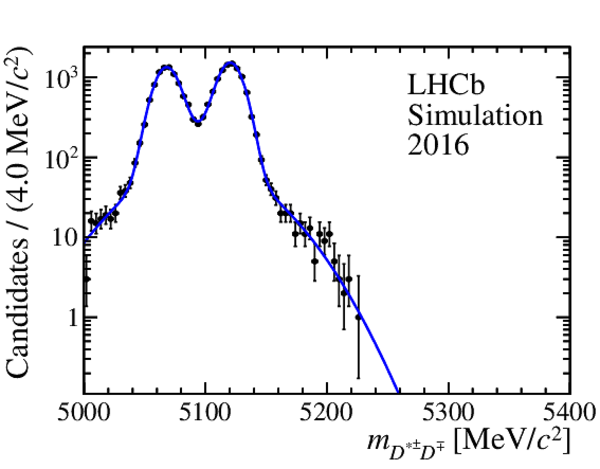
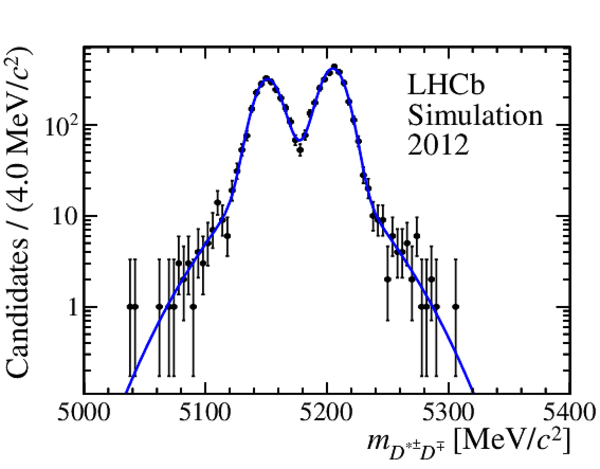
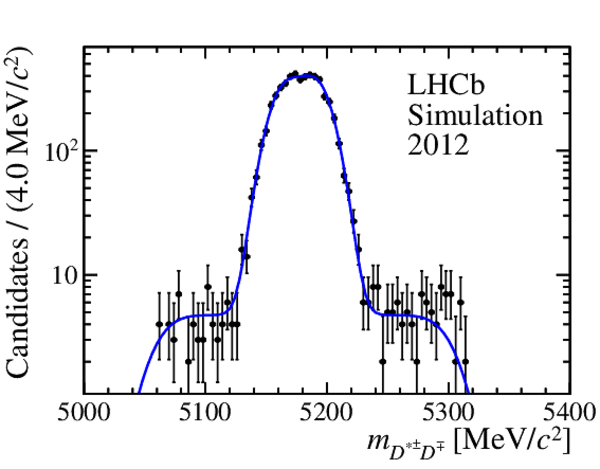
The $ D ^{*\pm}$ $ D ^\mp$ mass distributions for (top left) 2011--2012, (top right) 2015--2016, (bottom left) 2017--2018 data in logarithmic scale, and (bottom right) the combined data sample in linear scale. The total fit projection is shown as the blue solid line. The green dotted and the red dashed lines correspond to the signal contributions for the $ B ^0$ and $ B ^0_ s $ decays, respectively. The orange dash-dotted line corresponds to the combinatorial background contribution. The $ B ^0 \rightarrow D ^{*\pm} D ^{*\mp} $ and $ B ^0_ s \rightarrow D ^{*\pm} D ^{*\mp} $ background components are described by the magenta long-dashed and the cyan long-dashed-two-dotted lines. |
Fig3a.pdf [24 KiB] HiDef png [312 KiB] Thumbnail [251 KiB] *.C file |

|
|
Fig3b.pdf [25 KiB] HiDef png [308 KiB] Thumbnail [249 KiB] *.C file |
|
|
|
Fig3c.pdf [25 KiB] HiDef png [310 KiB] Thumbnail [255 KiB] *.C file |

|
|
|
Fig3d.pdf [26 KiB] HiDef png [259 KiB] Thumbnail [202 KiB] *.C file |

|
|
|
Animated gif made out of all figures. |
PAPER-2020-037.gif Thumbnail |

|
Tables and captions
|
Systematic uncertainties on $\mathcal{B} ( B ^0_ s \rightarrow D ^{*\pm} D ^\mp )/\mathcal{B} ( B ^0 \rightarrow D ^{*\pm} D ^\mp )$. The systematic uncertainty is given relative to the measured value. |
Table_1.pdf [49 KiB] HiDef png [46 KiB] Thumbnail [20 KiB] tex code |

|
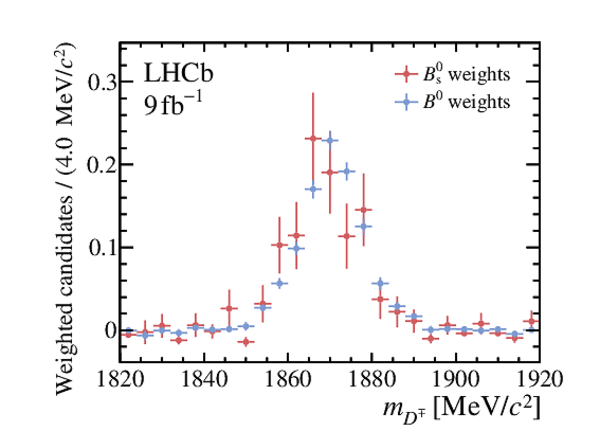
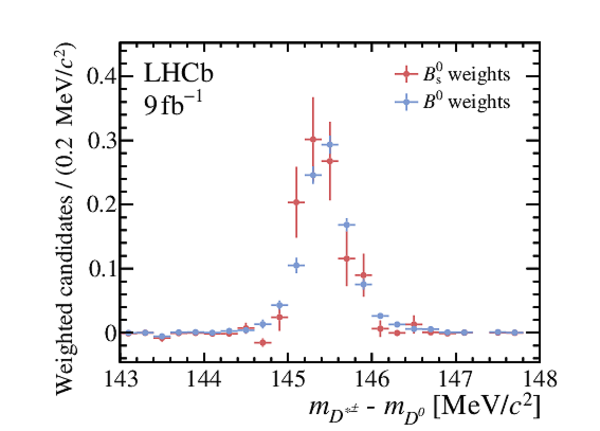
Supplementary Material [file]


![HiDef png [37 KiB]](Directory_LHCb-PAPER-2020-037/hidef_Fig1a.png)
![HiDef png [45 KiB]](Directory_LHCb-PAPER-2020-037/hidef_Fig1b.png)
![HiDef png [37 KiB]](Directory_LHCb-PAPER-2020-037/hidef_Fig2a.png)
![HiDef png [46 KiB]](Directory_LHCb-PAPER-2020-037/hidef_Fig2b.png)
![HiDef png [312 KiB]](Directory_LHCb-PAPER-2020-037/hidef_Fig3a.png)
![HiDef png [308 KiB]](Directory_LHCb-PAPER-2020-037/hidef_Fig3b.png)
![HiDef png [310 KiB]](Directory_LHCb-PAPER-2020-037/hidef_Fig3c.png)
![HiDef png [259 KiB]](Directory_LHCb-PAPER-2020-037/hidef_Fig3d.png)
![HiDef png [46 KiB]](Directory_LHCb-PAPER-2020-037/hidef_Table_1.png)
![HiDef png [221 KiB]](Directory_LHCb-PAPER-2020-037/supplementary/hidef_Fig1a-S.png)
![HiDef png [226 KiB]](Directory_LHCb-PAPER-2020-037/supplementary/hidef_Fig1b-S.png)
![HiDef png [215 KiB]](Directory_LHCb-PAPER-2020-037/supplementary/hidef_Fig1c-S.png)
![HiDef png [189 KiB]](Directory_LHCb-PAPER-2020-037/supplementary/hidef_Fig2a-S.png)
![HiDef png [188 KiB]](Directory_LHCb-PAPER-2020-037/supplementary/hidef_Fig2b-S.png)
![HiDef png [186 KiB]](Directory_LHCb-PAPER-2020-037/supplementary/hidef_Fig2c-S.png)
![HiDef png [184 KiB]](Directory_LHCb-PAPER-2020-037/supplementary/hidef_Fig2d-S.png)
![HiDef png [202 KiB]](Directory_LHCb-PAPER-2020-037/supplementary/hidef_Fig3a-S.png)
![HiDef png [197 KiB]](Directory_LHCb-PAPER-2020-037/supplementary/hidef_Fig3b-S.png)
![HiDef png [211 KiB]](Directory_LHCb-PAPER-2020-037/supplementary/hidef_Fig3c-S.png)
![HiDef png [206 KiB]](Directory_LHCb-PAPER-2020-037/supplementary/hidef_Fig3d-S.png)
![HiDef png [193 KiB]](Directory_LHCb-PAPER-2020-037/supplementary/hidef_Fig4a-S.png)
![HiDef png [187 KiB]](Directory_LHCb-PAPER-2020-037/supplementary/hidef_Fig4b-S.png)
![HiDef png [172 KiB]](Directory_LHCb-PAPER-2020-037/supplementary/hidef_Fig4c-S.png)
Created on 02 May 2024.