Measurement of prompt-production cross-section ratio $\sigma(\chi_{c2})/\sigma(\chi_{c1})$ in $p$Pb collisions at $\sqrt{s_{NN}}$ = 8.16 TeV
[to restricted-access page]Information
LHCb-PAPER-2020-048
CERN-EP-2021-024
arXiv:2103.07349 [PDF]
(Submitted on 12 Mar 2021)
Phys. Rev. C103 (2021) 064905
Inspire 1851454
Tools
Abstract
This Letter reports the first measurement of prompt $\chi_{c1}$ and $\chi_{c2}$ charmonium production in nuclear collisions at Large Hadron Collider energies. The cross-section ratio $\sigma(\chi_{c2}) / \sigma(\chi_{c1})$ is measured in $p$Pb collisions at $\sqrt{s_{NN}}$ = 8.16 TeV, collected with the LHCb experiment. The $\chi_{c1,2}$ states are reconstructed via their decay to a $\rm{J}/\psi$ meson, subsequently decaying into a pair of oppositely charged muons, and a photon, which is reconstructed in the calorimeter or via its conversion in the detector material. The cross-section ratio is consistent with unity in the two considered rapidity regions. Comparison with a corresponding cross-section ratio previously measured by the LHCb collaboration in $pp$ collisions suggests that $\chi_{c1}$ and $\chi_{c2}$ states are similarly affected by nuclear effects occurring in $p$Pb collisions.
Figures and captions
|
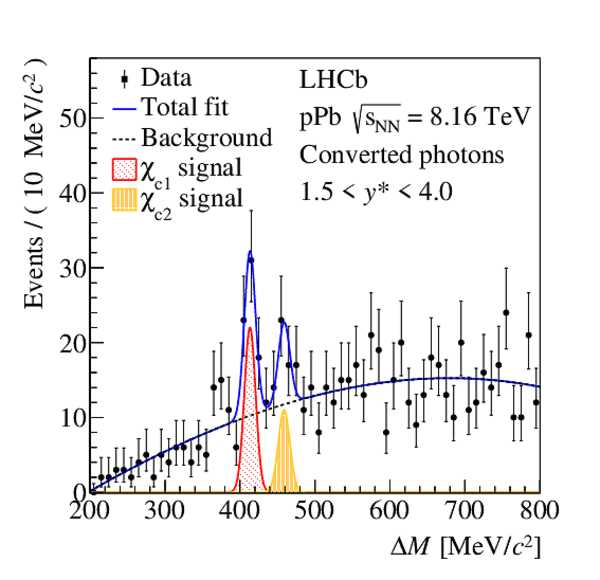
Mass-difference spectra of converted $\chi _{ c 1,2}$ candidates in forward (left) and backward (right) configuration data. The data are superimposed with a fit (solid blue line) comprising $\chi _{ c 1}$ and $\chi _{ c 2}$ signals and combinatorial background (dashed black line). |
Fig1a.pdf [20 KiB] HiDef png [359 KiB] Thumbnail [264 KiB] *.C file |
|
|
Fig1b.pdf [20 KiB] HiDef png [347 KiB] Thumbnail [261 KiB] *.C file |

|
|
|
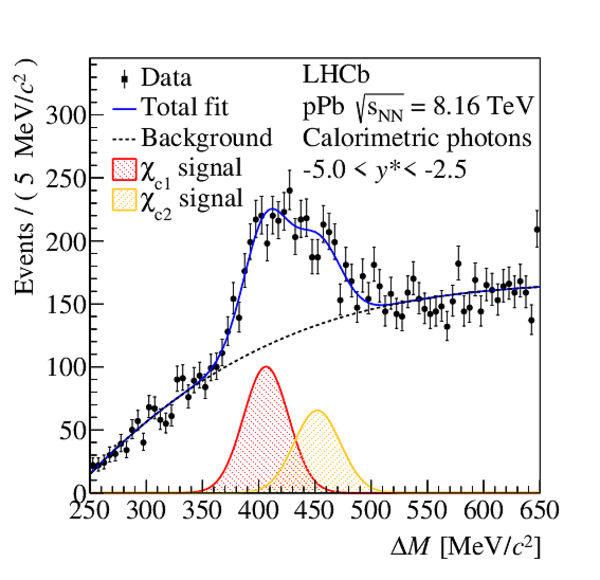
Mass-difference spectra of calorimetric $\chi _{ c 1,2}$ candidates in forward (left) and backward (right) data. The data are superimposed with a fit result (solid blue line) comprising $\chi _{ c 1} $ and $\chi _{ c 2} $ signals and combinatorial background (dashed black line). |
Fig2a.pdf [22 KiB] HiDef png [386 KiB] Thumbnail [312 KiB] *.C file |

|
|
Fig2b.pdf [22 KiB] HiDef png [382 KiB] Thumbnail [313 KiB] *.C file |
|
|
|
Cross-section ratio, $\sigma(\chi _{ c 2} ) / \sigma(\chi _{ c 1} )$ as a function of center-of-mass rapidity $y^*$, for the $\chi _{ c 2} $ and $\chi _{ c 1} $ promptly produced in { $ p$ }Pb collisions measured using converted photons (red circles) and calorimetric photons (blue squares). The error bars correspond to the total uncertainties. Blue points and vertical uncertainties are shifted horizontally to improve visibility. The { $ p$ }Pb data are compared with results of the converted sample in $ pp$ collisions at $\sqrt{s}$ = 7 TeV [16] (yellow triangles). |
Fig3.pdf [14 KiB] HiDef png [121 KiB] Thumbnail [109 KiB] *.C file |

|
|
Animated gif made out of all figures. |
PAPER-2020-048.gif Thumbnail |

|
![HiDef png [359 KiB]](Directory_LHCb-PAPER-2020-048/hidef_Fig1a.png)
![HiDef png [347 KiB]](Directory_LHCb-PAPER-2020-048/hidef_Fig1b.png)
![HiDef png [386 KiB]](Directory_LHCb-PAPER-2020-048/hidef_Fig2a.png)
![HiDef png [382 KiB]](Directory_LHCb-PAPER-2020-048/hidef_Fig2b.png)
![HiDef png [121 KiB]](Directory_LHCb-PAPER-2020-048/hidef_Fig3.png)
Tables and captions
|
Yields of $\chi _{ c 1}$ and $\chi _{ c 2}$ signals with statistical uncertainties and corresponding significance (given in standard deviations). |
Table_1.pdf [76 KiB] HiDef png [41 KiB] Thumbnail [18 KiB] tex code |

|
|
Statistical and systematic uncertainties on the cross-section ratio, $\sigma(\chi _{ c 2} ) / \sigma(\chi _{ c 1} )$. The total systematic uncertainty is also quoted. |
Table_2.pdf [56 KiB] HiDef png [92 KiB] Thumbnail [38 KiB] tex code |

|
![HiDef png [41 KiB]](Directory_LHCb-PAPER-2020-048/hidef_Table_1.png)
![HiDef png [92 KiB]](Directory_LHCb-PAPER-2020-048/hidef_Table_2.png)
Created on 27 April 2024.