Information
LHCb-PAPER-2021-003
CERN-EP-2021-037
arXiv:2103.04949 [PDF]
(Submitted on 08 Mar 2021)
JHEP 05 (2021) 95
Inspire 1850626
Tools
Abstract
The Cabibbo-suppressed decay $\Lambda_b^0\rightarrow\chi_{c1}p\pi^-$ is observed for the first time using data from proton-proton collisions corresponding to an integrated luminosity of 6fb$^{-1}$, collected with the LHCb detector at a centre-of-mass energy of 13TeV. Evidence for the $\Lambda_b^0\rightarrow\chi_{c2}p\pi^-$ decay is also found. Using the $\Lambda_b^0\rightarrow\chi_{c1}pK^-$ decay as normalisation channel, the ratios of branching fractions are measured to be $$\begin{array}{rcl} \frac{ \mathcal{B} (\Lambda_b^0\rightarrow\chi_{c1}p\pi^-)}{\mathcal{B} (\Lambda_b^0\rightarrow\chi_{c1}pK^-)} & = & (6.59 \pm 1.01 \pm 0.22 ) \times 10^{-2} , \frac{\mathcal{B} (\Lambda_b^0\rightarrow\chi_{c2}p\pi^-)}{\mathcal{B} (\Lambda_b^0\rightarrow\chi_{c1}p\pi^-)} & = & 0.95 \pm 0.30 \pm 0.04 \pm 0.04 , \frac{\mathcal{B} (\Lambda_b^0\rightarrow\chi_{c2}pK^-)}{\mathcal{B} (\Lambda_b^0\rightarrow\chi_{c1}pK^-)} & = & 1.06 \pm 0.05 \pm 0.04 \pm 0.04 ,\end{array}$$ where the first uncertainty is statistical, the second is systematic and the third is due to the uncertainties in the branching fractions of $\chi_{c1,2}\rightarrow J/\psi\gamma$ decays.
Figures and captions
|
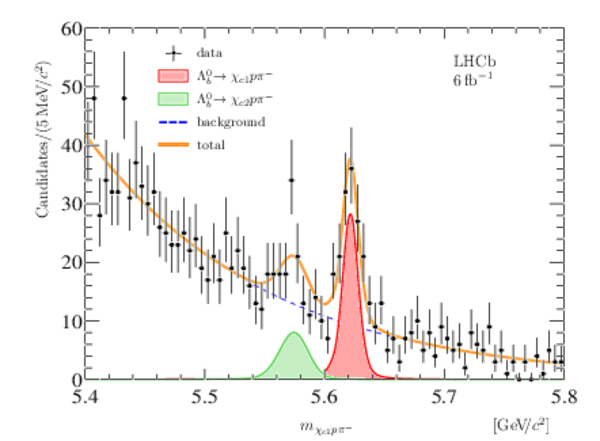
Mass distribution for selected $\Lambda ^0_ b \rightarrow \chi _{ c J } p \pi ^- $ candidates. A fit, described in the text, is overlaid. |
Fig_1.pdf [151 KiB] HiDef png [295 KiB] Thumbnail [244 KiB] *.C file tex code |
|
|
Mass distribution for selected $\Lambda ^0_ b \rightarrow \chi _{ c J } p K ^- $ candidates. A fit, described in the text, is overlaid. |
Fig_2.pdf [158 KiB] HiDef png [362 KiB] Thumbnail [257 KiB] *.C file tex code |

|
|
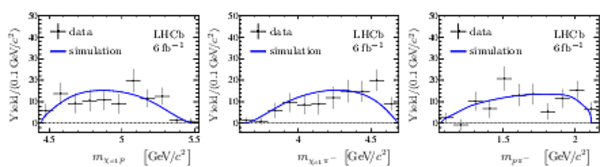
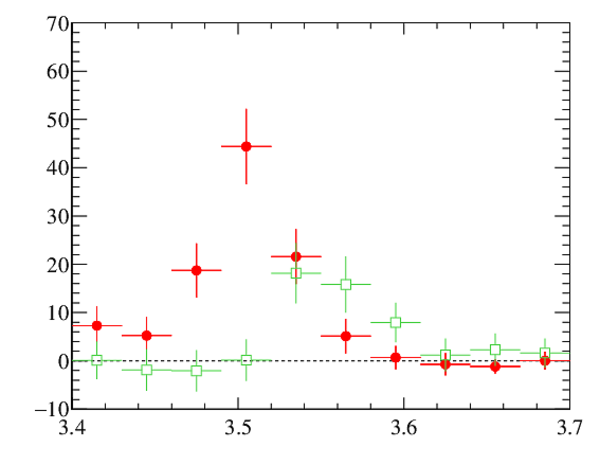
Background-subtracted mass distributions of the (left) $\chi _{ c 1} p $ , (centre) $\chi _{ c 1} \pi ^- $ and (right) $ p \pi ^- $ combinations in the $\Lambda ^0_ b \rightarrow \chi _{ c 1} p \pi ^- $ decay. Expectations from a phase space simulation are overlaid. |
Fig_3.pdf [140 KiB] HiDef png [148 KiB] Thumbnail [142 KiB] *.C file tex code |
|
|
Animated gif made out of all figures. |
PAPER-2021-003.gif Thumbnail |

|
Tables and captions
|
Signal yields, $N$, from the fits described in the text. The uncertainties are statistical only. |
Table_1.pdf [66 KiB] HiDef png [94 KiB] Thumbnail [39 KiB] tex code |

|
|
Relative systematic uncertainties (in %) in the ratios of branching fractions. The total uncertainty is obtained as the sum of individual components in quadrature. Empty cells correspond to cases where no uncertainty is applicable. |
Table_2.pdf [72 KiB] HiDef png [84 KiB] Thumbnail [39 KiB] tex code |

|
Supplementary Material [file]


![HiDef png [295 KiB]](Directory_LHCb-PAPER-2021-003/hidef_Fig_1.png)
![HiDef png [362 KiB]](Directory_LHCb-PAPER-2021-003/hidef_Fig_2.png)
![HiDef png [148 KiB]](Directory_LHCb-PAPER-2021-003/hidef_Fig_3.png)
![HiDef png [94 KiB]](Directory_LHCb-PAPER-2021-003/hidef_Table_1.png)
![HiDef png [84 KiB]](Directory_LHCb-PAPER-2021-003/hidef_Table_2.png)
![HiDef png [135 KiB]](Directory_LHCb-PAPER-2021-003/supplementary/hidef_Fig1a_supp.png)
![HiDef png [179 KiB]](Directory_LHCb-PAPER-2021-003/supplementary/hidef_Fig1b_supp.png)
![HiDef png [98 KiB]](Directory_LHCb-PAPER-2021-003/supplementary/hidef_Fig2a_supp.png)
![HiDef png [145 KiB]](Directory_LHCb-PAPER-2021-003/supplementary/hidef_Fig2b_supp.png)
![HiDef png [201 KiB]](Directory_LHCb-PAPER-2021-003/supplementary/hidef_Figure1_supp.png)
![HiDef png [202 KiB]](Directory_LHCb-PAPER-2021-003/supplementary/hidef_Figure2_supp.png)
![HiDef png [269 KiB]](Directory_LHCb-PAPER-2021-003/supplementary/hidef_lhcb-logo.png)
![Thumbnail [142 KiB]](Directory_LHCb-PAPER-2021-003/supplementary/thumbnail_lhcb-logo.png)
Created on 26 April 2024.