Information
LHCb-PAPER-2021-007
CERN-EP-2021-132
arXiv:2108.09284 [PDF]
(Submitted on 20 Aug 2021)
Phys. Rev. Lett. 128, (2022) 041801
Inspire 1908214
Tools
Abstract
Branching fraction and effective lifetime measurements of the rare decay $B^0_s\to\mu^+\mu^-$ and searches for the decays $B^0\to\mu^+\mu^-$ and $B^0_s\to\mu^+\mu^-\gamma$ are reported using proton-proton collision data collected with the LHCb detector at centre-of-mass energies of $7$ TeV, $8$ TeV and $13$ TeV, corresponding to a luminosity of $9$ fb$^{-1}$. The branching fraction ${\mathcal{B}}(B^0_s\to\mu^+\mu^-)=\left(3.09^{+0.46+0.15}_{-0.43-0.11}\right)\times 10^{-9}$ and the effective lifetime $\tau(B^0_s\to\mu^+\mu^-)=(2.07\pm 0.29\pm 0.03)$ are measured, where the first uncertainty is statistical and the second systematic. No significant signal for $B^0\to\mu^+\mu^-$ and $B^0_s\to\mu^+\mu^-\gamma$ decays is found and upper limits $\mathcal{B}(B^0\to\mu^+\mu^-)<2.6\times 10^{-10}$ and $\mathcal{B}(B^0_s\to\mu^+\mu^-\gamma)<2.0\times 10^{-9}$ at the 95 CL are determined, where the latter is limited to the range $m_{\mu\mu} > 4.9$ GeV$/c^2$. The results are in agreement with the Standard Model expectations.
Figures and captions
|
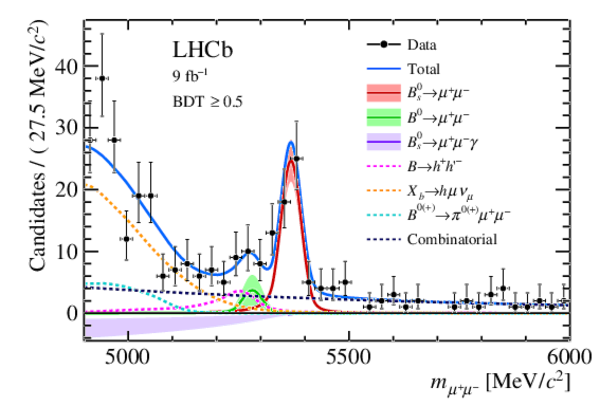
Mass distribution of the selected $ B _{( s )}^0 \rightarrow \mu ^+ \mu ^- $ candidates (black dots) with ${\rm BDT }>0.5$. The result of the fit is overlaid and the different components are detailed: $ B ^0_ s \rightarrow \mu ^+ \mu ^- $ (red solid line), $ B ^0 \rightarrow \mu ^+ \mu ^- $ (green solid line), $ B ^0_ s \rightarrow \mu ^+ \mu ^- \gamma $ (violet solid line), combinatorial background (blue dashed line), $ B _{( s )}^0 \rightarrow h^+ h^{\prime -} $ (magenta dashed line), $ B ^0 \rightarrow \pi ^- \mu ^+ \nu _\mu $ , $ B ^0_ s \rightarrow K ^- \mu ^+ \nu _\mu $ , $ B _ c ^+ \rightarrow { J \mskip -3mu/\mskip -2mu\psi } \mu ^+ \nu _\mu $ and $\Lambda ^0_ b \rightarrow p \mu ^- \overline{\nu } _\mu $ (orange dashed line), and $ B ^{0(+)} \rightarrow \pi^{0(+)} \mu ^+ \mu ^- $ (cyan dashed line). The solid bands around the signal shapes represent the variation of the branching fractions by their total uncertainty. |
Fig1.pdf [25 KiB] HiDef png [419 KiB] Thumbnail [273 KiB] *.C file |
|
|
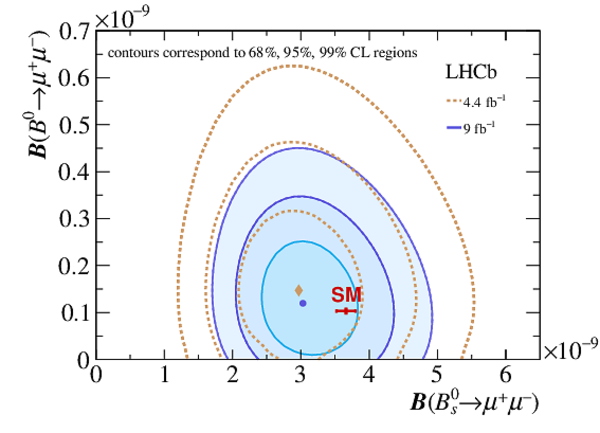
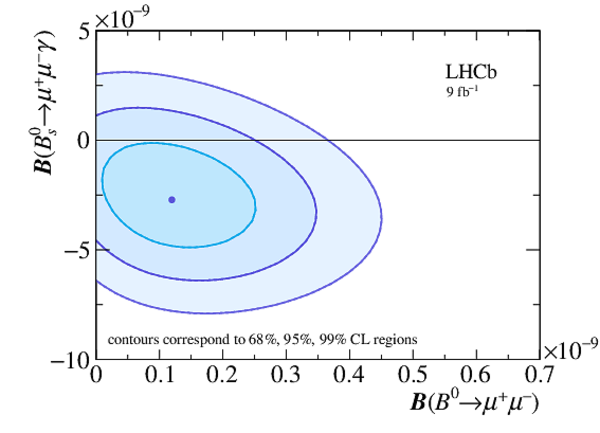
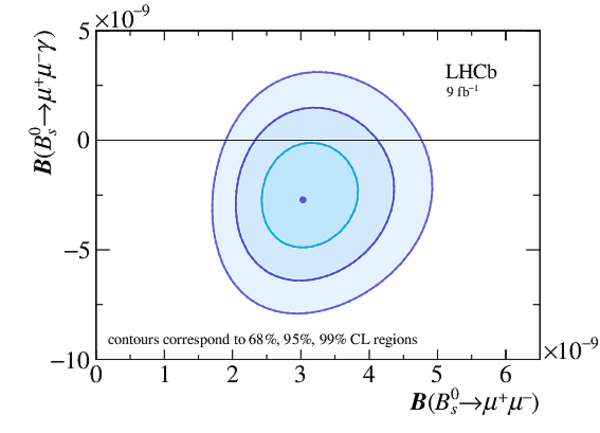
Two-dimensional profile likelihood of the branching fractions for the decays (top) $ B ^0_ s \rightarrow \mu ^+ \mu ^- $ and $ B ^0 \rightarrow \mu ^+ \mu ^- $ , (bottom left) $ B ^0 \rightarrow \mu ^+ \mu ^- $ and $ B ^0_ s \rightarrow \mu ^+ \mu ^- \gamma $ and (bottom right) $ B ^0_ s \rightarrow \mu ^+ \mu ^- $ and $ B ^0_ s \rightarrow \mu ^+ \mu ^- \gamma $ . The $ B ^0_ s \rightarrow \mu ^+ \mu ^- \gamma $ branching fraction is limited to the range $m_{\mu\mu}>4.9\text{ Ge V /}c^2 $. The measured central values of the branching fractions are indicated with a blue dot. The profile likelihood contours for 68%, 95% and 99% CL regions of the result are shown as blue contours, while in the top plot the brown contours indicate the previous measurement [10] and the red cross shows the SM prediction. |
Fig2_top.pdf [16 KiB] HiDef png [364 KiB] Thumbnail [217 KiB] *.C file |
|
|
Fig2_b[..].pdf [14 KiB] HiDef png [261 KiB] Thumbnail [163 KiB] *.C file |
|
|
|
Fig2_b[..].pdf [15 KiB] HiDef png [248 KiB] Thumbnail [150 KiB] *.C file |
|
|
|
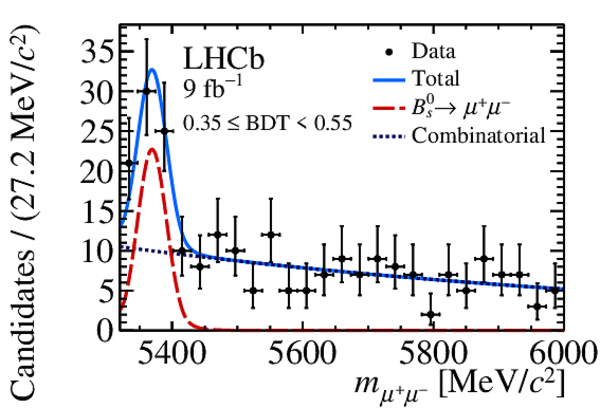
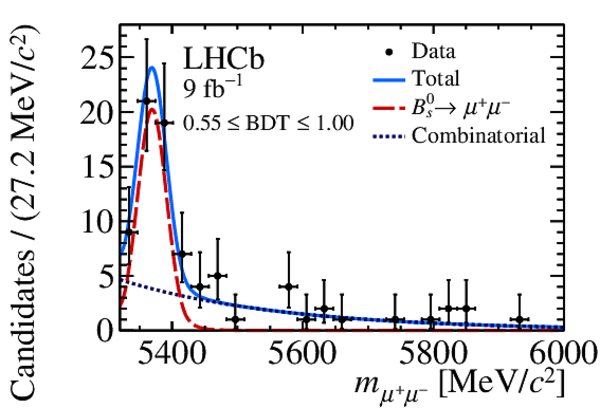
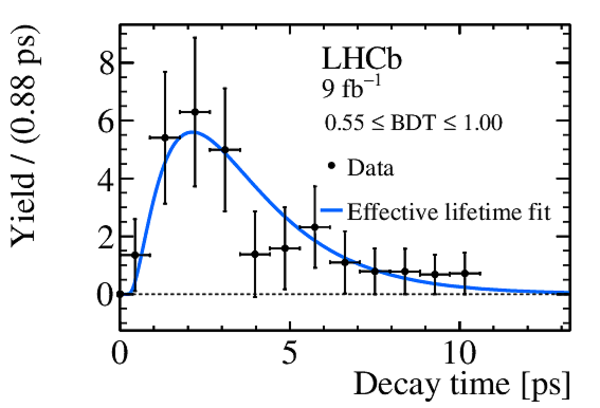
Top: dimuon mass distributions with the fit models used to perform the background subtraction superimposed. Bottom: the background-subtracted decay-time distributions with the fit model used to determine the $ B ^0_ s \rightarrow \mu ^+ \mu ^- $ effective lifetime superimposed. The distributions in the low and high BDT regions are shown in the left and right columns, respectively. |
Fig3_t[..].pdf [17 KiB] HiDef png [283 KiB] Thumbnail [241 KiB] *.C file |
|
|
Fig3_t[..].pdf [16 KiB] HiDef png [271 KiB] Thumbnail [218 KiB] *.C file |
|
|
|
Fig3_b[..].pdf [15 KiB] HiDef png [178 KiB] Thumbnail [162 KiB] *.C file |

|
|
|
Fig3_b[..].pdf [15 KiB] HiDef png [174 KiB] Thumbnail [161 KiB] *.C file |
|
|
|
Animated gif made out of all figures. |
PAPER-2021-007.gif Thumbnail |

|
![HiDef png [419 KiB]](Directory_LHCb-PAPER-2021-007/hidef_Fig1.png)
![HiDef png [364 KiB]](Directory_LHCb-PAPER-2021-007/hidef_Fig2_top.png)
![HiDef png [261 KiB]](Directory_LHCb-PAPER-2021-007/hidef_Fig2_bottom_left.png)
![HiDef png [248 KiB]](Directory_LHCb-PAPER-2021-007/hidef_Fig2_bottom_right.png)
![HiDef png [283 KiB]](Directory_LHCb-PAPER-2021-007/hidef_Fig3_top_left.png)
![HiDef png [271 KiB]](Directory_LHCb-PAPER-2021-007/hidef_Fig3_top_right.png)
![HiDef png [178 KiB]](Directory_LHCb-PAPER-2021-007/hidef_Fig3_bottom_left.png)
![HiDef png [174 KiB]](Directory_LHCb-PAPER-2021-007/hidef_Fig3_bottom_right.png)
Created on 27 April 2024.