Measurement of prompt charged-particle production in $pp$ collisions at $\sqrt{s} = 13 \mathrm{TeV}$
[to restricted-access page]Information
LHCb-PAPER-2021-010
CERN-EP-2021-110
arXiv:2107.10090 [PDF]
(Submitted on 21 Jul 2021)
JHEP 01 (2022) 166
Inspire 1889335
Tools
Abstract
The differential cross-section of prompt inclusive production of long-lived charged particles in proton-proton collisions is measured using a data sample recorded by the LHCb experiment at a centre-of-mass energy of ${\sqrt{s} = 13 \mathrm{TeV}}$. The data sample, collected with an unbiased trigger, corresponds to an integrated luminosity of ${5.4 \mathrm{nb}^{-1}}$. The differential cross-section is measured as a function of transverse momentum and pseudorapidity in the ranges ${p_\mathrm{T} \in [0.08, 10) \mathrm{GeV} c^{-1}}$ and ${\eta \in [2.0, 4.8)}$ and is determined separately for positively and negatively charged particles. The results are compared with predictions from various hadronic-interaction models.
Figures and captions
|
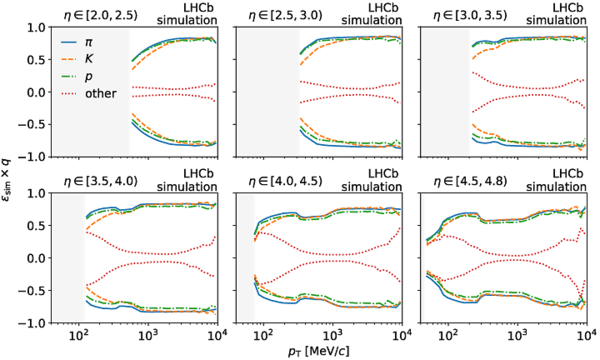
Efficiencies for different particle species in intervals of $\eta$ and as a function of $ p_{\mathrm{T}}$ for the simulated sample generated with the magnetic field pointing upwards. The product of the efficiency and the particle charge in units of the elementary charge is shown to separate values for oppositely charged particles. The light-grey areas indicate the limit of the kinematic acceptance. |
effici[..].pdf [31 KiB] HiDef png [414 KiB] Thumbnail [244 KiB] *.C file |
|
|
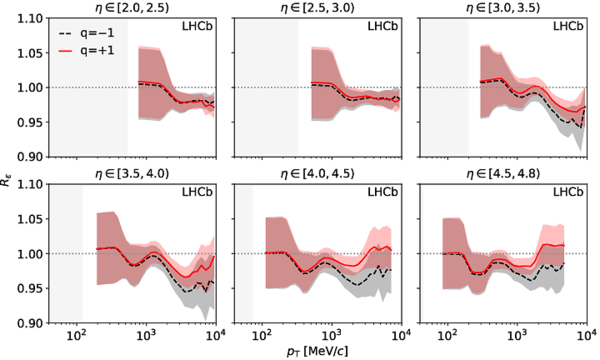
Efficiency corrections, $R_\varepsilon $, for positively and negatively charged particles in intervals of $\eta$ and as a function of $ p_{\mathrm{T}}$ for the simulated sample generated with the magnetic field pointing upwards. The bands indicate the systematic uncertainty. The light-grey areas represent the limit of the kinematic acceptance. The gap between this limit and the correction is due to the tighter requirement of ${ p > 5\text{ Ge V /}c }$ applied to the control measurements on which this correction is based. |
effici[..].pdf [25 KiB] HiDef png [324 KiB] Thumbnail [214 KiB] *.C file |
|
|
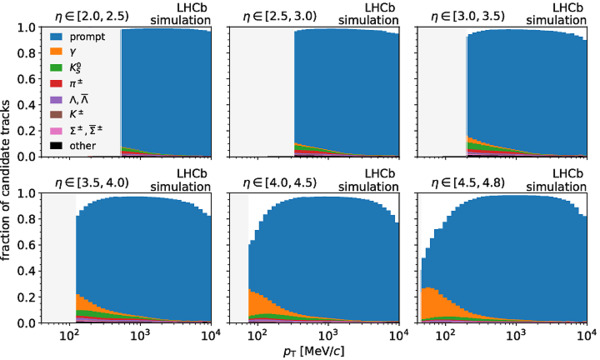
Origins of the candidate tracks in intervals of $\eta$ and as a function of $ p_{\mathrm{T}}$ for the simulated sample generated with the magnetic field pointing upwards. The prompt category refers to the signal tracks, while the other categories correspond to non-prompt tracks originating from the listed parent particles and include both decays and material interactions. Fake tracks are indicated by the white areas above the stacked histograms. The light-grey areas represent the limit of the kinematic acceptance. |
backgr[..].pdf [38 KiB] HiDef png [232 KiB] Thumbnail [209 KiB] *.C file |
|
|
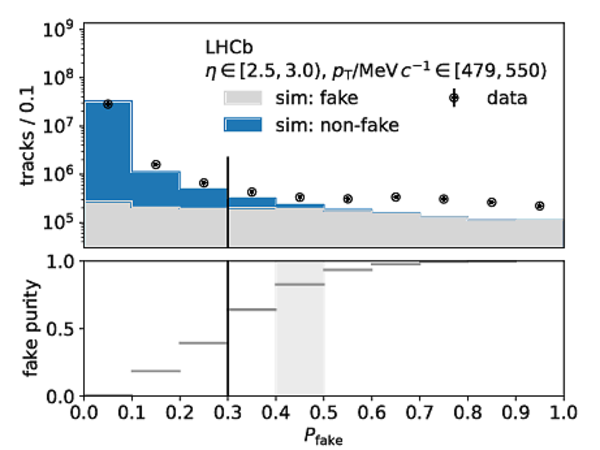
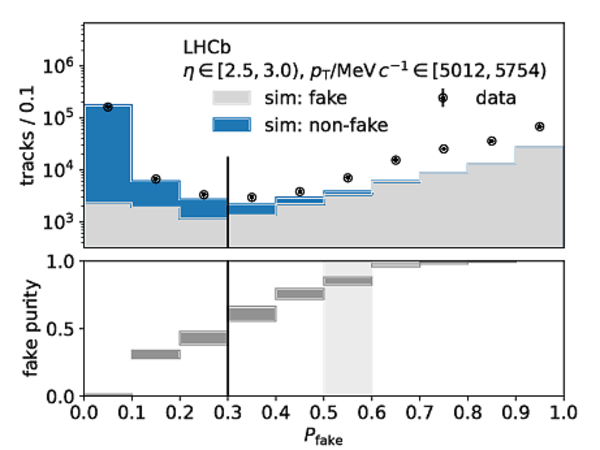
Distributions of $P_\mathrm{fake}$ in a kinematic interval (left) at low $ p_{\mathrm{T}}$ and (right) at high $ p_{\mathrm{T}}$ for the LHC fill recorded with the magnetic field pointing upwards and the simulated sample with the same magnetic-field configuration. The statistical uncertainty of the data is indicated by error bars, but they are not visible on these scales. The purity of the proxy is shown in the lower panels, where light-grey boxes represent the $P_\mathrm{fake}$ interval selected to determine the proxy. Vertical lines indicate the threshold ${P_\mathrm{fake} < 0.3}$ for candidate tracks. The normalisation of the simulated sample is described in Sect. 3. |
1_28_4201.pdf [20 KiB] HiDef png [135 KiB] Thumbnail [157 KiB] *.C file |
|
|
1_45_4201.pdf [20 KiB] HiDef png [135 KiB] Thumbnail [161 KiB] *.C file |
|
|
|
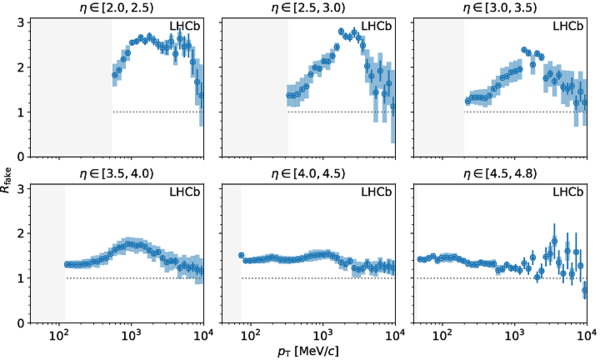
Ratio of the proxies for fake tracks in data and simulation in intervals of $\eta$ and as a function of $ p_{\mathrm{T}}$ for the LHC fill recorded with the magnetic field pointing upwards and the simulated sample with the same magnetic-field configuration. The error bars indicate the statistical uncertainty, and the boxes indicate the systematic uncertainty. The light-grey areas represent the limit of the kinematic acceptance. |
fake_r[..].pdf [29 KiB] HiDef png [339 KiB] Thumbnail [192 KiB] *.C file |
|
|
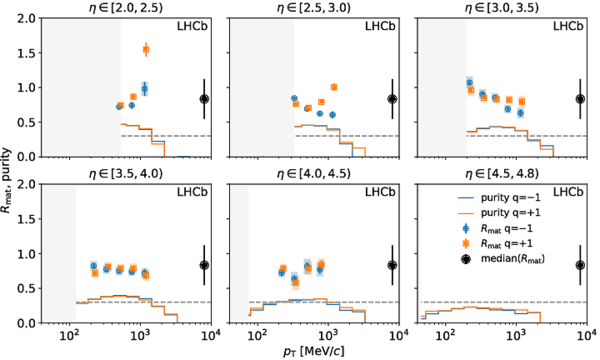
Ratio of the proxies for material interactions in data and simulation and purity of the proxy in intervals of $\eta$ and as a function of $ p_{\mathrm{T}}$ for the LHC fill recorded with the magnetic field pointing upwards and the simulated sample with the same magnetic-field configuration. The quantities are shown separately for positively and negatively charged particles. The error bars indicate the statistical uncertainty, and the boxes indicate the systematic uncertainty. The points are slightly displaced horizontally within the $ p_{\mathrm{T}}$ intervals to increase the visibility. The dashed grey lines represent the purity threshold. The larger points indicate the median value computed from the intervals above the threshold. The light-grey areas represent the limit of the kinematic acceptance. |
materi[..].pdf [26 KiB] HiDef png [191 KiB] Thumbnail [159 KiB] *.C file |
|
|
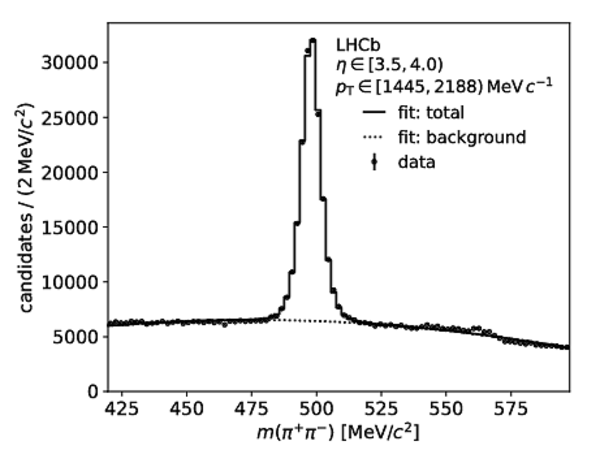
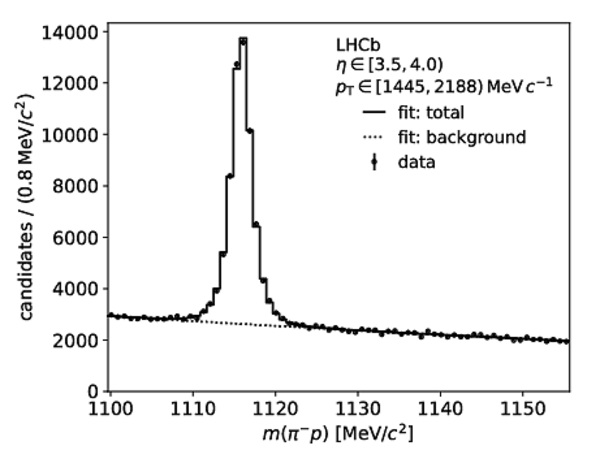
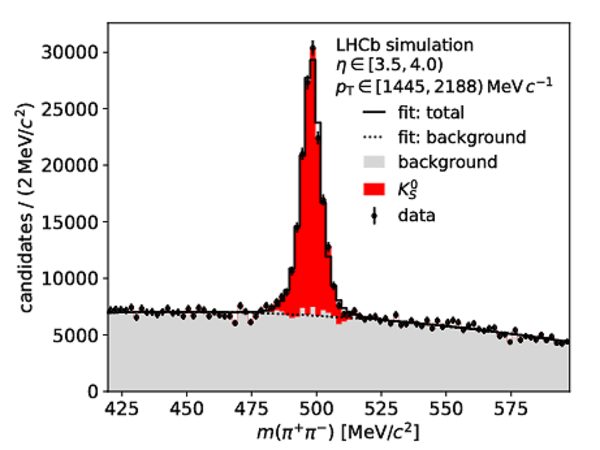
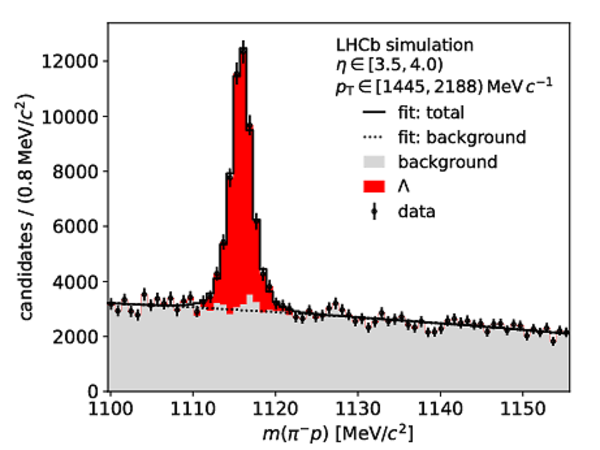
Mass distributions of (left) $ K ^0_{\mathrm{S}}$ and (right) $\Lambda$ candidates in one kinematic interval for (top) the LHC fill recorded with the magnetic field pointing upwards and (bottom) the simulated sample with the same magnetic-field configuration. Solid lines indicate the total fit and dotted lines the background. In the case of simulation, the signal and background contributions are shown for illustration, but this information is not used in the analysis. |
K_S_0_[..].pdf [23 KiB] HiDef png [125 KiB] Thumbnail [73 KiB] *.C file |
|
|
Lambda[..].pdf [22 KiB] HiDef png [117 KiB] Thumbnail [74 KiB] *.C file |
|
|
|
K_S_0_[..].pdf [27 KiB] HiDef png [204 KiB] Thumbnail [216 KiB] *.C file |
|
|
|
Lambda[..].pdf [25 KiB] HiDef png [200 KiB] Thumbnail [220 KiB] *.C file |
|
|
|
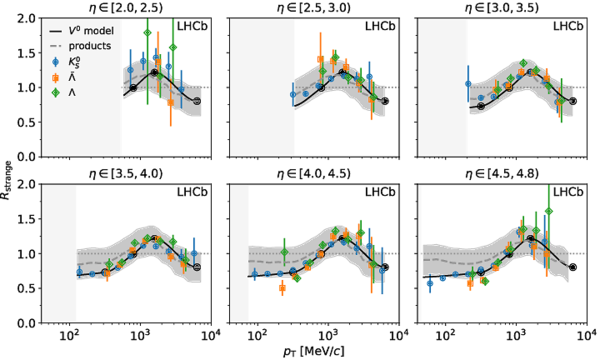
Ratio of the proxies for strange-hadron decays in data and simulation in intervals of $\eta$ and as a function of $ p_{\mathrm{T}}$ for the LHC fill recorded with the magnetic field pointing upwards and the simulated sample with the same magnetic-field configuration. The $\mathit{ V^0 }$ model lines indicate the interpolated $ K ^0_{\mathrm{S}}$ , $\Lambda$ and $\overline{ \Lambda}$ yield ratios, with support points indicated by black dots. The lines labelled as products represent the proxy ratio of the decay products, with the bands representing the propagated systematic uncertainty. The light-grey areas indicate the limit of the kinematic acceptance. |
v0_rat[..].pdf [38 KiB] HiDef png [380 KiB] Thumbnail [245 KiB] *.C file |
|
|
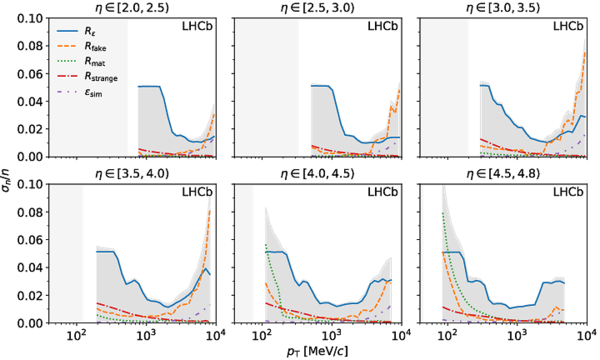
Leading sources of relative uncertainties of the number of prompt long-lived charged particles in intervals of $\eta$ and as a function of $ p_{\mathrm{T}}$ for the LHC fill recorded with the magnetic field pointing upwards. The total uncertainty, represented by the grey envelopes, excludes the uncertainty of the integrated luminosity of $2.0 \%$. The light-grey areas indicate the limit of the kinematic acceptance. |
final_[..].pdf [28 KiB] HiDef png [388 KiB] Thumbnail [227 KiB] *.C file |
|
|
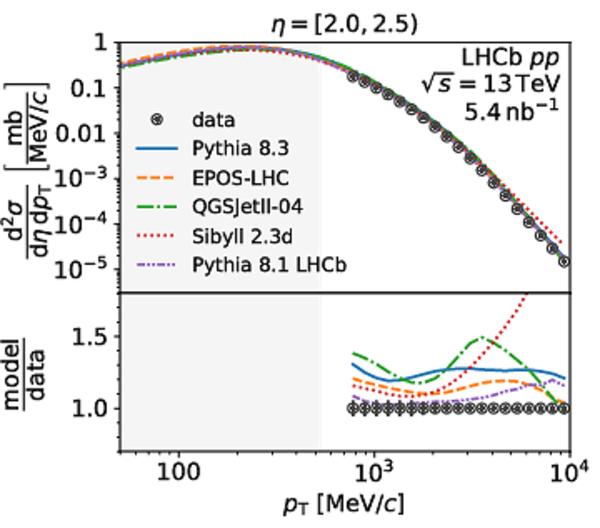
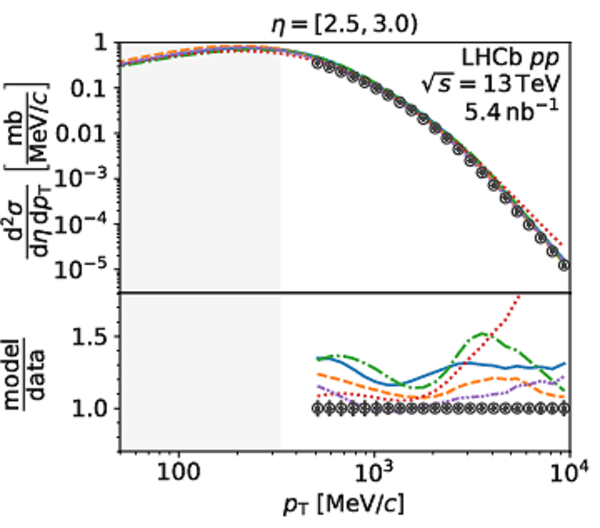
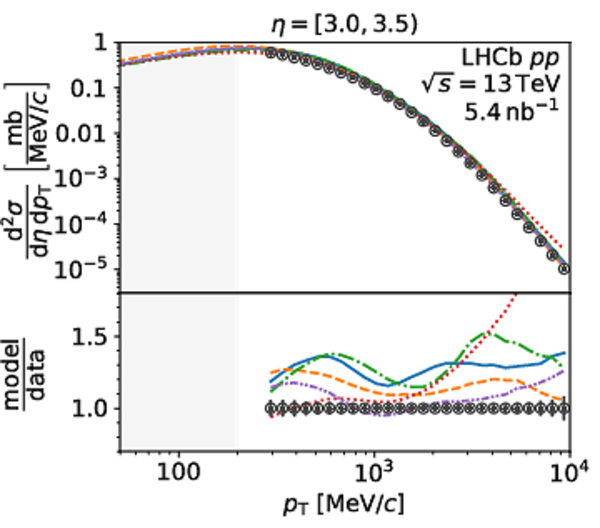
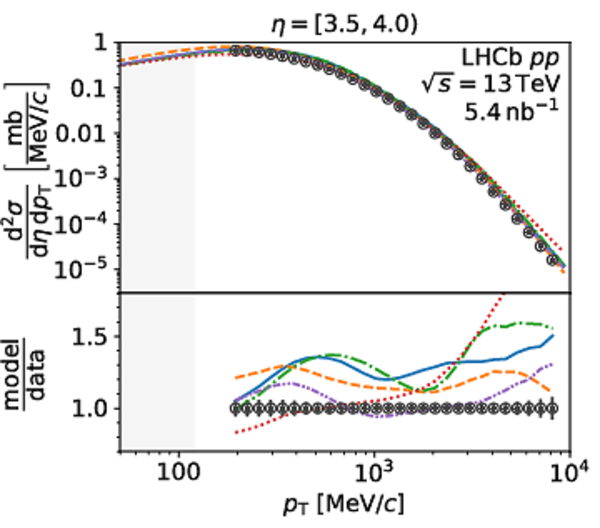
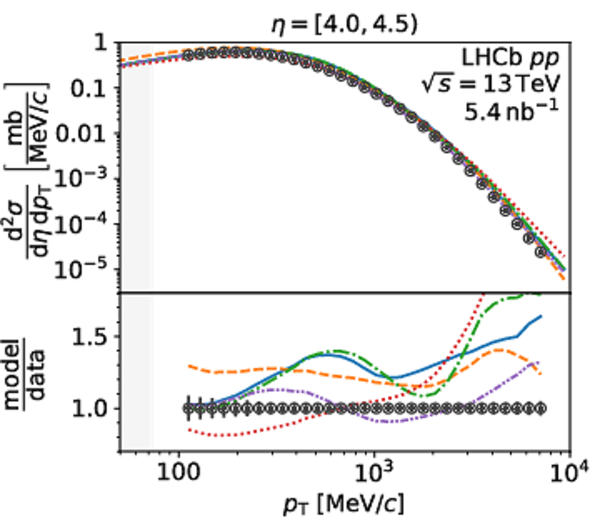
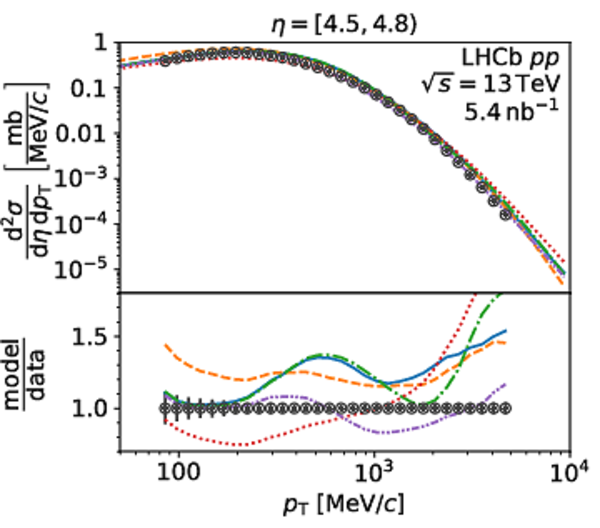
Differential cross-section of inclusive production of prompt long-lived charged particles in intervals of pseudorapidity, $\eta$, and as a function of transverse momentum, $ p_{\mathrm{T}}$ . The error bars indicate the total uncertainty. The ratios of the model predictions and this measurement are shown in the lower panels. The lines labelled as Pythia 8.1 LHCb correspond to the occupancy-weighted simulated samples of this analysis. |
final_0.pdf [26 KiB] HiDef png [409 KiB] Thumbnail [368 KiB] *.C file |
|
|
final_1.pdf [23 KiB] HiDef png [369 KiB] Thumbnail [295 KiB] *.C file |
|
|
|
final_2.pdf [23 KiB] HiDef png [390 KiB] Thumbnail [306 KiB] *.C file |
|
|
|
final_3.pdf [23 KiB] HiDef png [405 KiB] Thumbnail [310 KiB] *.C file |
|
|
|
final_4.pdf [23 KiB] HiDef png [425 KiB] Thumbnail [323 KiB] *.C file |
|
|
|
final_5.pdf [24 KiB] HiDef png [416 KiB] Thumbnail [313 KiB] *.C file |
|
|
|
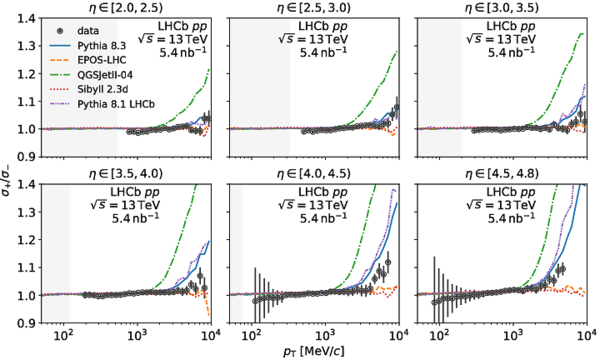
Ratios of the differential cross-sections of inclusive production of prompt long-lived positively and negatively charged particles as a function of transverse momentum and pseudorapidity for the data and the models shown in Fig. 10. |
final_[..].pdf [39 KiB] HiDef png [372 KiB] Thumbnail [263 KiB] *.C file |
|
|
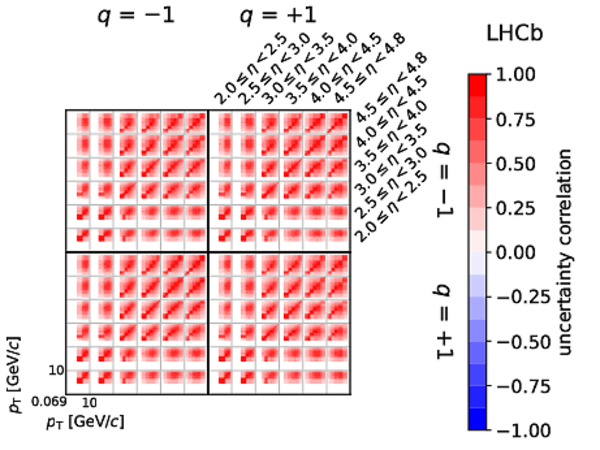
Correlation matrix for the uncertainties of the differential cross-section of prompt inclusive production of long-lived charged particles. The four large quadrants correspond to the correlations between negatively and positively charged particles. The 36 cells within each quadrant correspond to the $\eta$ intervals. In each cell, the correlations of the $ p_{\mathrm{T}}$ intervals are shown from low to high $ p_{\mathrm{T}}$ in logarithmic intervals. |
final_[..].pdf [2 MiB] HiDef png [1 MiB] Thumbnail [474 KiB] *.C file |
|
|
Animated gif made out of all figures. |
PAPER-2021-010.gif Thumbnail |

|
![HiDef png [414 KiB]](Directory_LHCb-PAPER-2021-010/hidef_efficiency_per_particle_simple_4201.png)
![HiDef png [324 KiB]](Directory_LHCb-PAPER-2021-010/hidef_efficiency_ratio_4201.png)
![HiDef png [232 KiB]](Directory_LHCb-PAPER-2021-010/hidef_background_origin_candidate_sim09b_up.png)
![HiDef png [135 KiB]](Directory_LHCb-PAPER-2021-010/hidef_1_28_4201.png)
![HiDef png [135 KiB]](Directory_LHCb-PAPER-2021-010/hidef_1_45_4201.png)
![HiDef png [339 KiB]](Directory_LHCb-PAPER-2021-010/hidef_fake_ratio_4201.png)
![HiDef png [191 KiB]](Directory_LHCb-PAPER-2021-010/hidef_material_ratio_simple_4201.png)
![HiDef png [125 KiB]](Directory_LHCb-PAPER-2021-010/hidef_K_S_0_3_12_4201.png)
![HiDef png [117 KiB]](Directory_LHCb-PAPER-2021-010/hidef_Lambda_3_12_4201.png)
![HiDef png [204 KiB]](Directory_LHCb-PAPER-2021-010/hidef_K_S_0_3_12_4201_sim.png)
![HiDef png [200 KiB]](Directory_LHCb-PAPER-2021-010/hidef_Lambda_3_12_4201_sim.png)
![HiDef png [380 KiB]](Directory_LHCb-PAPER-2021-010/hidef_v0_ratio_4201.png)
![HiDef png [388 KiB]](Directory_LHCb-PAPER-2021-010/hidef_final_error_simple_4201.png)
![HiDef png [409 KiB]](Directory_LHCb-PAPER-2021-010/hidef_final_0.png)
![HiDef png [369 KiB]](Directory_LHCb-PAPER-2021-010/hidef_final_1.png)
![HiDef png [390 KiB]](Directory_LHCb-PAPER-2021-010/hidef_final_2.png)
![HiDef png [405 KiB]](Directory_LHCb-PAPER-2021-010/hidef_final_3.png)
![HiDef png [425 KiB]](Directory_LHCb-PAPER-2021-010/hidef_final_4.png)
![HiDef png [416 KiB]](Directory_LHCb-PAPER-2021-010/hidef_final_5.png)
![HiDef png [372 KiB]](Directory_LHCb-PAPER-2021-010/hidef_final_charge_ratio.png)
![HiDef png [1 MiB]](Directory_LHCb-PAPER-2021-010/hidef_final_correlation.png)
Tables and captions
|
Statistical and systematic uncertainties affecting the measured differential cross-section. |
Table_1.pdf [35 KiB] HiDef png [71 KiB] Thumbnail [31 KiB] tex code |

|
|
Inelastic cross-sections used in the models of which the predictions are compared with this measurement and values from recent measurements at the LHC . |
Table_2.pdf [58 KiB] HiDef png [72 KiB] Thumbnail [36 KiB] tex code |

|
![HiDef png [71 KiB]](Directory_LHCb-PAPER-2021-010/hidef_Table_1.png)
![HiDef png [72 KiB]](Directory_LHCb-PAPER-2021-010/hidef_Table_2.png)
Created on 27 April 2024.