Branching Fraction Measurements of the Rare $B^0_s\rightarrow\phi\mu^+\mu^-$ and $B^0_s\rightarrow f_2^\prime(1525)\mu^+\mu^-$- Decays
[to restricted-access page]Information
LHCb-PAPER-2021-014
CERN-EP-2021-092
arXiv:2105.14007 [PDF]
(Submitted on 28 May 2021)
Phys. Rev. Lett. 127 (2021) 151801
Inspire 1865990
Tools
Abstract
The branching fraction of the rare $B^0_s\rightarrow\phi\mu^+\mu^-$ decay is measured using data collected by the LHCb experiment at center-of-mass energies of $7$, $8$ and $13 \rm{TeV}$, corresponding to integrated luminosities of $1$, $2$ and $6 {\rm fb}^{-1}$, respectively. The branching fraction is reported in intervals of $q^2$, the square of the dimuon invariant mass. In the $q^2$ region between $1.1$ and $6.0 {\rm Ge V}^2 /c^4$, the measurement is found to lie $3.6$ standard deviations below a Standard Model prediction based on a combination of Light Cone Sum Rule and Lattice QCD calculations. In addition, the first observation of the rare $B^0_s\rightarrow f_2^\prime(1525)\mu^+\mu^-$ decay is reported with a statistical significance of nine standard deviations and its branching fraction is determined.
Figures and captions
|
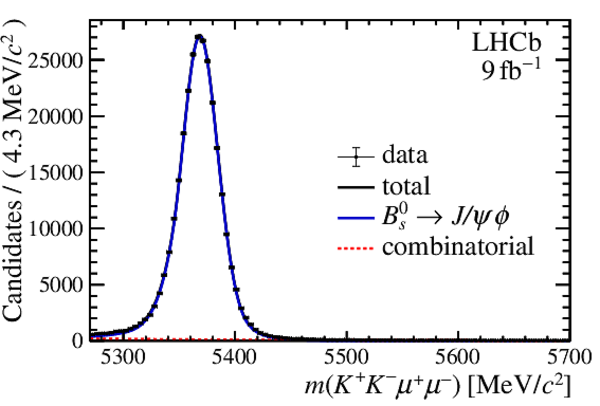
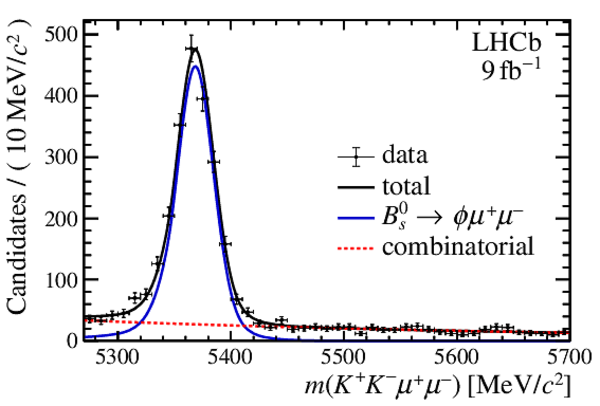
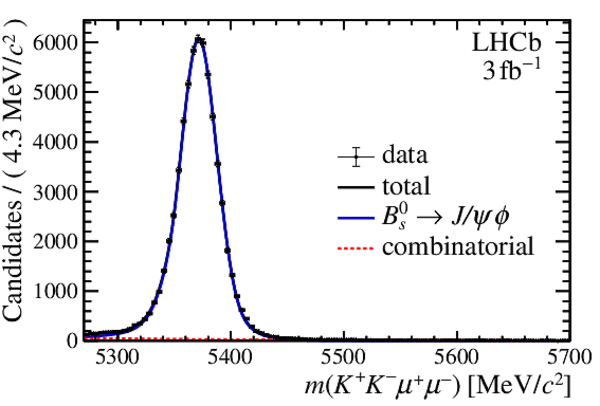
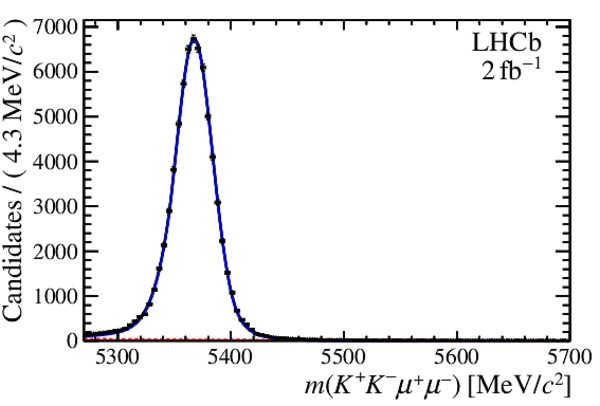
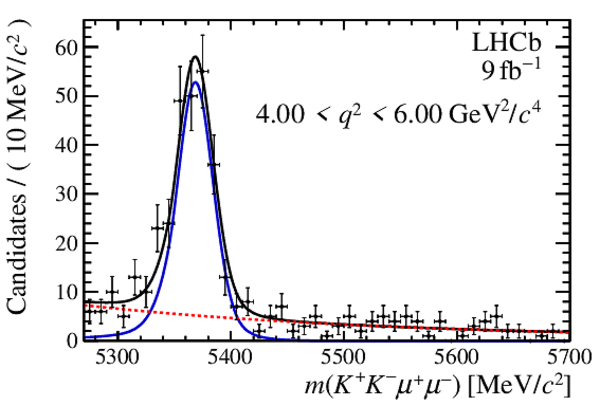
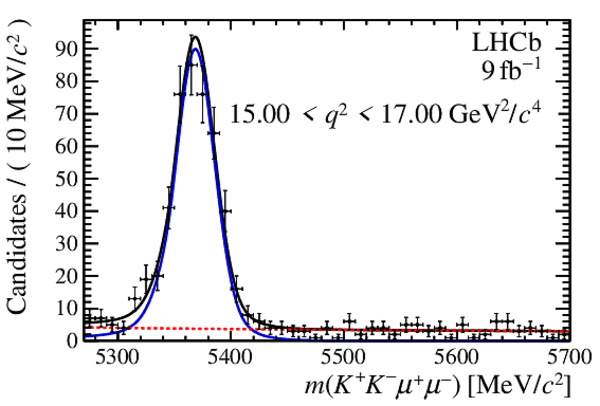
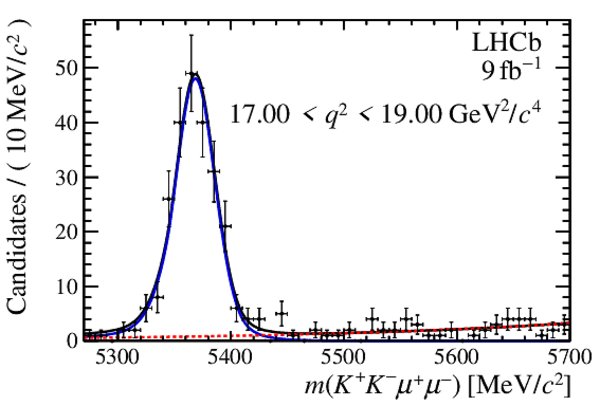
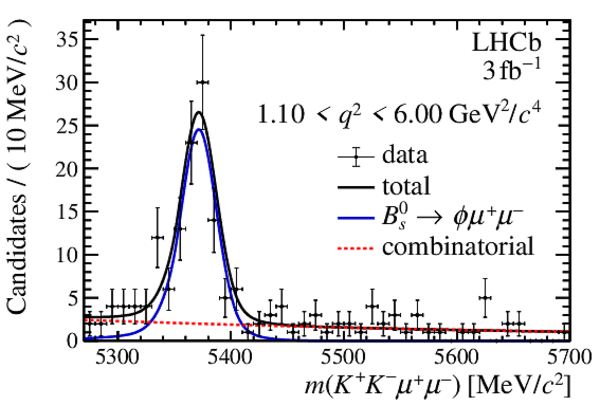
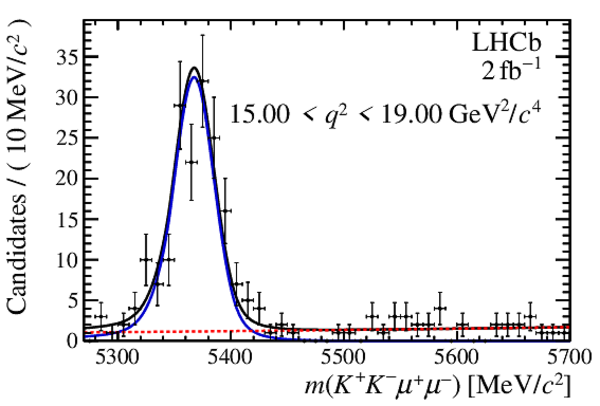
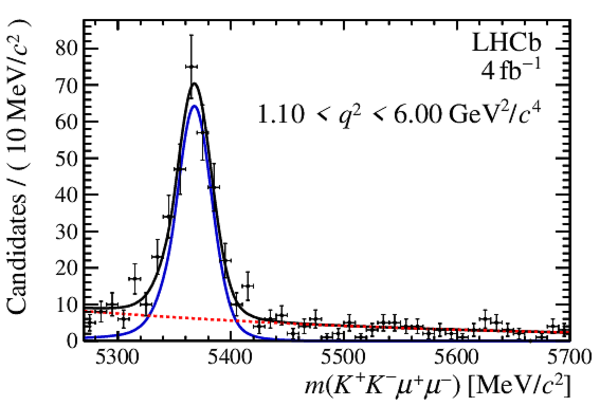
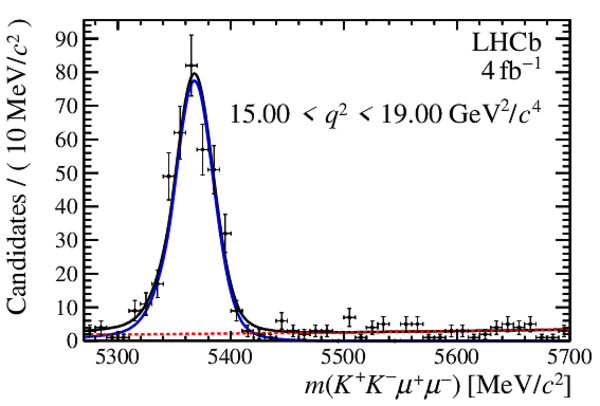
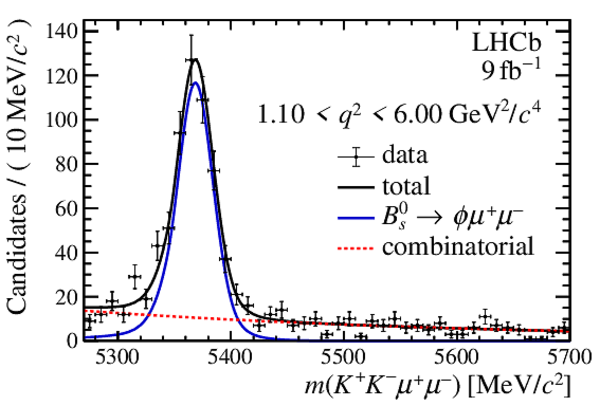
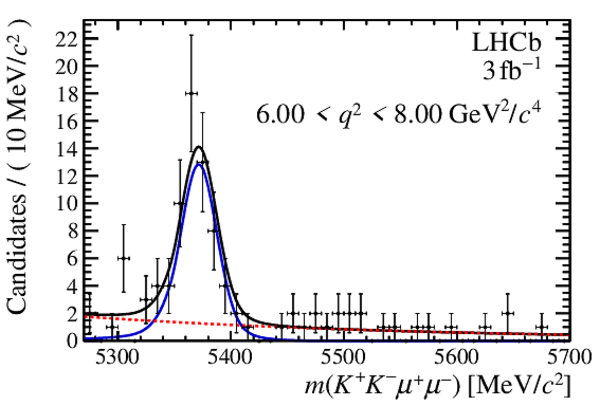
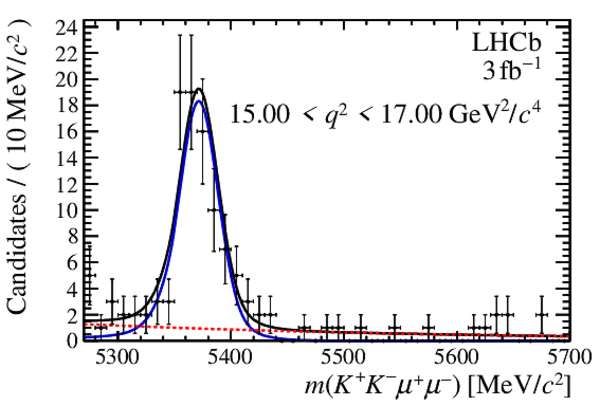
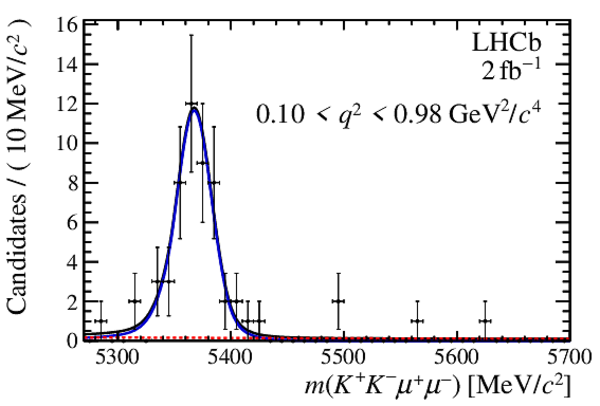
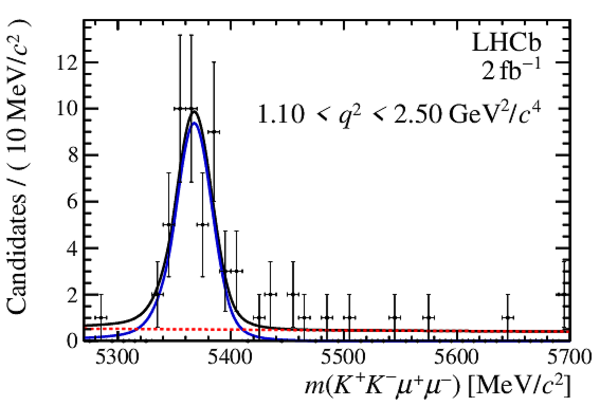
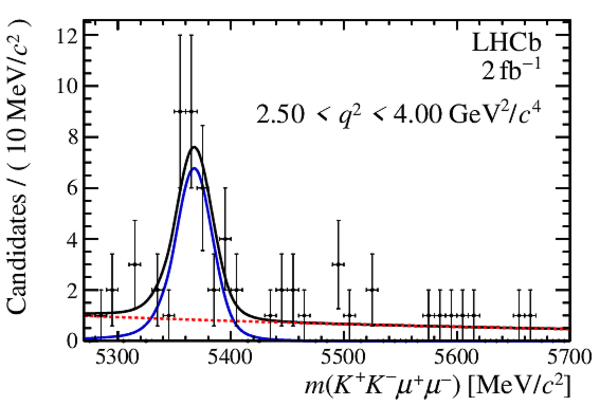
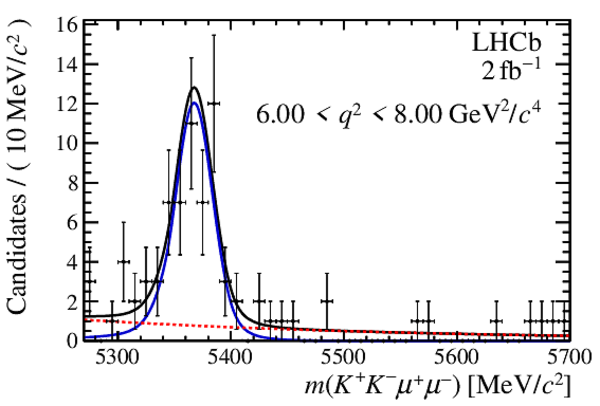
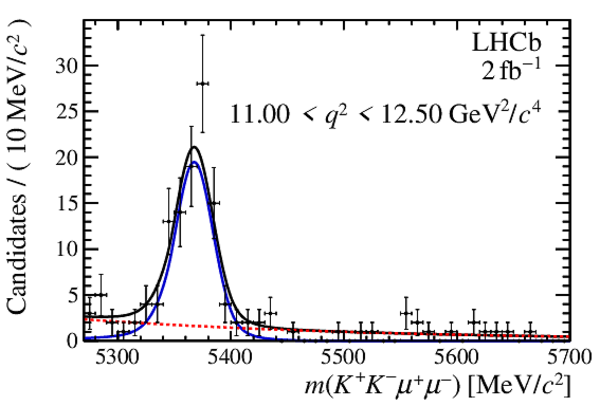
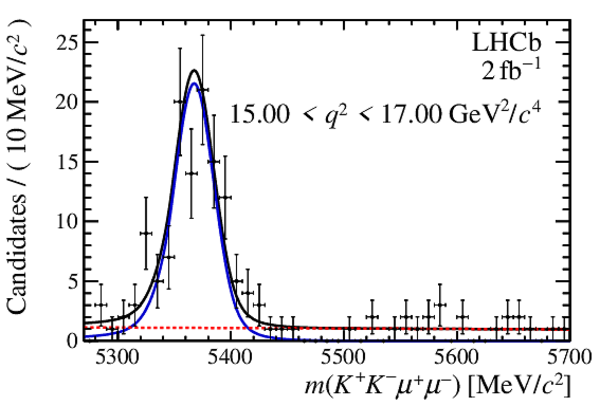
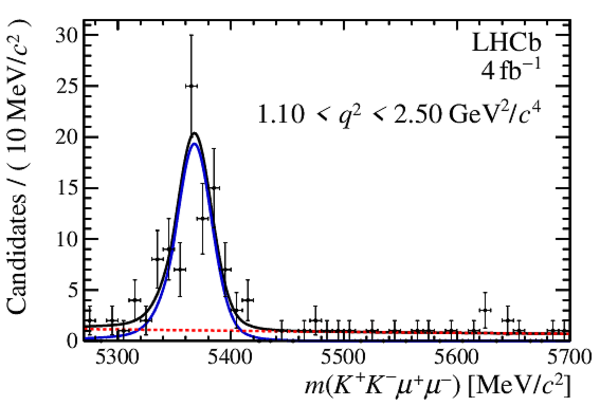
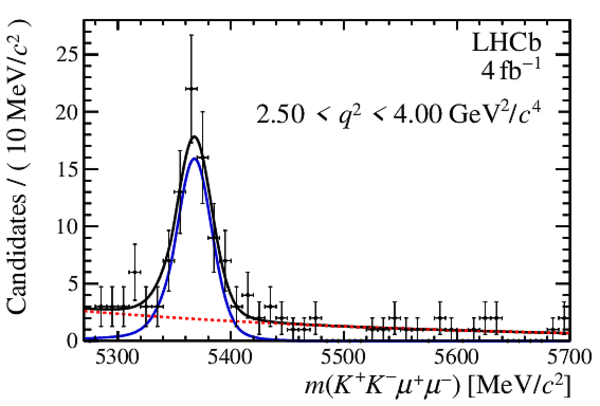
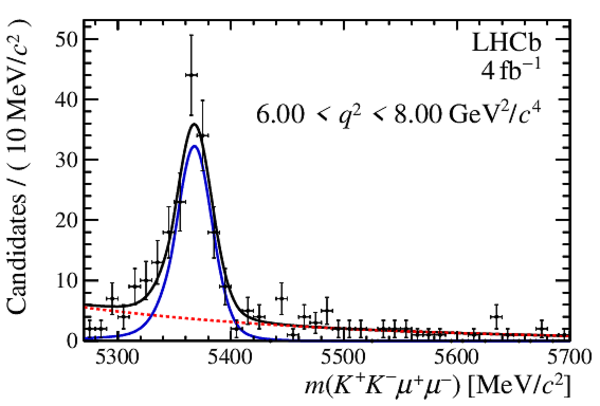
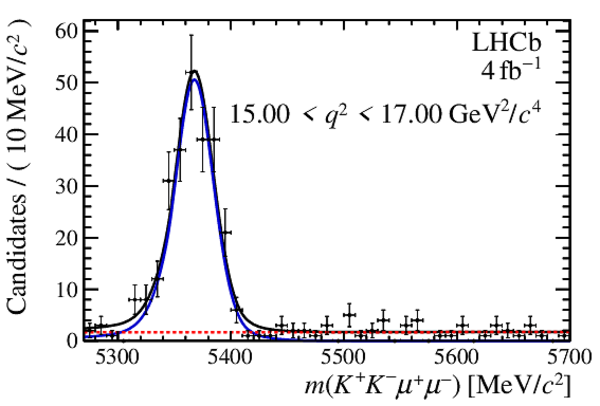
Reconstructed invariant mass of the $ K ^+ K ^- \mu ^+ \mu ^- $ system for (left) the $ B ^0_ s \rightarrow { J \mskip -3mu/\mskip -2mu\psi } \phi $ normalization mode and (right) the $ B ^0_ s \rightarrow \phi\mu ^+\mu ^- $ signal candidates, integrated over $ q^2$ and overlaid with the fit projections. |
Fig1a.pdf [34 KiB] HiDef png [233 KiB] Thumbnail [188 KiB] *.C file |
|
|
Fig1b.pdf [20 KiB] HiDef png [247 KiB] Thumbnail [206 KiB] *.C file |
|
|
|
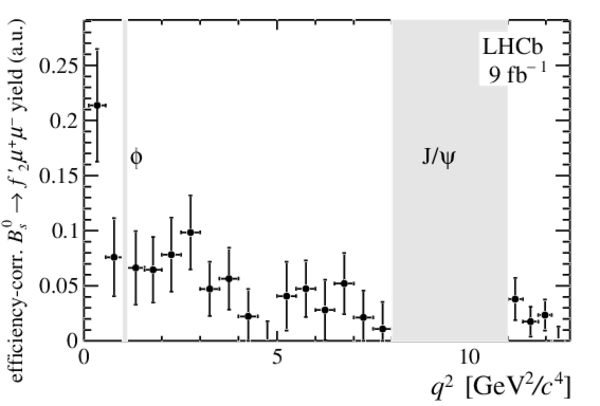
Differential branching fraction ${\rm d}{\mathcal B}( B ^0_ s \rightarrow \phi\mu ^+\mu ^- )/{\rm d}q^2$, overlaid with SM predictions using Light Cone Sum Rules [34,36,39] at low $ q^2$ and Lattice calculations [37,38] at high $ q^2$ . The results from the LHCb 3 $\text{ fb} ^{-1}$ analysis [1,31] are shown with gray markers. |
Fig2.pdf [16 KiB] HiDef png [220 KiB] Thumbnail [172 KiB] *.C file |

|
|
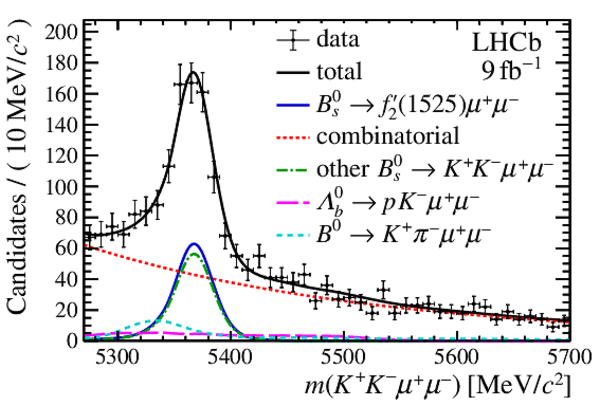
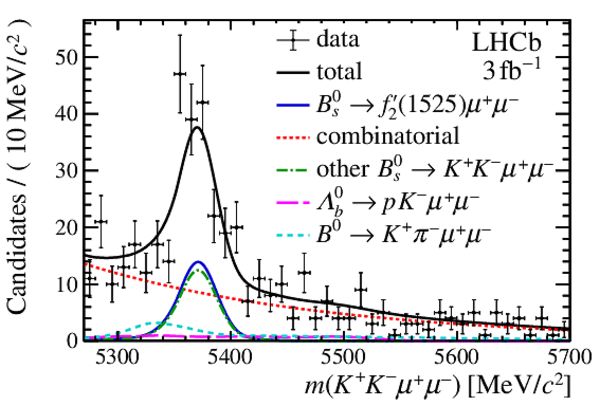
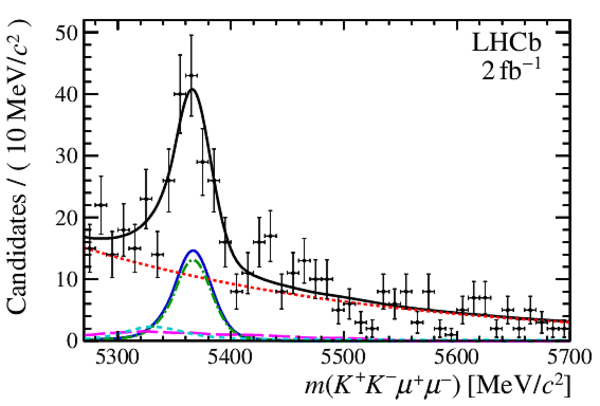
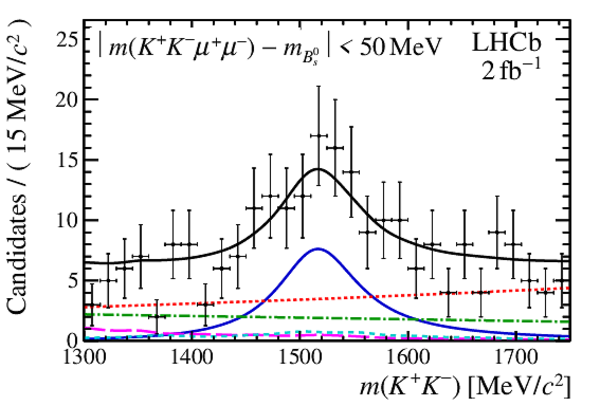
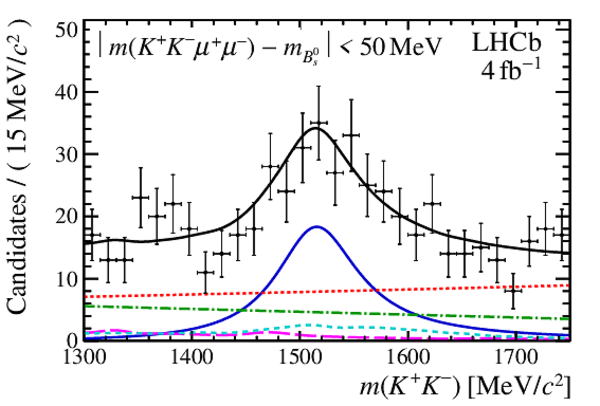
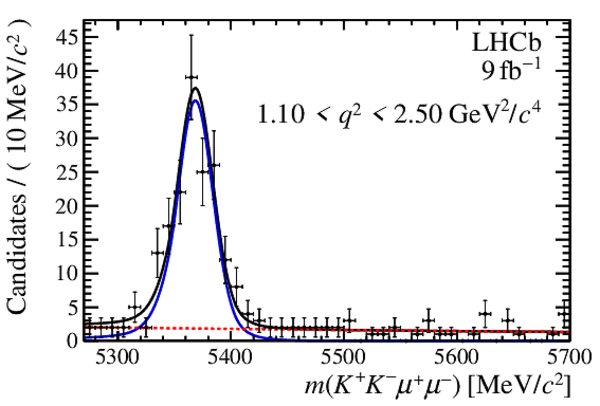
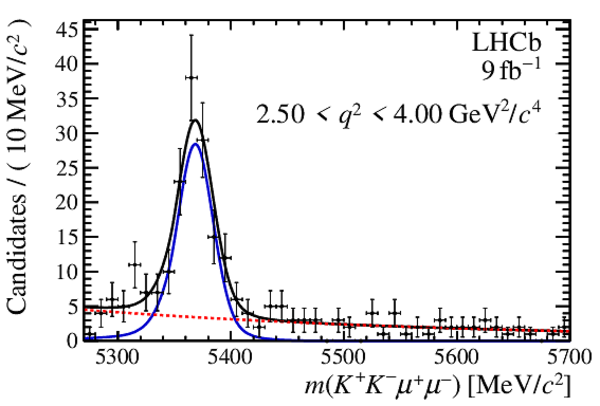
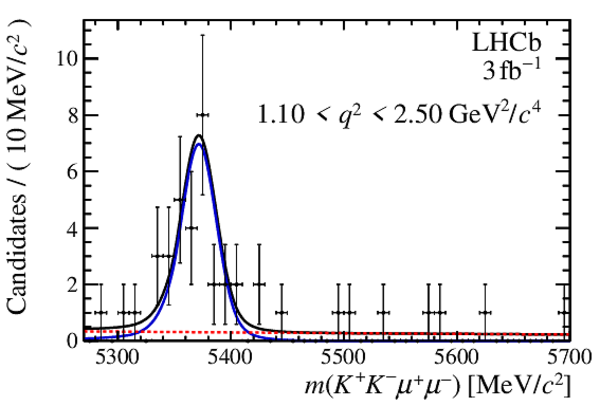
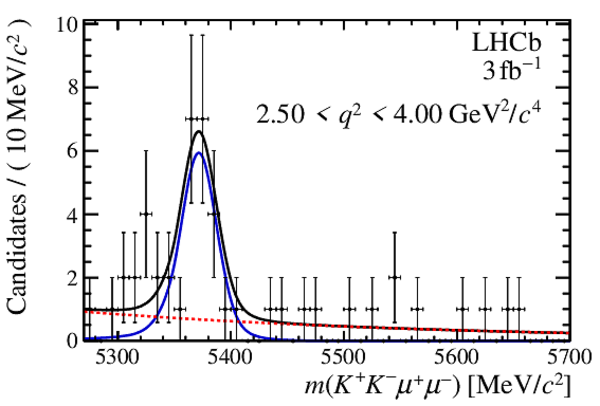
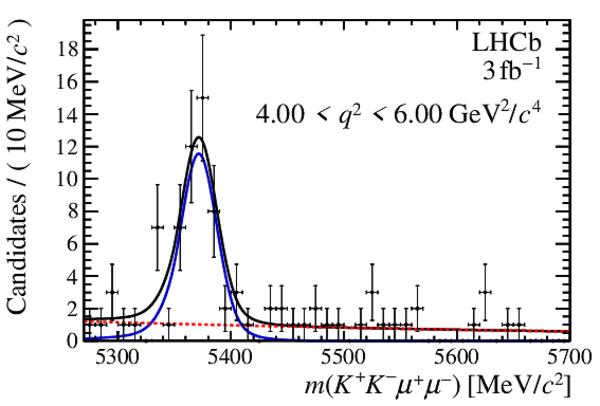
Reconstructed invariant mass of (left) the $ K ^+ K ^- \mu ^+ \mu ^- $ system and (right) the $ K ^+ K ^- $ system for $ B ^0_ s \rightarrow f_2^\prime\mu ^+\mu ^- $ candidates, overlaid with the fit projections. The $m( K ^+ K ^- )$ distribution is shown in the $ B ^0_ s $ signal region $\pm 50\text{ Me V /}c^2 $ around the known $ B ^0_ s $ mass. |
Fig3a.pdf [23 KiB] HiDef png [324 KiB] Thumbnail [288 KiB] *.C file |
|
|
Fig3b.pdf [21 KiB] HiDef png [289 KiB] Thumbnail [246 KiB] *.C file |

|
|
|
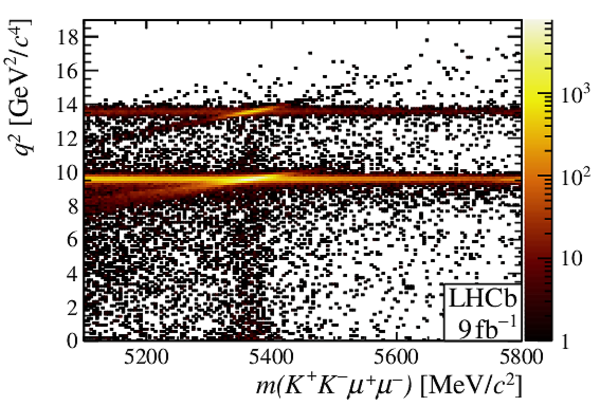
Invariant mass of the $ K ^+ K ^- \mu ^+ \mu ^- $ system versus $ q^2$ for selected (top) $ B ^0_ s \rightarrow \phi\mu ^+\mu ^- $ and (bottom) $ B ^0_ s \rightarrow f_2^\prime\mu ^+\mu ^- $ candidates across all data-taking periods. |
Fig4a.pdf [53 KiB] HiDef png [959 KiB] Thumbnail [597 KiB] *.C file |

|
|
Fig4b.pdf [56 KiB] HiDef png [1009 KiB] Thumbnail [594 KiB] *.C file |
|
|
|
Reconstructed invariant mass of the $ K ^+ K ^- \mu ^+\mu ^- $ system for (left) $ B ^0_ s \rightarrow { J \mskip -3mu/\mskip -2mu\psi } \phi $ and (right) $ B ^0_ s \rightarrow \phi\mu ^+\mu ^- $ candidates, integrated over $ q^2$ , for the (top) 2011--2012, (middle) 2015--2016, and (bottom) 2017--2018 data-taking periods. The data are overlaid with the fit projections. |
Fig5a.pdf [34 KiB] HiDef png [235 KiB] Thumbnail [192 KiB] *.C file |
|
|
Fig5b.pdf [20 KiB] HiDef png [250 KiB] Thumbnail [209 KiB] *.C file |

|
|
|
Fig5c.pdf [33 KiB] HiDef png [208 KiB] Thumbnail [166 KiB] *.C file |
|
|
|
Fig5d.pdf [19 KiB] HiDef png [224 KiB] Thumbnail [180 KiB] *.C file |

|
|
|
Fig5e.pdf [33 KiB] HiDef png [210 KiB] Thumbnail [165 KiB] *.C file |

|
|
|
Fig5f.pdf [20 KiB] HiDef png [216 KiB] Thumbnail [179 KiB] *.C file |

|
|
|
Reconstructed invariant mass of (left) the $ K ^+ K ^- \mu ^+ \mu ^- $ system and (right) the $ K ^+ K ^- $ system for $ B ^0_ s \rightarrow f_2^\prime\mu ^+\mu ^- $ candidates for the (top) 2011--2012, (middle) 2015--2016, and (bottom) 2017--2018 data-taking periods. Distributions are overlaid with the fit projections. The $ K ^+ K ^- $ distribution is shown in the $ B ^0_ s $ signal region $\pm50\text{ Me V} $ around the known $ B ^0_ s $ mass. |
Fig6a.pdf [22 KiB] HiDef png [311 KiB] Thumbnail [275 KiB] *.C file |
|
|
Fig6b.pdf [20 KiB] HiDef png [275 KiB] Thumbnail [226 KiB] *.C file |

|
|
|
Fig6c.pdf [21 KiB] HiDef png [241 KiB] Thumbnail [204 KiB] *.C file |
|
|
|
Fig6d.pdf [20 KiB] HiDef png [273 KiB] Thumbnail [225 KiB] *.C file |
|
|
|
Fig6e.pdf [21 KiB] HiDef png [249 KiB] Thumbnail [205 KiB] *.C file |

|
|
|
Fig6f.pdf [20 KiB] HiDef png [282 KiB] Thumbnail [235 KiB] *.C file |
|
|
|
Animated gif made out of all figures. |
PAPER-2021-014.gif Thumbnail |

|
Tables and captions
|
Differential ${\rm d}{\mathcal B}( B ^0_ s \rightarrow \phi\mu ^+\mu ^- )/{\rm d} q^2 $ branching fraction, both relative to the normalization mode and absolute, in intervals of $ q^2$ . The uncertainties are, in order, statistical, systematic, and due to the uncertainty on the branching fraction of the normalization mode. |
Table_1.pdf [69 KiB] HiDef png [105 KiB] Thumbnail [56 KiB] tex code |

|
|
Systematic uncertainties on the differential branching fraction ${\rm d}{\mathcal B}( B ^0_ s \rightarrow \phi\mu ^+\mu ^- )/{\rm d}q^2$ and on the total branching fraction ${\mathcal B}( B ^0_ s \rightarrow f_2^\prime\mu ^+\mu ^- )$. Ranges indicate the variation across the $ q^2$ intervals. The uncertainty from the branching fraction of the normalization mode, ${\mathcal B}( B ^0_ s \rightarrow { J \mskip -3mu/\mskip -2mu\psi } \phi) $, is quoted separately. |
Table_2.pdf [82 KiB] HiDef png [77 KiB] Thumbnail [33 KiB] tex code |

|
Supplementary Material [file]


![HiDef png [233 KiB]](Directory_LHCb-PAPER-2021-014/hidef_Fig1a.png)
![HiDef png [247 KiB]](Directory_LHCb-PAPER-2021-014/hidef_Fig1b.png)
![HiDef png [220 KiB]](Directory_LHCb-PAPER-2021-014/hidef_Fig2.png)
![HiDef png [324 KiB]](Directory_LHCb-PAPER-2021-014/hidef_Fig3a.png)
![HiDef png [289 KiB]](Directory_LHCb-PAPER-2021-014/hidef_Fig3b.png)
![HiDef png [959 KiB]](Directory_LHCb-PAPER-2021-014/hidef_Fig4a.png)
![HiDef png [1009 KiB]](Directory_LHCb-PAPER-2021-014/hidef_Fig4b.png)
![HiDef png [235 KiB]](Directory_LHCb-PAPER-2021-014/hidef_Fig5a.png)
![HiDef png [250 KiB]](Directory_LHCb-PAPER-2021-014/hidef_Fig5b.png)
![HiDef png [208 KiB]](Directory_LHCb-PAPER-2021-014/hidef_Fig5c.png)
![HiDef png [224 KiB]](Directory_LHCb-PAPER-2021-014/hidef_Fig5d.png)
![HiDef png [210 KiB]](Directory_LHCb-PAPER-2021-014/hidef_Fig5e.png)
![HiDef png [216 KiB]](Directory_LHCb-PAPER-2021-014/hidef_Fig5f.png)
![HiDef png [311 KiB]](Directory_LHCb-PAPER-2021-014/hidef_Fig6a.png)
![HiDef png [275 KiB]](Directory_LHCb-PAPER-2021-014/hidef_Fig6b.png)
![HiDef png [241 KiB]](Directory_LHCb-PAPER-2021-014/hidef_Fig6c.png)
![HiDef png [273 KiB]](Directory_LHCb-PAPER-2021-014/hidef_Fig6d.png)
![HiDef png [249 KiB]](Directory_LHCb-PAPER-2021-014/hidef_Fig6e.png)
![HiDef png [282 KiB]](Directory_LHCb-PAPER-2021-014/hidef_Fig6f.png)
![HiDef png [105 KiB]](Directory_LHCb-PAPER-2021-014/hidef_Table_1.png)
![HiDef png [77 KiB]](Directory_LHCb-PAPER-2021-014/hidef_Table_2.png)
![HiDef png [257 KiB]](Directory_LHCb-PAPER-2021-014/supplementary/hidef_Fig10a.png)
![HiDef png [239 KiB]](Directory_LHCb-PAPER-2021-014/supplementary/hidef_Fig10b.png)
![HiDef png [244 KiB]](Directory_LHCb-PAPER-2021-014/supplementary/hidef_Fig10c.png)
![HiDef png [253 KiB]](Directory_LHCb-PAPER-2021-014/supplementary/hidef_Fig10d.png)
![HiDef png [245 KiB]](Directory_LHCb-PAPER-2021-014/supplementary/hidef_Fig10e.png)
![HiDef png [249 KiB]](Directory_LHCb-PAPER-2021-014/supplementary/hidef_Fig10f.png)
![HiDef png [251 KiB]](Directory_LHCb-PAPER-2021-014/supplementary/hidef_Fig10g.png)
![HiDef png [234 KiB]](Directory_LHCb-PAPER-2021-014/supplementary/hidef_Fig10h.png)
![HiDef png [269 KiB]](Directory_LHCb-PAPER-2021-014/supplementary/hidef_Fig11a.png)
![HiDef png [234 KiB]](Directory_LHCb-PAPER-2021-014/supplementary/hidef_Fig11b.png)
![HiDef png [242 KiB]](Directory_LHCb-PAPER-2021-014/supplementary/hidef_Fig11c.png)
![HiDef png [240 KiB]](Directory_LHCb-PAPER-2021-014/supplementary/hidef_Fig11d.png)
![HiDef png [249 KiB]](Directory_LHCb-PAPER-2021-014/supplementary/hidef_Fig11e.png)
![HiDef png [243 KiB]](Directory_LHCb-PAPER-2021-014/supplementary/hidef_Fig11f.png)
![HiDef png [278 KiB]](Directory_LHCb-PAPER-2021-014/supplementary/hidef_Fig11g.png)
![HiDef png [244 KiB]](Directory_LHCb-PAPER-2021-014/supplementary/hidef_Fig11h.png)
![HiDef png [128 KiB]](Directory_LHCb-PAPER-2021-014/supplementary/hidef_Fig12.png)
![HiDef png [250 KiB]](Directory_LHCb-PAPER-2021-014/supplementary/hidef_Fig7a.png)
![HiDef png [214 KiB]](Directory_LHCb-PAPER-2021-014/supplementary/hidef_Fig7b.png)
![HiDef png [229 KiB]](Directory_LHCb-PAPER-2021-014/supplementary/hidef_Fig7c.png)
![HiDef png [235 KiB]](Directory_LHCb-PAPER-2021-014/supplementary/hidef_Fig7d.png)
![HiDef png [238 KiB]](Directory_LHCb-PAPER-2021-014/supplementary/hidef_Fig7e.png)
![HiDef png [242 KiB]](Directory_LHCb-PAPER-2021-014/supplementary/hidef_Fig7f.png)
![HiDef png [245 KiB]](Directory_LHCb-PAPER-2021-014/supplementary/hidef_Fig7g.png)
![HiDef png [228 KiB]](Directory_LHCb-PAPER-2021-014/supplementary/hidef_Fig7h.png)
![HiDef png [213 KiB]](Directory_LHCb-PAPER-2021-014/supplementary/hidef_Fig8a.png)
![HiDef png [221 KiB]](Directory_LHCb-PAPER-2021-014/supplementary/hidef_Fig8b.png)
![HiDef png [225 KiB]](Directory_LHCb-PAPER-2021-014/supplementary/hidef_Fig8c.png)
![HiDef png [234 KiB]](Directory_LHCb-PAPER-2021-014/supplementary/hidef_Fig8d.png)
![HiDef png [237 KiB]](Directory_LHCb-PAPER-2021-014/supplementary/hidef_Fig8e.png)
![HiDef png [227 KiB]](Directory_LHCb-PAPER-2021-014/supplementary/hidef_Fig8f.png)
![HiDef png [233 KiB]](Directory_LHCb-PAPER-2021-014/supplementary/hidef_Fig8g.png)
![HiDef png [226 KiB]](Directory_LHCb-PAPER-2021-014/supplementary/hidef_Fig8h.png)
![HiDef png [218 KiB]](Directory_LHCb-PAPER-2021-014/supplementary/hidef_Fig9a.png)
![HiDef png [220 KiB]](Directory_LHCb-PAPER-2021-014/supplementary/hidef_Fig9b.png)
![HiDef png [228 KiB]](Directory_LHCb-PAPER-2021-014/supplementary/hidef_Fig9c.png)
![HiDef png [252 KiB]](Directory_LHCb-PAPER-2021-014/supplementary/hidef_Fig9d.png)
![HiDef png [232 KiB]](Directory_LHCb-PAPER-2021-014/supplementary/hidef_Fig9e.png)
![HiDef png [229 KiB]](Directory_LHCb-PAPER-2021-014/supplementary/hidef_Fig9f.png)
![HiDef png [230 KiB]](Directory_LHCb-PAPER-2021-014/supplementary/hidef_Fig9g.png)
![HiDef png [229 KiB]](Directory_LHCb-PAPER-2021-014/supplementary/hidef_Fig9h.png)
Created on 27 April 2024.