Measurement of the Nuclear Modification Factor and Prompt Charged Particle Production in $p-Pb$ and $pp$ Collisions at $\sqrt {s_{NN}}$=5 TeV
[to restricted-access page]Information
LHCb-PAPER-2021-015
CERN-EP-2021-130
arXiv:2108.13115 [PDF]
(Submitted on 30 Aug 2021)
Phys. Rev. Lett. 128 (2022) 142004
Inspire 1913240
Tools
Abstract
The production of prompt charged particles in proton-lead collisions and in proton-proton collisions at the nucleon-nucleon centre-of-mass energy ${\sqrt{s_{\scriptscriptstyle\mathrm{NN}}}=5 \mathrm{TeV}}$ is studied at LHCb as a function of pseudorapidity ($\eta$) and transverse momentum ($p_{\mathrm{T}}$) with respect to the proton beam direction. The nuclear modification factor for charged particles is determined as a function of $\eta$ between ${-4.8<\eta<-2.5}$ (backward region) and ${2.0<\eta<4.8}$ (forward region), and $p_{\mathrm{T}}$ between ${0.2<p_{\mathrm{T}}<8.0 \mathrm{GeV}/c}$. The results show a suppression of charged particle production in proton-lead collisions relative to proton-proton collisions in the forward region and an enhancement in the backward region for $p_{\mathrm{T}}$ larger than $1.5 \mathrm{GeV}/c$. This measurement constrains nuclear PDFs and saturation models at previously unexplored values of the parton momentum fraction down to $10^{-6}$.
Figures and captions
|
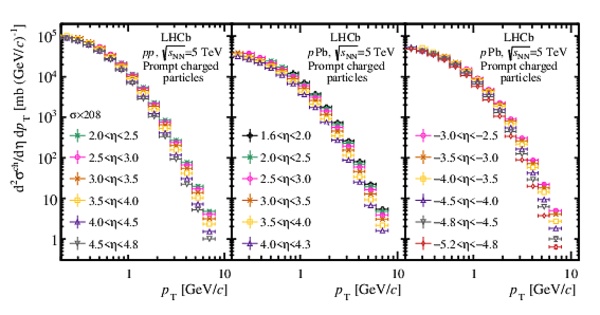
Differential cross-section of prompt charged particle production as a function of $ p_{\mathrm{T}}$ in different $\eta$ intervals in (left) $ pp $, (middle) forward $ p\mathrm{Pb} $ and (right) backward $ p\mathrm{Pb} $ collisions. The cross-section values for $ pp $ are scaled by the lead mass number (${A=208}$) for comparison with the $ p\mathrm{Pb} $ cross-sections. |
Fig1.pdf [33 KiB] HiDef png [402 KiB] Thumbnail [268 KiB] *.C file |
|
|
Nuclear modification factor as a function of $ p_{\mathrm{T}} $ in different $\eta$ intervals for the (top) forward and (bottom) backward regions, compared with the predictions from Refs. [13,20,49,52]. Vertical error bars correspond to statistical uncertainties, open boxes to uncorrelated systematic uncertainty and the filled box at ${ R_{p\mathrm{Pb}} =1}$ to the correlated uncertainty from the luminosity. |
Fig2.pdf [51 KiB] HiDef png [823 KiB] Thumbnail [412 KiB] *.C file |

|
|
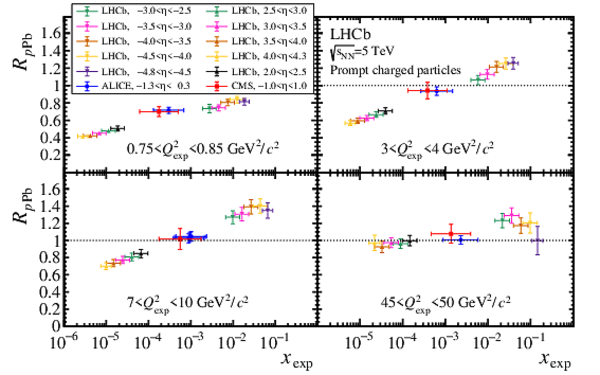
Evolution of the nuclear modification factor with $x_{\text{exp}}$ from this study, ALICE [21], and CMS [22], for different $Q^{2}_{\text{exp}}$ ranges. Each plot includes all the $ R_{p\mathrm{Pb}} $ ${(\eta, p_{\mathrm{T}} )}$ intervals with a $ p_{\mathrm{T}} $ centre within the $Q^{2}_{\text{exp}}$ range specified in the plot. Horizontal error bars account for the minimum and maximum $x_{\text{exp}}$ value for a given ${(\eta, p_{\mathrm{T}} )}$ interval. Vertical error bars correspond to statistical, systematic and luminosity (normalisation) uncertainties for LHCb (ALICE, CMS), added in quadrature. |
Fig3.pdf [24 KiB] HiDef png [333 KiB] Thumbnail [277 KiB] *.C file |
|
|
Animated gif made out of all figures. |
PAPER-2021-015.gif Thumbnail |

|
![HiDef png [402 KiB]](Directory_LHCb-PAPER-2021-015/hidef_Fig1.png)
![HiDef png [823 KiB]](Directory_LHCb-PAPER-2021-015/hidef_Fig2.png)
![HiDef png [333 KiB]](Directory_LHCb-PAPER-2021-015/hidef_Fig3.png)
Tables and captions
|
Relative uncertainties for $ p\mathrm{Pb}$ and $ pp$ charged particle cross-sections. The interval indicates the minimum and the maximum value among the $(\eta, p_{\mathrm{T}} )$ bins. The systematic uncertainty due to luminosity is fully correlated across the bins. The other sources of systematic uncertainties are fully uncorrelated between different bins. |
Table_1.pdf [58 KiB] HiDef png [116 KiB] Thumbnail [58 KiB] tex code |

|
![HiDef png [116 KiB]](Directory_LHCb-PAPER-2021-015/hidef_Table_1.png)
Supplementary Material [file]
| Supplementary material full pdf |
supple[..].pdf [149 KiB] |
|
|
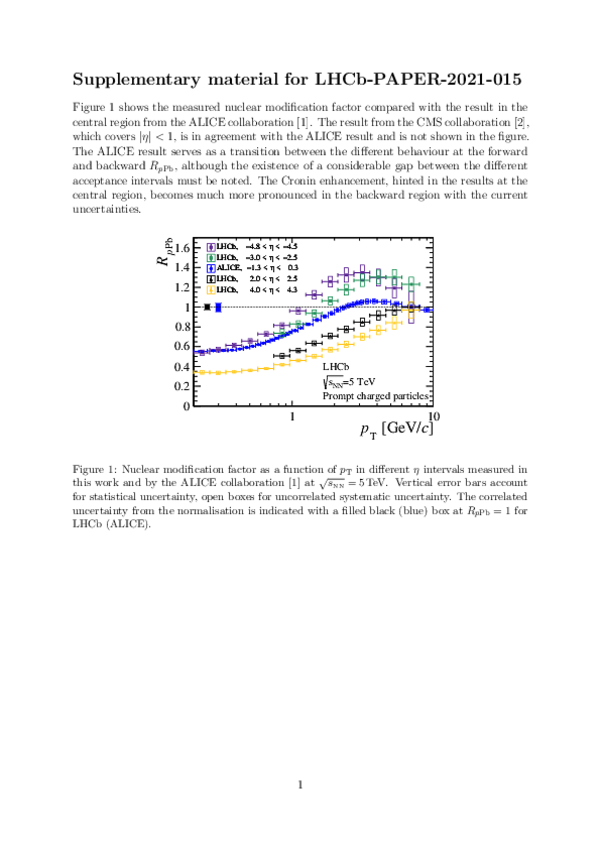
This ZIP file contains supplementary material for the publication LHCb-PAPER-2021-015. The files are: supplementary.pdf : An overview of the extra figure Fig1-S.pdf, Fig1-S.png, Fig1-S.eps, Fig1-S.C : The figure in various formats data.zip : ZIP file with the data tables in .csv format |
Fig1-S.pdf [21 KiB] HiDef png [364 KiB] Thumbnail [267 KiB] *C file |

|
![HiDef png [364 KiB]](Directory_LHCb-PAPER-2021-015/supplementary/hidef_Fig1-S.png)
Created on 27 April 2024.