Observation of a $\Lambda_b^0-\overline{\Lambda}_b^0$ production asymmetry in proton-proton collisions at $\sqrt{s} = 7 \textrm{ and } 8 \textrm{TeV}$
[to restricted-access page]Information
LHCb-PAPER-2021-016
CERN-EP-2021-121
arXiv:2107.09593 [PDF]
(Submitted on 20 Jul 2021)
JHEP 10 (2021) 060
Inspire 1888216
Tools
Abstract
This article presents differential measurements of the asymmetry between $\Lambda_b^0$ and $\overline{\Lambda}_b^0$ baryon production rates in proton-proton collisions at centre-of-mass energies of $\sqrt{s}=7$ and $8 \textrm{TeV}$ collected with the LHCb experiment, corresponding to an integrated luminosity of $3 \textrm{fb}^{-1}$. The $\Lambda_b^0$ baryons are reconstructed through the inclusive semileptonic decay $\Lambda_b^0\rightarrow\Lambda_c^+\mu^-\overline{\nu}_{\mu}X$. The production asymmetry is measured both in intervals of rapidity in the range $2.15<y<4.10$ and transverse momentum in $2<p_T<27 \textrm{GeV}/c$. The results are found to be incompatible with symmetric production with a significance of 5.8 standard deviations for both $\sqrt{s}=7$ and $8 \textrm{TeV}$ data, assuming no $C P$ violation in the decay. There is evidence for a trend as a function of rapidity with a significance of 4 standard deviations. Comparisons to predictions from hadronisation models in PYTHIA and heavy-quark recombination are provided. This result constitutes the first observation of a particle-antiparticle asymmetry in $b$-hadron production at LHC energies.
Figures and captions
|
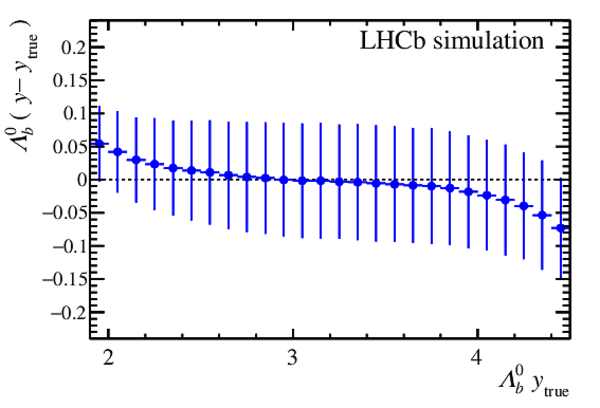
Mean and the standard deviation of the difference of reconstructed and true rapidity of $\Lambda ^0_ b $ baryons as a function of the true rapidity obtained from simulation. The reconstructed rapidity $y$ is approximated by the rapidity of the $\Lambda ^+_ c \mu ^- $ system. The markers correspond to the means and the error bars correspond to the standard deviations of the distributions in a $y_\text{true}$ interval. |
Fig1.pdf [16 KiB] HiDef png [131 KiB] Thumbnail [112 KiB] *.C file |
|
|
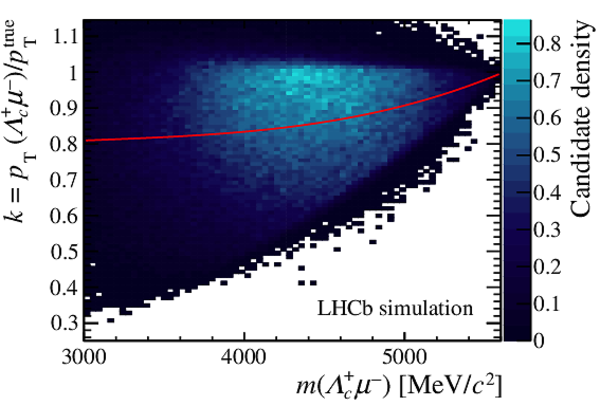
Distributions of the $k$-factors in simulated data as a function of the $\Lambda ^+_ c \mu ^- $ invariant mass. The average correction $k(m(\Lambda ^+_ c \mu ^- ))$ is overlaid in red. The colour code describes the normalised density of the distribution. |
Fig2.pdf [34 KiB] HiDef png [517 KiB] Thumbnail [490 KiB] *.C file |
|
|
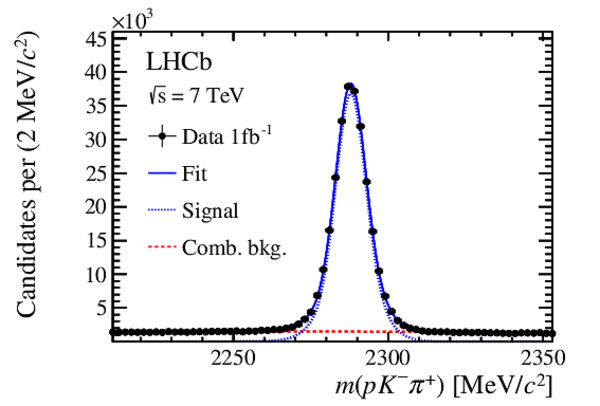
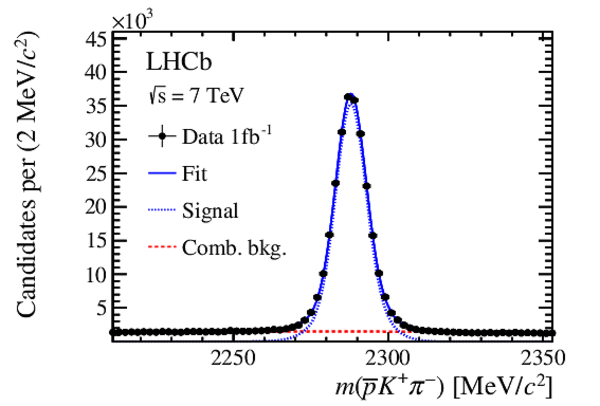
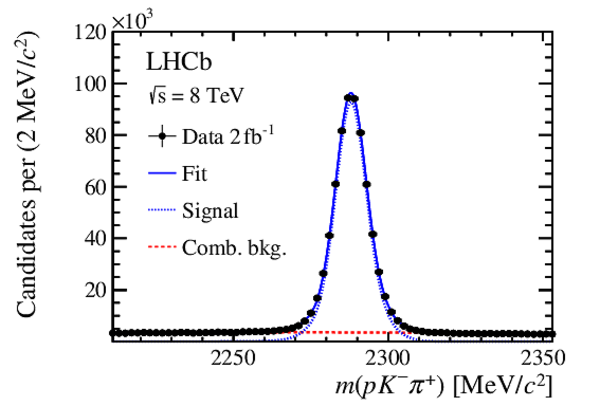
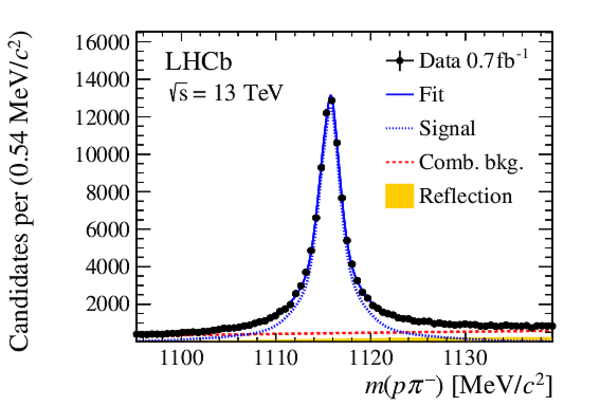
Distributions of the $ p K ^- \pi ^+ $ invariant mass for (left) $\Lambda ^+_ c \mu ^- $ and (right) $\overline{ \Lambda} {}^-_ c \mu ^+ $ candidates for the (top) $\sqrt{s} =7\text{ Te V} $ and (bottom) $\sqrt{s} =8\text{ Te V} $ data set. Fits to the distributions, as described in the text, are shown as well. |
Fig3a.pdf [30 KiB] HiDef png [201 KiB] Thumbnail [172 KiB] *.C file |
|
|
Fig3b.pdf [30 KiB] HiDef png [200 KiB] Thumbnail [172 KiB] *.C file |
|
|
|
Fig3c.pdf [29 KiB] HiDef png [195 KiB] Thumbnail [160 KiB] *.C file |
|
|
|
Fig3d.pdf [29 KiB] HiDef png [194 KiB] Thumbnail [160 KiB] *.C file |

|
|
|
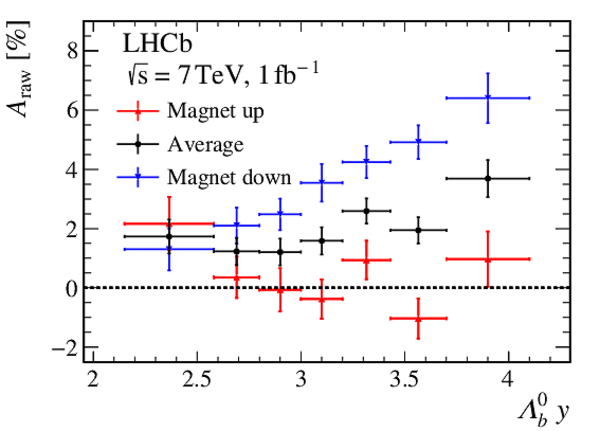
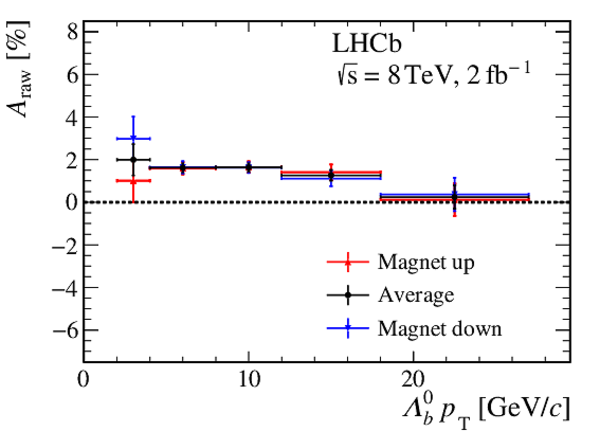
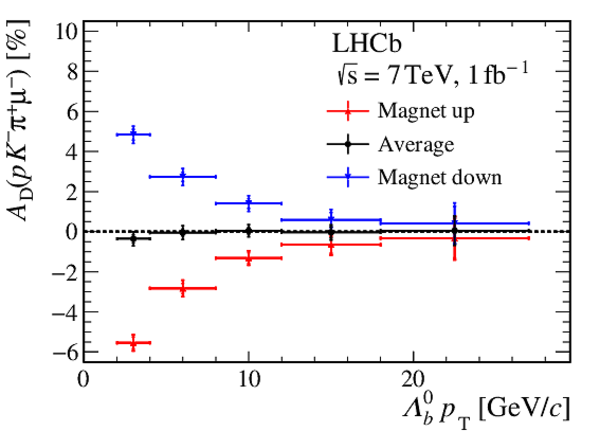
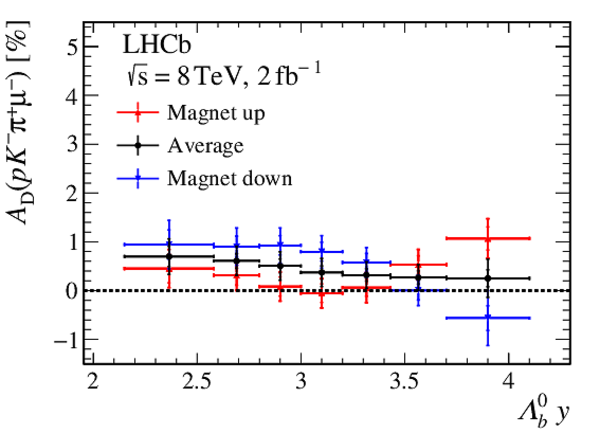
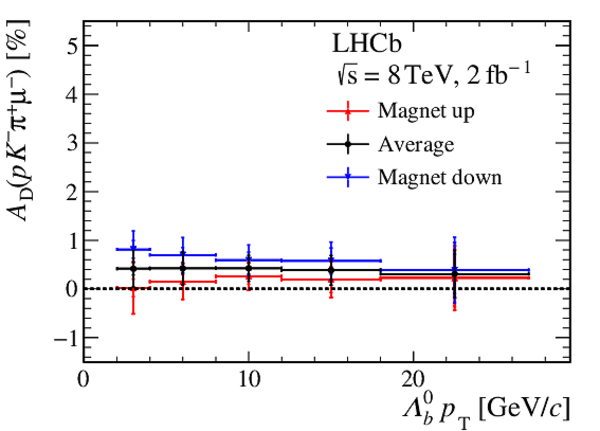
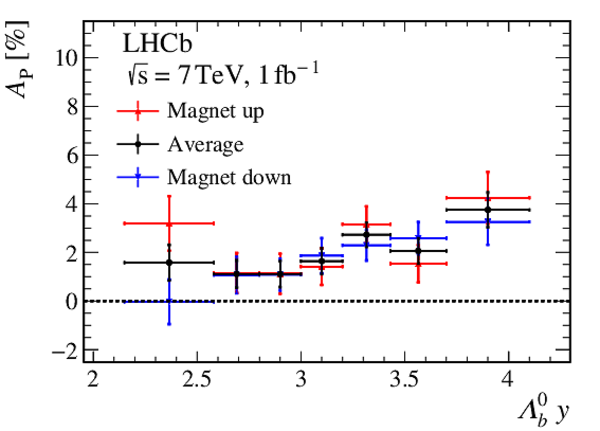
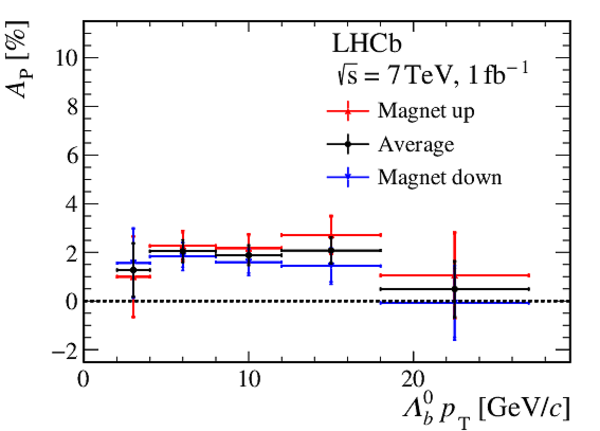
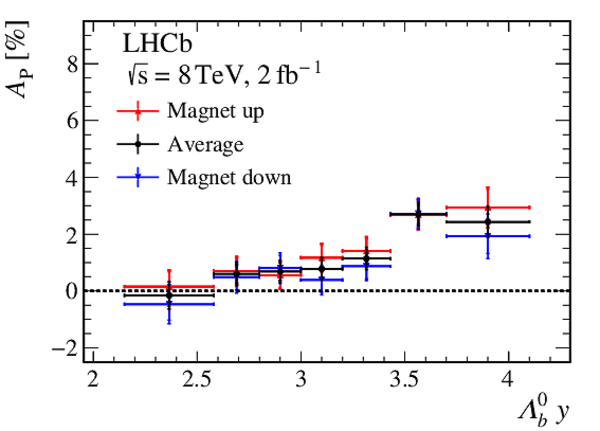
Measured raw asymmetry versus (left) rapidity and (right) $ p_{\mathrm{T}} $ for $\Lambda ^0_ b $ candidates from data taken at centre-of-mass energies of (top) $\sqrt{s} =7\text{ Te V} $ and (bottom) $\sqrt{s} =8\text{ Te V} $. The results are shown separately for (red upward triangles) magnet up, (blue downward triangles) magnet down and (black dots) their average. Uncertainties are statistical only. |
Fig4a.pdf [15 KiB] HiDef png [135 KiB] Thumbnail [134 KiB] *.C file |
|
|
Fig4b.pdf [15 KiB] HiDef png [132 KiB] Thumbnail [133 KiB] *.C file |

|
|
|
Fig4c.pdf [15 KiB] HiDef png [129 KiB] Thumbnail [126 KiB] *.C file |

|
|
|
Fig4d.pdf [15 KiB] HiDef png [128 KiB] Thumbnail [132 KiB] *.C file |
|
|
|
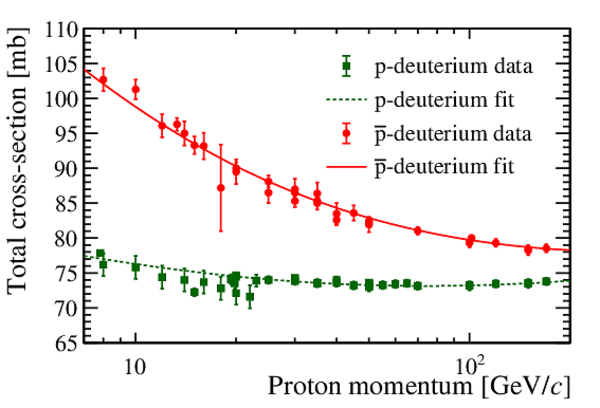
Measured total proton-deuterium and antiproton-deuterium cross-sections as function of proton momentum are shown with green squares and red dots, respectively. Fits according to the model described in the text are overlaid. Data are taken from Ref. [26]. |
Fig5.pdf [43 KiB] HiDef png [225 KiB] Thumbnail [197 KiB] *.C file |
|
|
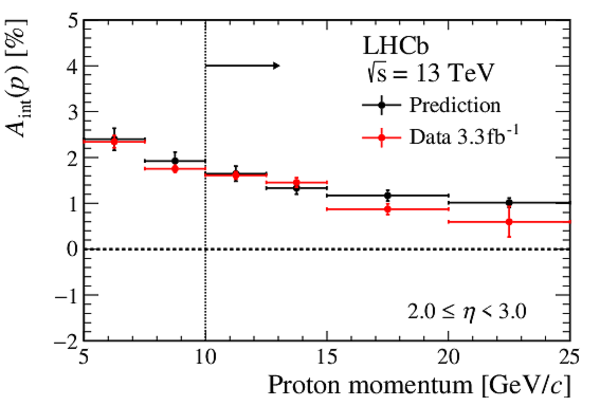
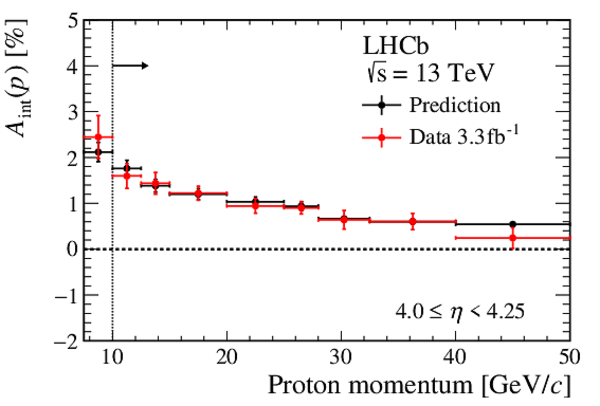
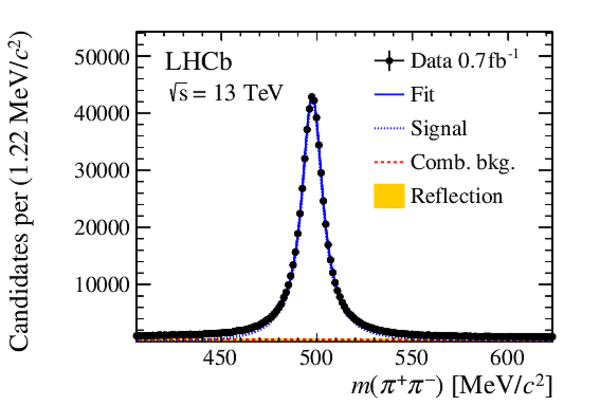
Proton-interaction asymmetry measured as difference in detection asymmetries between protons originating from $\Lambda \rightarrow p \pi ^- $ and pions from $ K ^0_{\mathrm{S}} \rightarrow \pi ^+ \pi ^- $ decays in 2017 and 2018 data, split in three intervals of pseudorapidity. The $\eta$ ranges are $[2, 3]$, $[3, 4]$ and $[4.00, 4.25]$ from top left to bottom. Also shown are the predictions from the proton-deuterium cross-sections. Model uncertainties shown here are a constant $10\%$ uncertainty due to the knowledge on the material budget [28]. These uncertainties are not used in the $\chi^{2}$ values reported in the text. The vertical line shows the lower cutoff in momentum used in the fit. |
Fig6a.pdf [15 KiB] HiDef png [138 KiB] Thumbnail [145 KiB] *.C file |
|
|
Fig6b.pdf [15 KiB] HiDef png [139 KiB] Thumbnail [144 KiB] *.C file |

|
|
|
Fig6c.pdf [15 KiB] HiDef png [148 KiB] Thumbnail [155 KiB] *.C file |
|
|
|
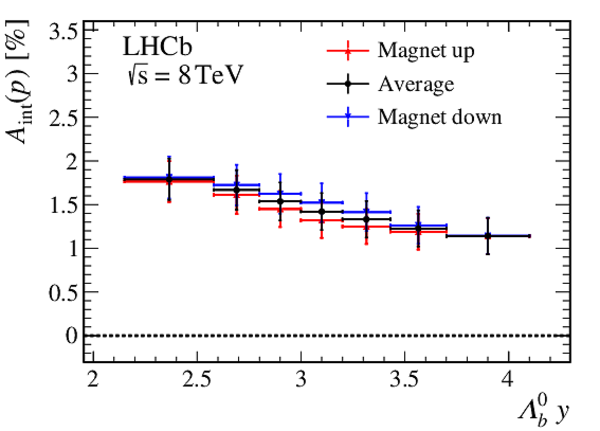
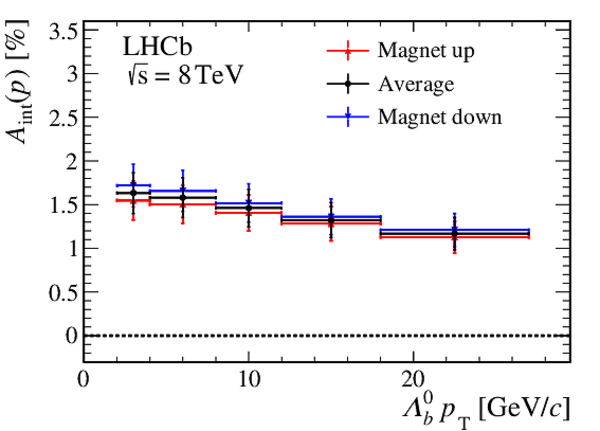
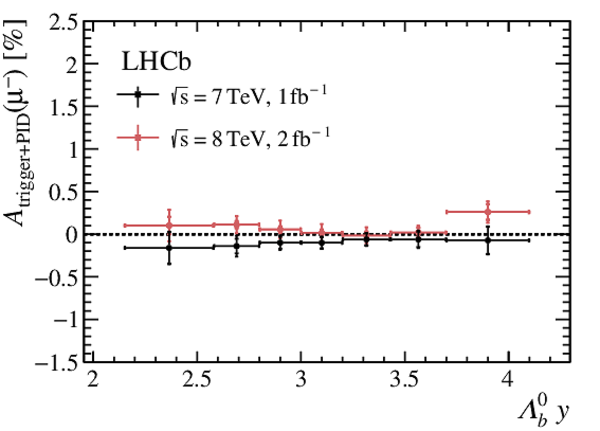
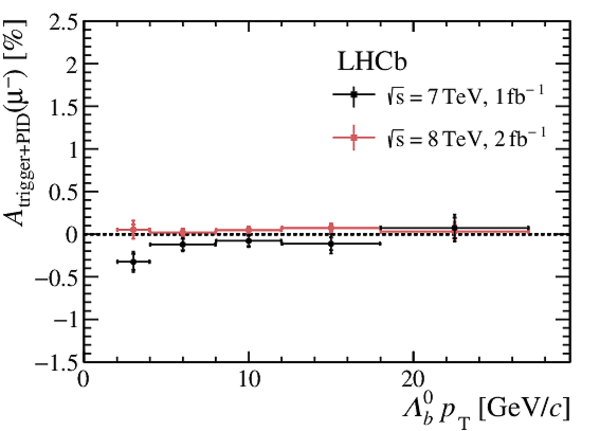
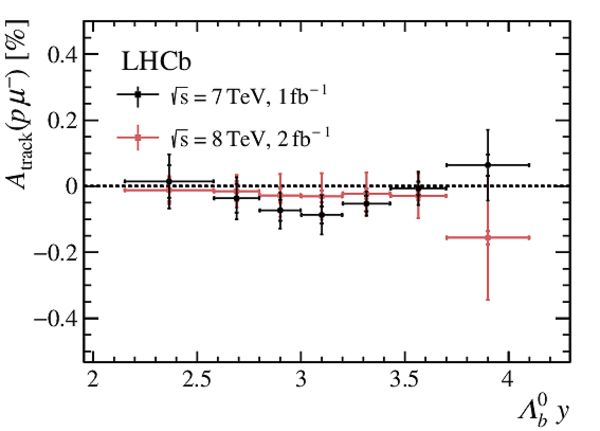
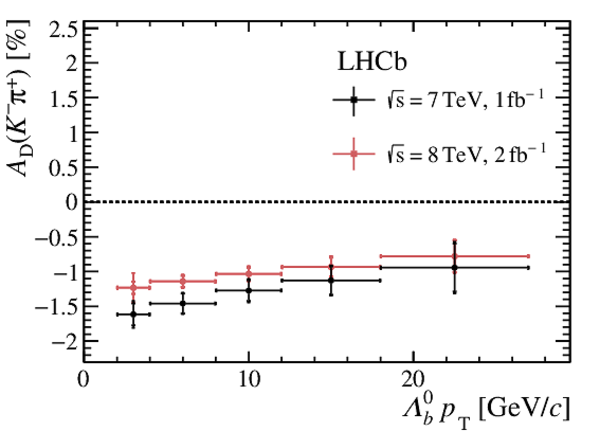
Proton-interaction asymmetry versus $\Lambda ^0_ b $ (left) rapidity and (right) $ p_{\mathrm{T}} $ for data taken at a centre-of-mass energy of $\sqrt{s} =8\text{ Te V} $. The results are shown separately for (red upward triangles) magnet up, (blue downward triangles) magnet down and (black dots) their average. |
Fig7a.pdf [16 KiB] HiDef png [139 KiB] Thumbnail [141 KiB] *.C file |
|
|
Fig7b.pdf [15 KiB] HiDef png [137 KiB] Thumbnail [140 KiB] *.C file |
|
|
|
Total correction due to detection asymmetries versus $\Lambda ^0_ b $ (left) rapidity and (right) $ p_{\mathrm{T}} $ for data taken at centre-of-mass energies of (top) $\sqrt{s} =7\text{ Te V} $ and (bottom) $\sqrt{s} =8\text{ Te V} $. The results are shown separately for the (red upward triangles) magnet-up sample, (blue downward triangles) magnet-down sample and (black dots) their average. The first bar indicates the statistical uncertainty and the second bar the total uncertainty. |
Fig8a.pdf [16 KiB] HiDef png [147 KiB] Thumbnail [146 KiB] *.C file |

|
|
Fig8b.pdf [15 KiB] HiDef png [140 KiB] Thumbnail [140 KiB] *.C file |
|
|
|
Fig8c.pdf [16 KiB] HiDef png [153 KiB] Thumbnail [148 KiB] *.C file |
|
|
|
Fig8d.pdf [15 KiB] HiDef png [143 KiB] Thumbnail [142 KiB] *.C file |
|
|
|
Measured $\Lambda ^0_ b $ production asymmetry versus (left) rapidity and (right) transverse momentum. The uncertainties are the quadratic sums of statistical and systematic uncertainties. The results in neighbouring intervals are correlated. |
Fig9a.pdf [16 KiB] HiDef png [129 KiB] Thumbnail [129 KiB] *.C file |

|
|
Fig9b.pdf [15 KiB] HiDef png [123 KiB] Thumbnail [128 KiB] *.C file |

|
|
|
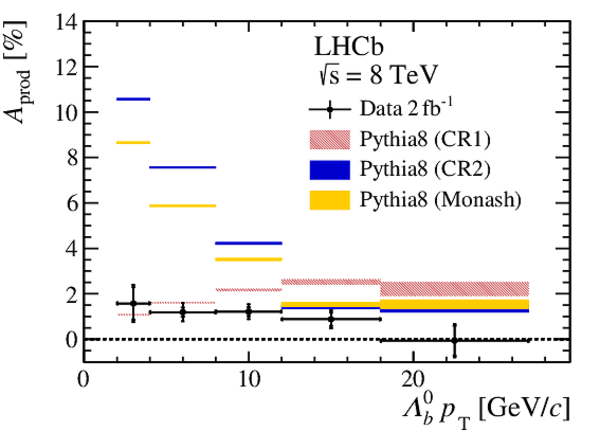
Comparison of the $\Lambda ^0_ b $ production asymmetry predicted by the various Pythia models, where CR1 refers to the QCD-inspired model and CR2 refers to the gluon-move model, and the measured production asymmetries. Results versus $\Lambda ^0_ b $ (left) rapidity $y$ and (right) $ p_{\mathrm{T}} $ are shown for centre-of-mass energies of (top) $\sqrt{s} =7\text{ Te V} $ and (bottom) $\sqrt{s} =8\text{ Te V} $. Uncertainties on the predictions are due to limited simulation sample sizes. |
Fig10a.pdf [17 KiB] HiDef png [199 KiB] Thumbnail [173 KiB] *.C file |

|
|
Fig10b.pdf [16 KiB] HiDef png [247 KiB] Thumbnail [180 KiB] *.C file |

|
|
|
Fig10c.pdf [17 KiB] HiDef png [199 KiB] Thumbnail [175 KiB] *.C file |

|
|
|
Fig10d.pdf [16 KiB] HiDef png [243 KiB] Thumbnail [180 KiB] *.C file |
|
|
|
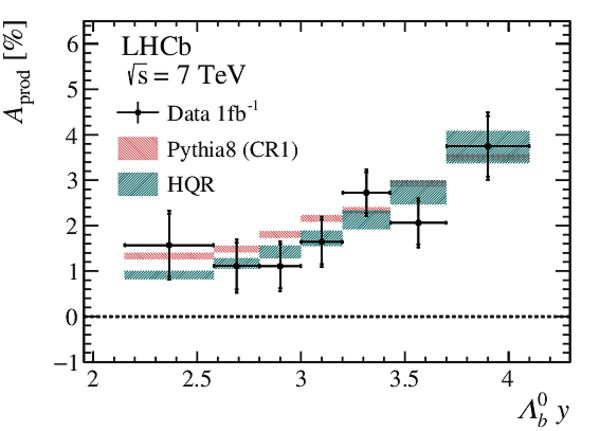
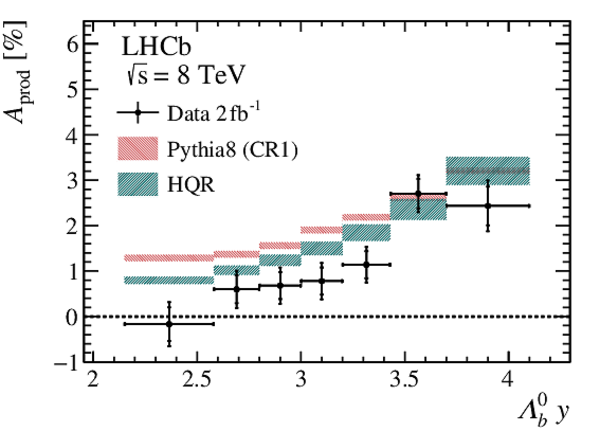
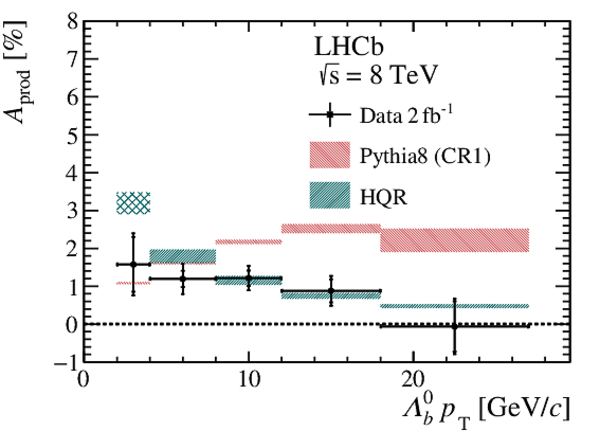
Comparison of the measured $\Lambda ^0_ b $ production asymmetry (points with error bars) with the predictions by the most compatible Pythia model and the heavy-quark recombination model (HQR). Results versus $\Lambda ^0_ b $ (left) rapidity $y$ and (right) $ p_{\mathrm{T}}$ are shown for centre-of-mass energies of (top) $\sqrt{s} =7\text{ Te V} $ and (bottom) $\sqrt{s} =8\text{ Te V} $. Uncertainties for the CR1 Pythia model are due to limited simulation sample sizes. Those from the heavy-quark recombination model are systematic as provided by the authors, and have the results in the lowest $ p_{\mathrm{T}}$ interval hatched as the authors claim their results are reliable only for $ p_{\mathrm{T}} > 5\text{ Ge V /}c $ [4,5]. |
Fig11a.pdf [19 KiB] HiDef png [407 KiB] Thumbnail [213 KiB] *.C file |
|
|
Fig11b.pdf [18 KiB] HiDef png [405 KiB] Thumbnail [225 KiB] *.C file |

|
|
|
Fig11c.pdf [19 KiB] HiDef png [398 KiB] Thumbnail [214 KiB] *.C file |
|
|
|
Fig11d.pdf [18 KiB] HiDef png [390 KiB] Thumbnail [223 KiB] *.C file |
|
|
|
Correlation coefficients of the total (statistical and systematic) uncertainty on the production asymmetry versus $\Lambda ^0_ b $ (top) rapidity and (bottom) transverse momentum. |
Fig12a.pdf [194 KiB] HiDef png [336 KiB] Thumbnail [230 KiB] *.C file |

|
|
Fig12b.pdf [193 KiB] HiDef png [202 KiB] Thumbnail [127 KiB] *.C file |

|
|
|
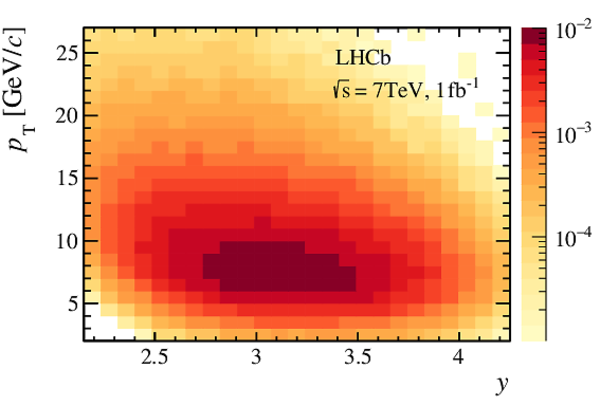
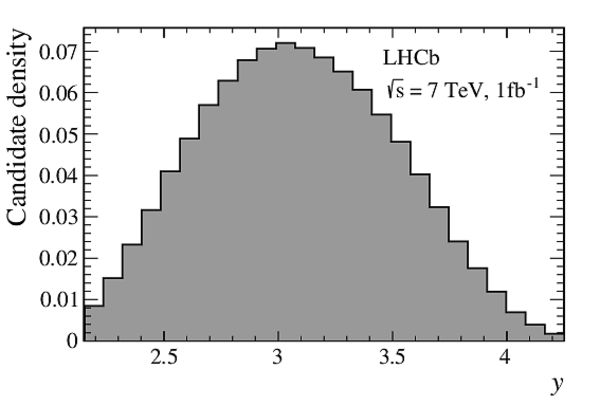
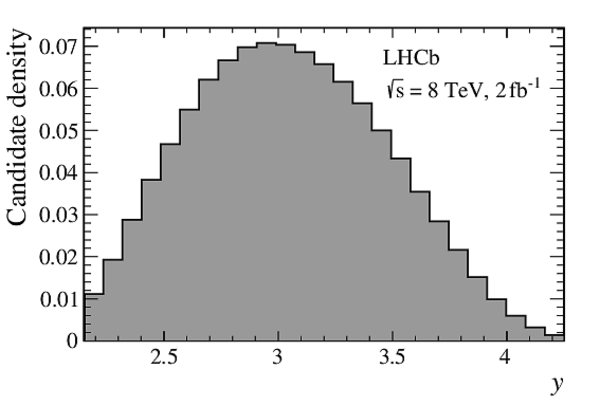
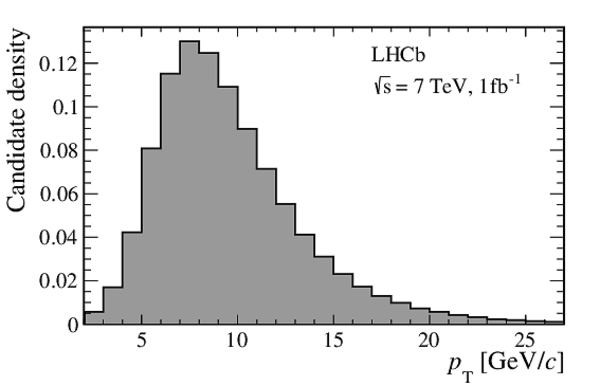
Measured, normalised distributions of $ p_{\mathrm{T}} , y$ from background-subtracted $\Lambda ^0_ b $ candidates for (left) $\sqrt{s} =7\text{ Te V} $ and (right) $\sqrt{s} =8\text{ Te V} $ data. The distributions are not corrected for the detector efficiency. Darker areas correspond to more densely populated regions. Below the two-dimensional histogram, the projections in $y$ and $ p_{\mathrm{T}} $ are shown. |
Fig13a.pdf [17 KiB] HiDef png [183 KiB] Thumbnail [167 KiB] *.C file |
|
|
Fig13b.pdf [17 KiB] HiDef png [182 KiB] Thumbnail [167 KiB] *.C file |

|
|
|
Fig13c.pdf [13 KiB] HiDef png [75 KiB] Thumbnail [47 KiB] *.C file |
|
|
|
Fig13d.pdf [13 KiB] HiDef png [76 KiB] Thumbnail [48 KiB] *.C file |
|
|
|
Fig13e.pdf [13 KiB] HiDef png [75 KiB] Thumbnail [46 KiB] *.C file |
|
|
|
Fig13f.pdf [13 KiB] HiDef png [75 KiB] Thumbnail [46 KiB] *.C file |

|
|
|
Measured $\Lambda ^0_ b $ production asymmetry versus (left) rapidity and (right) transverse momentum separately for data recorded at centre-of-mass energies of (top) 7 and (bottom) 8 $\text{ Te V}$ . The measured production asymmetries are shown separately for (red) magnet up, (blue) magnet down and their (black) average. The uncertainties are the quadratic sums of statistical and systematic uncertainties. |
Fig14a.pdf [16 KiB] HiDef png [137 KiB] Thumbnail [128 KiB] *.C file |
|
|
Fig14b.pdf [15 KiB] HiDef png [135 KiB] Thumbnail [128 KiB] *.C file |
|
|
|
Fig14c.pdf [16 KiB] HiDef png [135 KiB] Thumbnail [126 KiB] *.C file |
|
|
|
Fig14d.pdf [15 KiB] HiDef png [132 KiB] Thumbnail [124 KiB] *.C file |

|
|
|
Animated gif made out of all figures. |
PAPER-2021-016.gif Thumbnail |

|
Tables and captions
|
Parameters obtained in the description of the (anti)proton-deuterium cross-sections along with their uncertainties. |
Table_1.pdf [57 KiB] HiDef png [59 KiB] Thumbnail [28 KiB] tex code |

|
|
Ranges of the systematic uncertainties for the proton-detection asymmetry. |
Table_2.pdf [45 KiB] HiDef png [72 KiB] Thumbnail [32 KiB] tex code |

|
|
Absolute statistical and systematic uncertainties affecting the measurement, given in percent. The ranges are taken from the results in intervals of $\Lambda ^0_ b $ rapidity. |
Table_3.pdf [46 KiB] HiDef png [78 KiB] Thumbnail [35 KiB] tex code |

|
|
Measured $\Lambda ^0_ b $ production asymmetry in rapidity intervals. Values are given in percent. The first uncertainty is statistical, the second systematic. The uncertainties are partially correlated between rapidity intervals. |
Table_4.pdf [59 KiB] HiDef png [92 KiB] Thumbnail [47 KiB] tex code |

|
|
Measured $\Lambda ^0_ b $ production asymmetry in intervals of transverse momentum. Asymmetry values are given in percent. The first uncertainty is statistical, the second systematic. The uncertainties are partially correlated between transverse-momentum intervals. |
Table_5.pdf [60 KiB] HiDef png [68 KiB] Thumbnail [34 KiB] tex code |

|
|
Settings for the different Pythia 8 productions. CR stands for Colour Reconnection. Pythia version 8.303 is used. |
Table_6.pdf [35 KiB] HiDef png [55 KiB] Thumbnail [22 KiB] tex code |

|
Supplementary Material [file]


![HiDef png [131 KiB]](Directory_LHCb-PAPER-2021-016/hidef_Fig1.png)
![HiDef png [517 KiB]](Directory_LHCb-PAPER-2021-016/hidef_Fig2.png)
![HiDef png [201 KiB]](Directory_LHCb-PAPER-2021-016/hidef_Fig3a.png)
![HiDef png [200 KiB]](Directory_LHCb-PAPER-2021-016/hidef_Fig3b.png)
![HiDef png [195 KiB]](Directory_LHCb-PAPER-2021-016/hidef_Fig3c.png)
![HiDef png [194 KiB]](Directory_LHCb-PAPER-2021-016/hidef_Fig3d.png)
![HiDef png [135 KiB]](Directory_LHCb-PAPER-2021-016/hidef_Fig4a.png)
![HiDef png [132 KiB]](Directory_LHCb-PAPER-2021-016/hidef_Fig4b.png)
![HiDef png [129 KiB]](Directory_LHCb-PAPER-2021-016/hidef_Fig4c.png)
![HiDef png [128 KiB]](Directory_LHCb-PAPER-2021-016/hidef_Fig4d.png)
![HiDef png [225 KiB]](Directory_LHCb-PAPER-2021-016/hidef_Fig5.png)
![HiDef png [138 KiB]](Directory_LHCb-PAPER-2021-016/hidef_Fig6a.png)
![HiDef png [139 KiB]](Directory_LHCb-PAPER-2021-016/hidef_Fig6b.png)
![HiDef png [148 KiB]](Directory_LHCb-PAPER-2021-016/hidef_Fig6c.png)
![HiDef png [139 KiB]](Directory_LHCb-PAPER-2021-016/hidef_Fig7a.png)
![HiDef png [137 KiB]](Directory_LHCb-PAPER-2021-016/hidef_Fig7b.png)
![HiDef png [147 KiB]](Directory_LHCb-PAPER-2021-016/hidef_Fig8a.png)
![HiDef png [140 KiB]](Directory_LHCb-PAPER-2021-016/hidef_Fig8b.png)
![HiDef png [153 KiB]](Directory_LHCb-PAPER-2021-016/hidef_Fig8c.png)
![HiDef png [143 KiB]](Directory_LHCb-PAPER-2021-016/hidef_Fig8d.png)
![HiDef png [129 KiB]](Directory_LHCb-PAPER-2021-016/hidef_Fig9a.png)
![HiDef png [123 KiB]](Directory_LHCb-PAPER-2021-016/hidef_Fig9b.png)
![HiDef png [199 KiB]](Directory_LHCb-PAPER-2021-016/hidef_Fig10a.png)
![HiDef png [247 KiB]](Directory_LHCb-PAPER-2021-016/hidef_Fig10b.png)
![HiDef png [199 KiB]](Directory_LHCb-PAPER-2021-016/hidef_Fig10c.png)
![HiDef png [243 KiB]](Directory_LHCb-PAPER-2021-016/hidef_Fig10d.png)
![HiDef png [407 KiB]](Directory_LHCb-PAPER-2021-016/hidef_Fig11a.png)
![HiDef png [405 KiB]](Directory_LHCb-PAPER-2021-016/hidef_Fig11b.png)
![HiDef png [398 KiB]](Directory_LHCb-PAPER-2021-016/hidef_Fig11c.png)
![HiDef png [390 KiB]](Directory_LHCb-PAPER-2021-016/hidef_Fig11d.png)
![HiDef png [336 KiB]](Directory_LHCb-PAPER-2021-016/hidef_Fig12a.png)
![HiDef png [202 KiB]](Directory_LHCb-PAPER-2021-016/hidef_Fig12b.png)
![HiDef png [183 KiB]](Directory_LHCb-PAPER-2021-016/hidef_Fig13a.png)
![HiDef png [182 KiB]](Directory_LHCb-PAPER-2021-016/hidef_Fig13b.png)
![HiDef png [75 KiB]](Directory_LHCb-PAPER-2021-016/hidef_Fig13c.png)
![HiDef png [76 KiB]](Directory_LHCb-PAPER-2021-016/hidef_Fig13d.png)
![HiDef png [75 KiB]](Directory_LHCb-PAPER-2021-016/hidef_Fig13e.png)
![HiDef png [75 KiB]](Directory_LHCb-PAPER-2021-016/hidef_Fig13f.png)
![HiDef png [137 KiB]](Directory_LHCb-PAPER-2021-016/hidef_Fig14a.png)
![HiDef png [135 KiB]](Directory_LHCb-PAPER-2021-016/hidef_Fig14b.png)
![HiDef png [135 KiB]](Directory_LHCb-PAPER-2021-016/hidef_Fig14c.png)
![HiDef png [132 KiB]](Directory_LHCb-PAPER-2021-016/hidef_Fig14d.png)
![HiDef png [59 KiB]](Directory_LHCb-PAPER-2021-016/hidef_Table_1.png)
![HiDef png [72 KiB]](Directory_LHCb-PAPER-2021-016/hidef_Table_2.png)
![HiDef png [78 KiB]](Directory_LHCb-PAPER-2021-016/hidef_Table_3.png)
![HiDef png [92 KiB]](Directory_LHCb-PAPER-2021-016/hidef_Table_4.png)
![HiDef png [68 KiB]](Directory_LHCb-PAPER-2021-016/hidef_Table_5.png)
![HiDef png [55 KiB]](Directory_LHCb-PAPER-2021-016/hidef_Table_6.png)
![HiDef png [242 KiB]](Directory_LHCb-PAPER-2021-016/supplementary/hidef_Fig15a.png)
![HiDef png [210 KiB]](Directory_LHCb-PAPER-2021-016/supplementary/hidef_Fig15b.png)
![HiDef png [142 KiB]](Directory_LHCb-PAPER-2021-016/supplementary/hidef_Fig16a.png)
![HiDef png [138 KiB]](Directory_LHCb-PAPER-2021-016/supplementary/hidef_Fig16b.png)
![HiDef png [134 KiB]](Directory_LHCb-PAPER-2021-016/supplementary/hidef_Fig17a.png)
![HiDef png [132 KiB]](Directory_LHCb-PAPER-2021-016/supplementary/hidef_Fig17b.png)
![HiDef png [138 KiB]](Directory_LHCb-PAPER-2021-016/supplementary/hidef_Fig17c.png)
![HiDef png [131 KiB]](Directory_LHCb-PAPER-2021-016/supplementary/hidef_Fig17d.png)
![HiDef png [136 KiB]](Directory_LHCb-PAPER-2021-016/supplementary/hidef_Fig17e.png)
![HiDef png [132 KiB]](Directory_LHCb-PAPER-2021-016/supplementary/hidef_Fig17f.png)
![HiDef png [133 KiB]](Directory_LHCb-PAPER-2021-016/supplementary/hidef_Fig18a.png)
![HiDef png [139 KiB]](Directory_LHCb-PAPER-2021-016/supplementary/hidef_Fig18b.png)
![HiDef png [138 KiB]](Directory_LHCb-PAPER-2021-016/supplementary/hidef_Fig19a.png)
![HiDef png [134 KiB]](Directory_LHCb-PAPER-2021-016/supplementary/hidef_Fig19b.png)
Created on 27 April 2024.