Precision measurement of forward $Z$ boson production in proton-proton collisions at $\sqrt{s} = 13$ TeV
[to restricted-access page]Information
LHCb-PAPER-2021-037
CERN-EP-2021-246
arXiv:2112.07458 [PDF]
(Submitted on 14 Dec 2021)
JHEP 07 (2022) 26
Inspire 1990313
Tools
Abstract
A precision measurement of the $Z$ boson production cross-section at $\sqrt{s} = 13$ TeV in the forward region is presented, using $pp$ collision data collected by the LHCb detector, corresponding to an integrated luminosity of 5.1 fb$^{-1}$. The production cross-section is measured using $Z\rightarrow\mu^+\mu^-$ events within the fiducial region defined as pseudorapidity $2.0<\eta<4.5$ and transverse momentum $p_{T}>20$ GeV/$c$ for both muons and dimuon invariant mass $60<M_{\mu\mu}<120$ GeV/$c^2$. The integrated cross-section is determined to be \begin{equation*} \sigma(Z\rightarrow\mu^+\mu^-) = 196.4 \pm 0.2 \pm 1.6 \pm 3.9 pb, \end{equation*} where the first uncertainty is statistical, the second is systematic, and the third is due to the luminosity determination. The measured results are in agreement with theoretical predictions within uncertainties.
Figures and captions
|
Comparison of the invariant mass distribution between data and the sum of signal and background contributions for the selected $ Z \rightarrow \mu ^+\mu ^- $ candidates. |
InvMas[..].pdf [27 KiB] HiDef png [184 KiB] Thumbnail [163 KiB] *.C file |

|
|
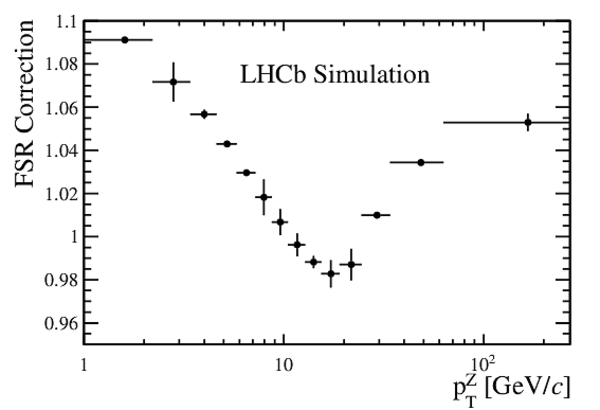
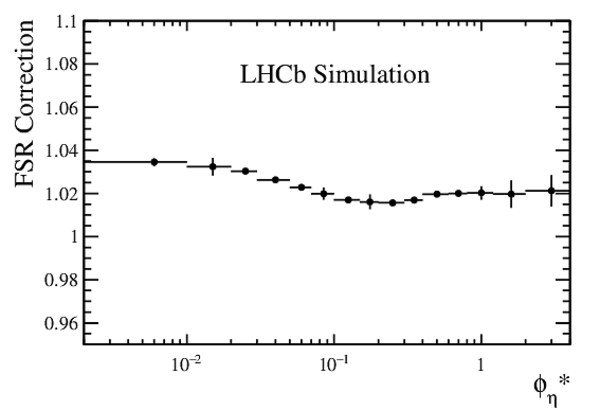
Final state radiation correction estimated for the (top-left) $ y^{\mathrm{Z}}$ , (top-right) $ p_{\mathrm{T}}^{Z}$ , and (bottom) $\phi_{\eta}^{*}$ differential cross-section measurements. The error bars represent the total (statistical and systematic) uncertainties. |
FSRRat[..].pdf [14 KiB] HiDef png [70 KiB] Thumbnail [44 KiB] *.C file |

|
|
FSRRat[..].pdf [14 KiB] HiDef png [72 KiB] Thumbnail [44 KiB] *.C file |
|
|
|
FSRRat[..].pdf [14 KiB] HiDef png [68 KiB] Thumbnail [44 KiB] *.C file |
|
|
|
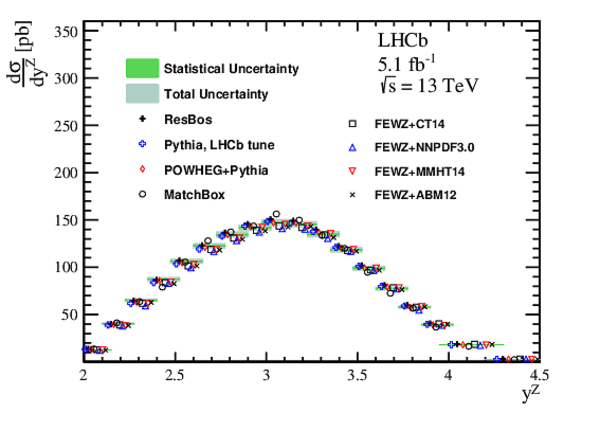
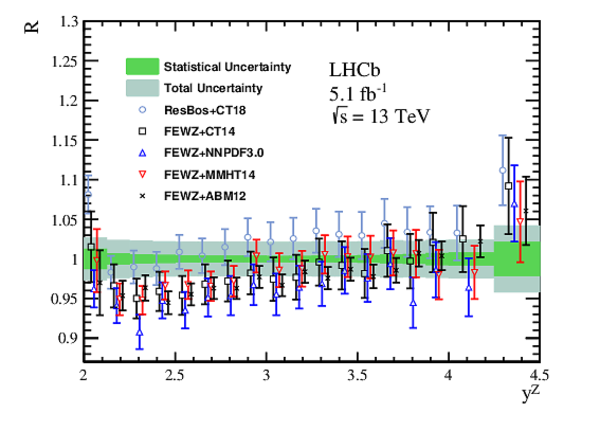
(Top) Measured single differential cross-section in regions of $ y^{\mathrm{Z}}$ , compared with different theoretical predictions. In order to present the measurements more clearly, data bands are drawn wider than the width of the interval. (Bottom) Ratio of theoretical predictions to measured values, with the horizontal bars showing the uncertainty from the PDFs. |
XSecti[..].pdf [20 KiB] HiDef png [244 KiB] Thumbnail [183 KiB] *.C file |
|
|
XSecti[..].pdf [20 KiB] HiDef png [305 KiB] Thumbnail [240 KiB] *.C file |
|
|
|
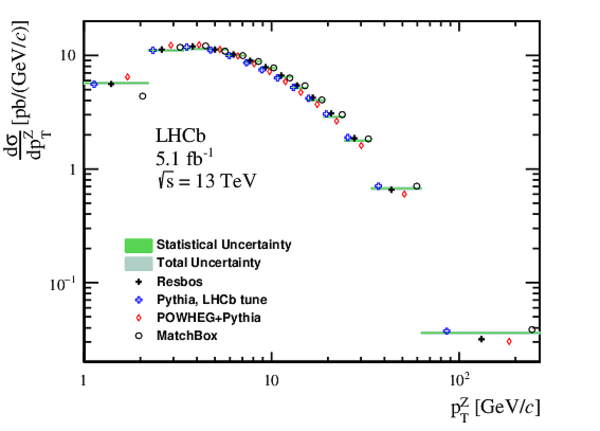
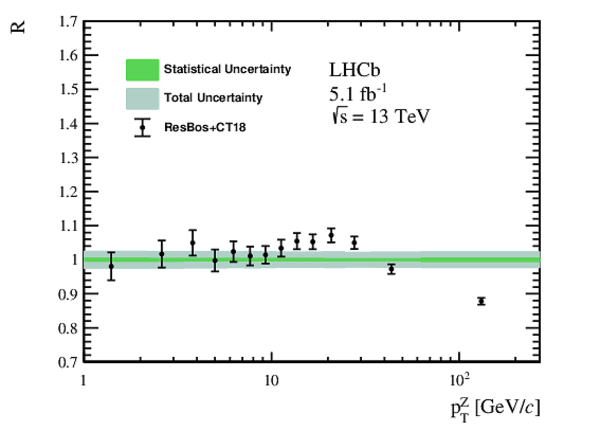
(Top) Measured single differential cross-section in regions of $ p_{\mathrm{T}}^{Z}$ , compared with different theoretical predictions. (Bottom) Ratio of ResBos predictions to measurement, with the horizontal bars showing the uncertainty from the PDFs. |
XSecti[..].pdf [17 KiB] HiDef png [159 KiB] Thumbnail [129 KiB] *.C file |
|
|
XSecti[..].pdf [16 KiB] HiDef png [118 KiB] Thumbnail [124 KiB] *.C file |
|
|
|
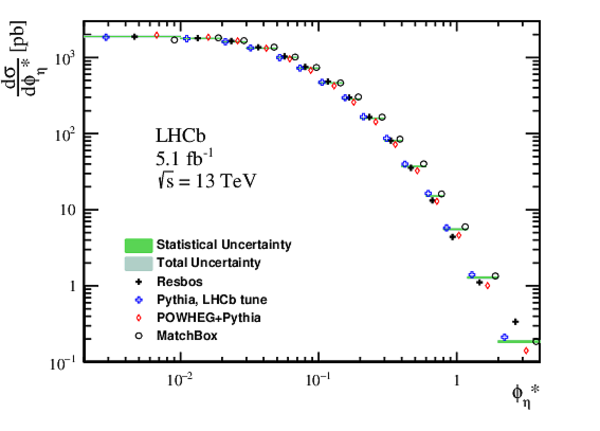
(Top) Measured single differential cross-section in regions of $\phi_{\eta}^{*}$ , compared with different theoretical predictions. (Bottom) Ratio of ResBos predictions to measurement, with the horizontal bars showing the uncertainty from the PDFs. |
XSecti[..].pdf [17 KiB] HiDef png [160 KiB] Thumbnail [134 KiB] *.C file |
|
|
XSecti[..].pdf [15 KiB] HiDef png [105 KiB] Thumbnail [104 KiB] *.C file |

|
|
|
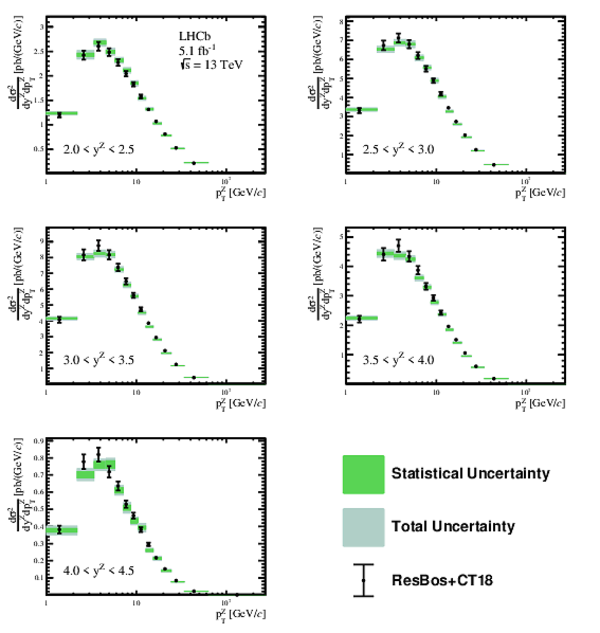
Measured double differential cross-section as a function of $ p_{\mathrm{T}}^{Z}$ in regions of $ y^{\mathrm{Z}}$ , compared with ResBos predictions, with the horizontal bars showing the uncertainty from the PDFs. |
XSecti[..].pdf [25 KiB] HiDef png [302 KiB] Thumbnail [268 KiB] *.C file |
|
|
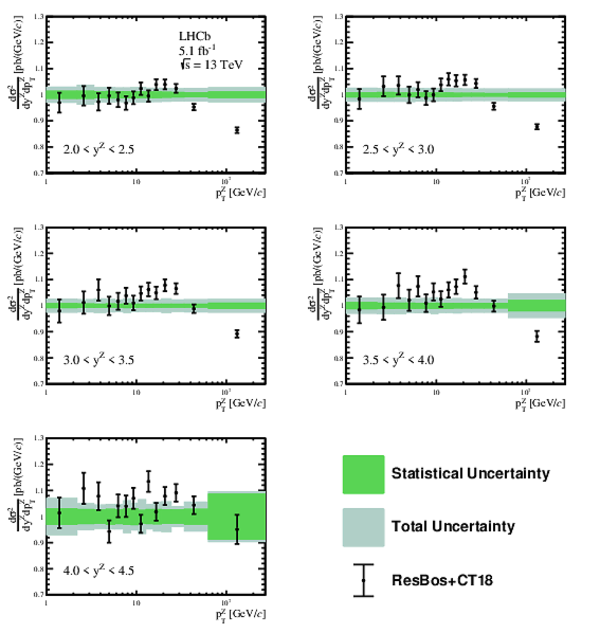
Ratios of ResBos predictions to measurements as a function of $ p_{\mathrm{T}}^{Z}$ in regions of $ y^{\mathrm{Z}}$ , with the horizontal bars showing the uncertainty from the PDFs. |
XSecti[..].pdf [25 KiB] HiDef png [323 KiB] Thumbnail [301 KiB] *.C file |
|
|
Measured double differential cross-section as a function of $\phi_{\eta}^{*}$ in regions of $ y^{\mathrm{Z}}$ , compared with ResBos predictions, with the horizontal bars showing the uncertainty from the PDFs. |
XSecti[..].pdf [25 KiB] HiDef png [272 KiB] Thumbnail [248 KiB] *.C file |

|
|
Ratios of ResBos predictions to measurements as a function of $\phi_{\eta}^{*}$ in regions of $ y^{\mathrm{Z}}$ , with the horizontal bars showing the uncertainty from the PDFs. |
XSecti[..].pdf [25 KiB] HiDef png [253 KiB] Thumbnail [234 KiB] *.C file |

|
|
Comparison of the integrated cross-section, $\sigma_{ Z \rightarrow \mu ^+\mu ^- }$, between data and theoretical predictions. The bands correspond to the data, with the inner band corresponding to the statistical uncertainty and the outer bands corresponding to the systematic uncertainty and total uncertainty. The open circles correspond to the different theoretical predictions. The diamond point corresponds to the previous LHCb measurement \cite{LHCb-PAPER-2016-021}. |
Total_XSec.pdf [14 KiB] HiDef png [195 KiB] Thumbnail [179 KiB] *.C file |

|
|
Final state radiation correction estimated for double differential cross section measurement for (left) $ y^{\mathrm{Z}} - p_{\mathrm{T}}^{Z} $ measurement, and for (right) $ y^{\mathrm{Z}} -\phi_{\eta}^{*} $ measurement. |
FSRRat[..].pdf [14 KiB] HiDef png [100 KiB] Thumbnail [92 KiB] *.C file |

|
|
FSRRat[..].pdf [14 KiB] HiDef png [98 KiB] Thumbnail [88 KiB] *.C file |

|
|
|
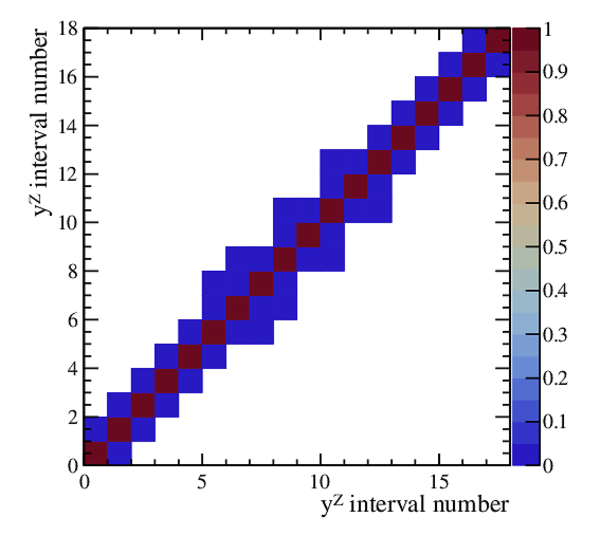
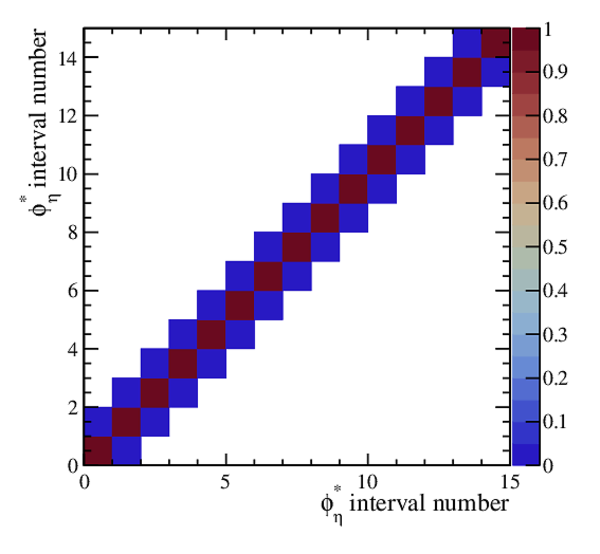
Statistical correlation matrix of the cross-section measurements in one-dimensional interval regions of (top-left) $ y^{\mathrm{Z}}$ , (top-right) $ p_{\mathrm{T}}^{Z}$ and (bottom) $\phi_{\eta}^{*}$ . More details about the `interval number' can be found from Table ??? and Table ???. |
Correl[..].pdf [14 KiB] HiDef png [134 KiB] Thumbnail [132 KiB] *.C file |
|
|
Correl[..].pdf [14 KiB] HiDef png [133 KiB] Thumbnail [131 KiB] *.C file |

|
|
|
Correl[..].pdf [14 KiB] HiDef png [126 KiB] Thumbnail [120 KiB] *.C file |
|
|
|
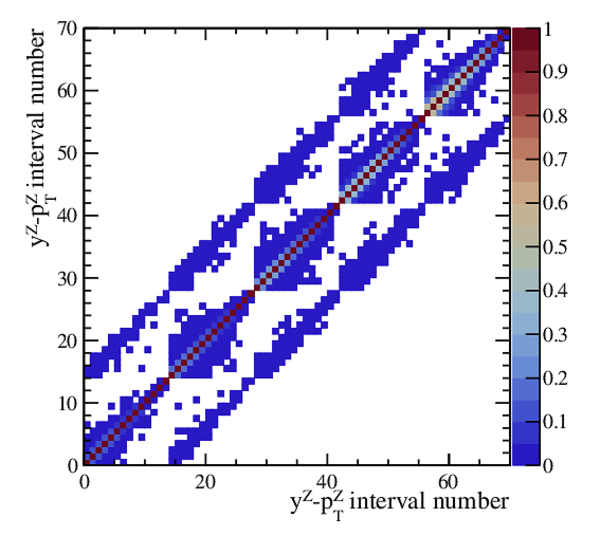
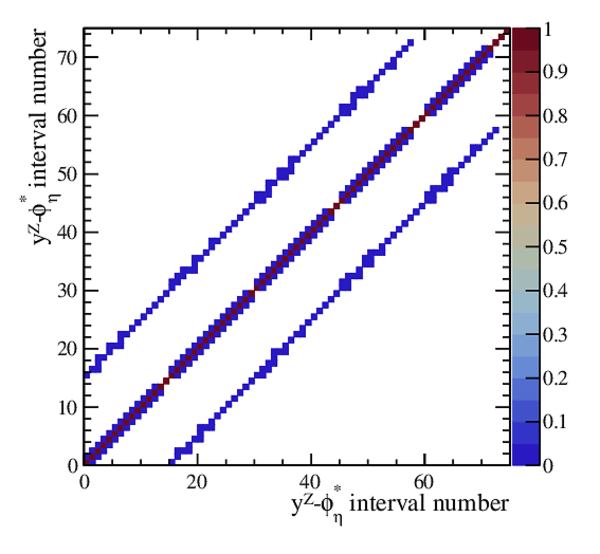
Statistical correlation matrix of the cross-section measurements in two-dimensional interval regions of (left) $ y^{\mathrm{Z}} - p_{\mathrm{T}}^{Z} $ and (right) $ y^{\mathrm{Z}} -\phi_{\eta}^{*} $. More details about the `interval number' can be found in Table ??? and Table ???. |
Correl[..].pdf [19 KiB] HiDef png [269 KiB] Thumbnail [324 KiB] *.C file |
|
|
Correl[..].pdf [16 KiB] HiDef png [213 KiB] Thumbnail [226 KiB] *.C file |
|
|
|
Correlation matrix of efficiencies uncertainty for one-dimensional (top-left) $ y^{\mathrm{Z}}$ , (top-right) $ p_{\mathrm{T}}^{Z}$ and (bottom) $\phi_{\eta}^{*}$ measurements. More details about the `interval number' can be found in Table ??? and Table ???. |
Correl[..].pdf [16 KiB] HiDef png [195 KiB] Thumbnail [178 KiB] *.C file |

|
|
Correl[..].pdf [14 KiB] HiDef png [137 KiB] Thumbnail [129 KiB] *.C file |

|
|
|
Correl[..].pdf [15 KiB] HiDef png [166 KiB] Thumbnail [151 KiB] *.C file |

|
|
|
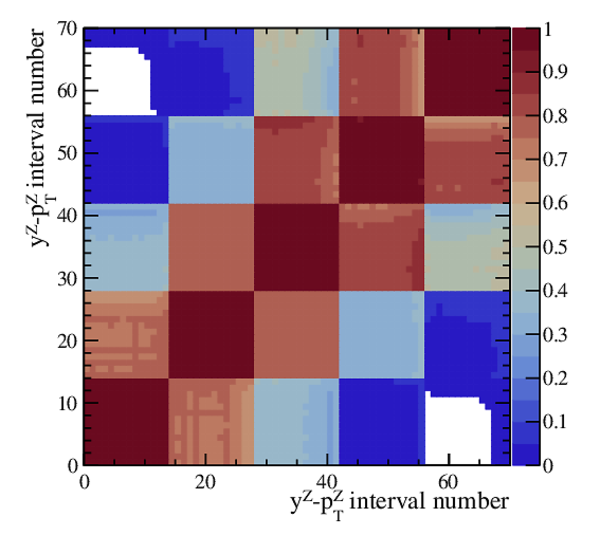
Correlation matrix of efficiencies uncertainty for two-dimensional (left) $ y^{\mathrm{Z}} - p_{\mathrm{T}}^{Z} $ and (right) $ y^{\mathrm{Z}} -\phi_{\eta}^{*} $ measurements. More details about the `interval number' can be found in Table ??? and Table ???. |
Correl[..].pdf [32 KiB] HiDef png [273 KiB] Thumbnail [486 KiB] *.C file |
|
|
Correl[..].pdf [36 KiB] HiDef png [364 KiB] Thumbnail [578 KiB] *.C file |

|
|
|
Animated gif made out of all figures. |
PAPER-2021-037.gif Thumbnail |

|
![HiDef png [184 KiB]](Directory_LHCb-PAPER-2021-037/hidef_InvMass_Z_Paper.png)
![HiDef png [70 KiB]](Directory_LHCb-PAPER-2021-037/hidef_FSRRatio_1D_ZRapidity.png)
![HiDef png [72 KiB]](Directory_LHCb-PAPER-2021-037/hidef_FSRRatio_1D_ZPT.png)
![HiDef png [68 KiB]](Directory_LHCb-PAPER-2021-037/hidef_FSRRatio_1D_ZPHI.png)
![HiDef png [244 KiB]](Directory_LHCb-PAPER-2021-037/hidef_XSection_Rapidity.png)
![HiDef png [305 KiB]](Directory_LHCb-PAPER-2021-037/hidef_XSection_Ratio_Rapidity.png)
![HiDef png [159 KiB]](Directory_LHCb-PAPER-2021-037/hidef_XSection_PT.png)
![HiDef png [118 KiB]](Directory_LHCb-PAPER-2021-037/hidef_XSection_Ratio_ZPT.png)
![HiDef png [160 KiB]](Directory_LHCb-PAPER-2021-037/hidef_XSection_PHI.png)
![HiDef png [105 KiB]](Directory_LHCb-PAPER-2021-037/hidef_XSection_Ratio_ZPHI.png)
![HiDef png [302 KiB]](Directory_LHCb-PAPER-2021-037/hidef_XSection_Rapidity_PT.png)
![HiDef png [323 KiB]](Directory_LHCb-PAPER-2021-037/hidef_XSection_Ratio_ZRapidityZPT.png)
![HiDef png [272 KiB]](Directory_LHCb-PAPER-2021-037/hidef_XSection_Rapidity_PHI.png)
![HiDef png [253 KiB]](Directory_LHCb-PAPER-2021-037/hidef_XSection_Ratio_ZRapidityZPHI.png)
![HiDef png [195 KiB]](Directory_LHCb-PAPER-2021-037/hidef_Total_XSec.png)
![HiDef png [100 KiB]](Directory_LHCb-PAPER-2021-037/hidef_FSRRatio_2D_ZRapidity_ZPT.png)
![HiDef png [98 KiB]](Directory_LHCb-PAPER-2021-037/hidef_FSRRatio_2D_ZRapidity_ZPHI.png)
![HiDef png [134 KiB]](Directory_LHCb-PAPER-2021-037/hidef_Correlation_Stat_ZRapidity_1D.png)
![HiDef png [133 KiB]](Directory_LHCb-PAPER-2021-037/hidef_Correlation_Stat_ZPT_1D.png)
![HiDef png [126 KiB]](Directory_LHCb-PAPER-2021-037/hidef_Correlation_Stat_ZPHI_1D.png)
![HiDef png [269 KiB]](Directory_LHCb-PAPER-2021-037/hidef_Correlation_Stat_ZRapidity_ZPT_2D.png)
![HiDef png [213 KiB]](Directory_LHCb-PAPER-2021-037/hidef_Correlation_Stat_ZRapidity_ZPHI_2D.png)
![HiDef png [195 KiB]](Directory_LHCb-PAPER-2021-037/hidef_Correlation_Syst_ZRapidity_1D.png)
![HiDef png [137 KiB]](Directory_LHCb-PAPER-2021-037/hidef_Correlation_Syst_ZPT_1D.png)
![HiDef png [166 KiB]](Directory_LHCb-PAPER-2021-037/hidef_Correlation_Syst_ZPHI_1D.png)
![HiDef png [273 KiB]](Directory_LHCb-PAPER-2021-037/hidef_Correlation_Syst_ZRapidity_ZPT_2D.png)
![HiDef png [364 KiB]](Directory_LHCb-PAPER-2021-037/hidef_Correlation_Syst_ZRapidity_ZPHI_2D.png)
Tables and captions
|
Relative uncertainty for the integrated $ Z \rightarrow \mu ^+\mu ^- $ cross-section measurement. The total uncertainty is the quadratic sum of uncertainties from statistical, systematic and luminosity contributions. |
Table_1.pdf [42 KiB] HiDef png [90 KiB] Thumbnail [41 KiB] tex code |

|
|
Final state radiation correction used in the $ y^{\mathrm{Z}}$ cross-section measurement. The first uncertainty is statistical and the second is systematic. |
Table_2.pdf [51 KiB] HiDef png [218 KiB] Thumbnail [110 KiB] tex code |

|
|
Final state radiation correction used in the $ p_{\mathrm{T}}^{Z}$ cross-section measurement. The first uncertainty is statistical and the second is systematic. |
Table_3.pdf [59 KiB] HiDef png [161 KiB] Thumbnail [81 KiB] tex code |

|
|
Final state radiation correction used in the $\phi_{\eta}^{*}$ cross-section measurement. The first uncertainty is statistical and the second is systematic. |
Table_4.pdf [58 KiB] HiDef png [174 KiB] Thumbnail [87 KiB] tex code |

|
|
Correlation matrix of statistical uncertainty for one-dimensional $ y^{\mathrm{Z}}$ measurement. |
Table_5.pdf [30 KiB] HiDef png [88 KiB] Thumbnail [21 KiB] tex code |

|
|
Correlation matrix of statistical uncertainty for one-dimensional $ p_{\mathrm{T}}^{Z}$ measurement. |
Table_6.pdf [30 KiB] HiDef png [76 KiB] Thumbnail [31 KiB] tex code |

|
|
Correlation matrix of statistical uncertainty for one-dimensional $\phi_{\eta}^{*}$ measurement. |
Table_7.pdf [30 KiB] HiDef png [83 KiB] Thumbnail [31 KiB] tex code |

|
|
Correlation matrix of efficiency uncertainty for one-dimensional $ y^{\mathrm{Z}}$ measurement. |
Table_8.pdf [30 KiB] HiDef png [93 KiB] Thumbnail [30 KiB] tex code |

|
|
Correlation matrix of efficiency uncertainty for one-dimensional $ p_{\mathrm{T}}^{Z}$ measurement. |
Table_9.pdf [30 KiB] HiDef png [71 KiB] Thumbnail [31 KiB] tex code |

|
|
Correlation matrix of efficiency uncertainty for one-dimensional $\phi_{\eta}^{*}$ measurement. |
Table_10.pdf [30 KiB] HiDef png [82 KiB] Thumbnail [32 KiB] tex code |

|
|
Measured total $ Z $ -boson cross-section for different datasets. The first uncertainty is statistical, the second systematic, and the third is due to the luminosity. |
Table_11.pdf [59 KiB] HiDef png [89 KiB] Thumbnail [43 KiB] tex code |

|
|
Measured single differential cross-sections in interval regions of $ y^{\mathrm{Z}}$ . The first uncertainty is statistical, the second systematic, and the third is due to the luminosity. |
Table_12.pdf [59 KiB] HiDef png [178 KiB] Thumbnail [87 KiB] tex code |

|
|
Measured single differential cross-sections in interval regions of $ p_{\mathrm{T}}^{Z}$ . The first uncertainty is statistical, the second systematic, and the third is due to the luminosity. |
Table_13.pdf [67 KiB] HiDef png [99 KiB] Thumbnail [60 KiB] tex code |

|
|
Measured single differential cross-sections in interval regions of $\phi_{\eta}^{*}$ . The first uncertainty is statistical, the second systematic, and the third is due to the luminosity. |
Table_14.pdf [66 KiB] HiDef png [128 KiB] Thumbnail [67 KiB] tex code |

|
|
Systematic uncertainties in the single differential cross-sections in interval regions of $ y^{\mathrm{Z}}$ , presented in percentage. The contributions from efficiency (Eff), background (BKG), final state radiation (FSR), closure test (Closure), and alignment and calibration (Alignment) are shown. |
Table_15.pdf [54 KiB] HiDef png [185 KiB] Thumbnail [91 KiB] tex code |

|
|
Systematic uncertainties in the single differential cross-sections in interval regions of $ p_{\mathrm{T}}^{Z}$ , presented in percentage. The contributions from efficiency (Eff), background (BKG), final state radiation (FSR), closure test (Closure), unfolding (Unfold), and alignment and calibration (Alignment) are shown. |
Table_16.pdf [62 KiB] HiDef png [129 KiB] Thumbnail [62 KiB] tex code |

|
|
Systematic uncertainties in the single differential cross-sections in interval regions of $\phi_{\eta}^{*}$ , presented in percentage. The contributions from efficiency (Eff), background (BKG), final state radiation (FSR), closure test (Closure), and alignment and calibration (Alignment) are shown. |
Table_17.pdf [61 KiB] HiDef png [145 KiB] Thumbnail [71 KiB] tex code |

|
![HiDef png [90 KiB]](Directory_LHCb-PAPER-2021-037/hidef_Table_1.png)
![HiDef png [218 KiB]](Directory_LHCb-PAPER-2021-037/hidef_Table_2.png)
![HiDef png [161 KiB]](Directory_LHCb-PAPER-2021-037/hidef_Table_3.png)
![HiDef png [174 KiB]](Directory_LHCb-PAPER-2021-037/hidef_Table_4.png)
![HiDef png [88 KiB]](Directory_LHCb-PAPER-2021-037/hidef_Table_5.png)
![HiDef png [76 KiB]](Directory_LHCb-PAPER-2021-037/hidef_Table_6.png)
![HiDef png [83 KiB]](Directory_LHCb-PAPER-2021-037/hidef_Table_7.png)
![HiDef png [93 KiB]](Directory_LHCb-PAPER-2021-037/hidef_Table_8.png)
![HiDef png [71 KiB]](Directory_LHCb-PAPER-2021-037/hidef_Table_9.png)
![HiDef png [82 KiB]](Directory_LHCb-PAPER-2021-037/hidef_Table_10.png)
![HiDef png [89 KiB]](Directory_LHCb-PAPER-2021-037/hidef_Table_11.png)
![HiDef png [178 KiB]](Directory_LHCb-PAPER-2021-037/hidef_Table_12.png)
![HiDef png [99 KiB]](Directory_LHCb-PAPER-2021-037/hidef_Table_13.png)
![HiDef png [128 KiB]](Directory_LHCb-PAPER-2021-037/hidef_Table_14.png)
![HiDef png [185 KiB]](Directory_LHCb-PAPER-2021-037/hidef_Table_15.png)
![HiDef png [129 KiB]](Directory_LHCb-PAPER-2021-037/hidef_Table_16.png)
![HiDef png [145 KiB]](Directory_LHCb-PAPER-2021-037/hidef_Table_17.png)
Created on 27 April 2024.