Measurement of the charm mixing parameter $y_{CP} - y_{CP}^{K\pi}$ using two-body $D^0$ meson decays
[to restricted-access page]Information
LHCb-PAPER-2021-041
CERN-EP-2022-022
arXiv:2202.09106 [PDF]
(Submitted on 18 Feb 2022)
Phys. Rev. D 105, 092013
Inspire 2035063
Tools
Abstract
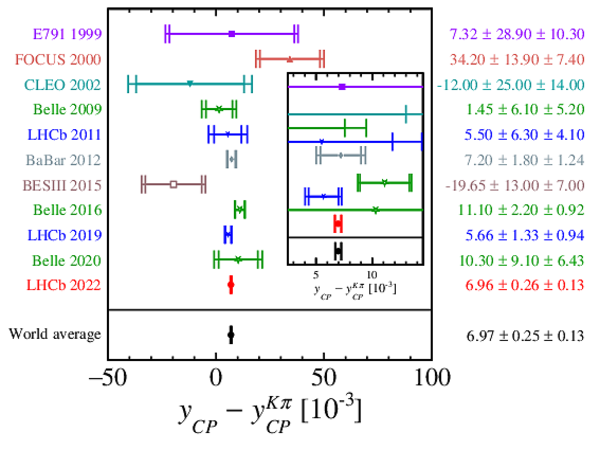
A measurement of the ratios of the effective decay widths of $D^0 \to \pi^-\pi^+$ and $D^0 \to K^-K^+$ decays over that of $D^0 \to K^-\pi^+$ decays is performed with the LHCb experiment using proton-proton collisions at a centre-of-mass energy of $13 \mathrm{TeV}$, corresponding to an integrated luminosity of $6 \mathrm{fb^{-1}}$. These observables give access to the charm mixing parameters $y_{CP}^{\pi\pi} - y_{CP}^{K\pi}$ and $y_{CP}^{KK} - y_{CP}^{K\pi}$, and are measured as $y_{CP}^{\pi\pi} - y_{CP}^{K\pi} = (6.57 \pm 0.53 \pm 0.16) \times 10^{-3}$, $y_{CP}^{KK} - y_{CP}^{K\pi} = (7.08 \pm 0.30 \pm 0.14) \times 10^{-3}$, where the first uncertainties are statistical and the second systematic. The combination of the two measurements is $y_{CP} - y_{CP}^{K\pi} = (6.96 \pm 0.26 \pm 0.13) \times 10^{-3}$, which is four times more precise than the previous world average.
Figures and captions
|
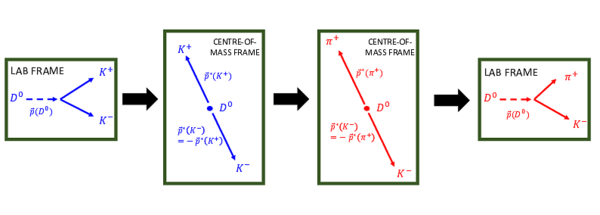
Sketch of a $ D ^0 \rightarrow K ^- K ^+ $ to $ D ^0 \rightarrow K ^- \pi ^+ $ matching. |
Fig1.pdf [34 KiB] HiDef png [96 KiB] Thumbnail [52 KiB] *.C file |
|
|
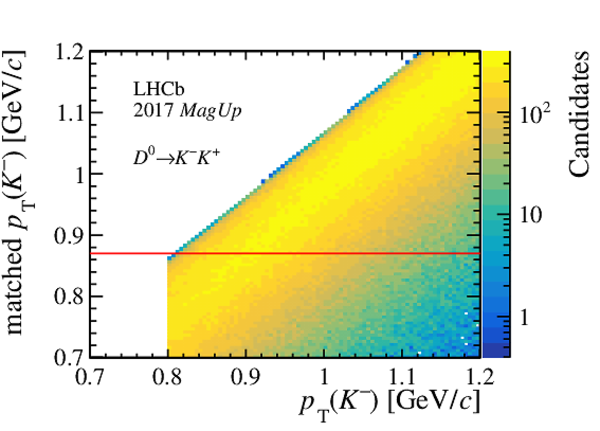
Matched versus original transverse momenta for the matching of a $K^-$ to a $\pi^-$ particle, related to the $ y_{ C P } ^{CC}$ measurement. The red line represents the requirement applied to the data sample, where candidates below the line are rejected. The plot is obtained with the 2017 MagUp sample. |
Fig2.pdf [40 KiB] HiDef png [576 KiB] Thumbnail [425 KiB] *.C file |
|
|
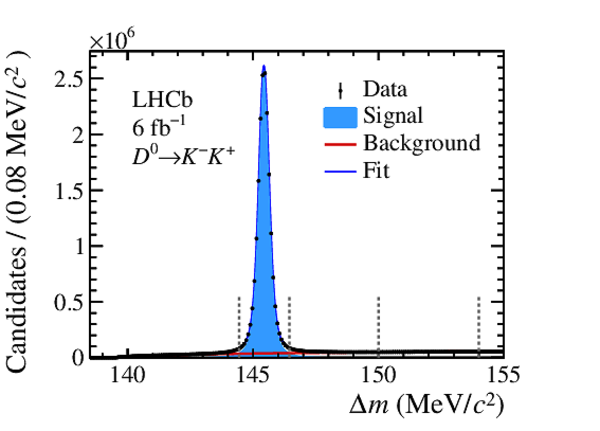
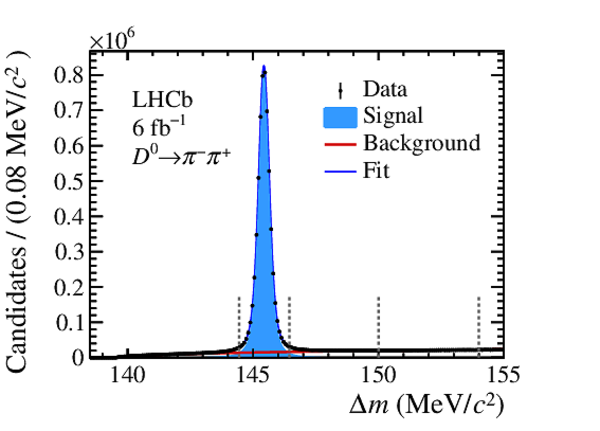
Distributions of $\Delta m$ for the (top) $ D ^0 \rightarrow K ^- \pi ^+ $ , (centre) $ D ^0 \rightarrow K ^- K ^+ $ , and (bottom) $ D ^0 \rightarrow \pi ^- \pi ^+ $ decay channels for the combined data sample. The signal and sideband regions employed to subtract the combinatorial background are delimited by the dashed vertical lines. The sum of the fit projections are overlaid. |
Fig3a.pdf [81 KiB] HiDef png [176 KiB] Thumbnail [144 KiB] *.C file |

|
|
Fig3b.pdf [82 KiB] HiDef png [183 KiB] Thumbnail [154 KiB] *.C file |
|
|
|
Fig3c.pdf [83 KiB] HiDef png [199 KiB] Thumbnail [171 KiB] *.C file |
|
|
|
(Left) fraction and (right) average true $ D ^0 $ decay time of secondary decays as a function of the reconstructed $ D ^0 $ decay time, in units of the average $ D ^0 $ lifetime. |
Fig4a.pdf [14 KiB] HiDef png [67 KiB] Thumbnail [39 KiB] *.C file |

|
|
Fig4b.pdf [15 KiB] HiDef png [106 KiB] Thumbnail [96 KiB] *.C file |

|
|
|
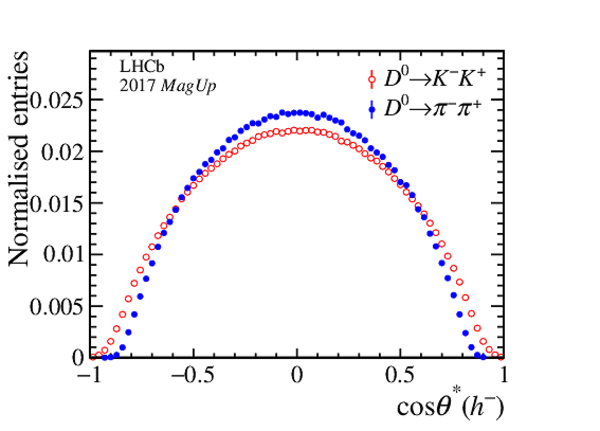
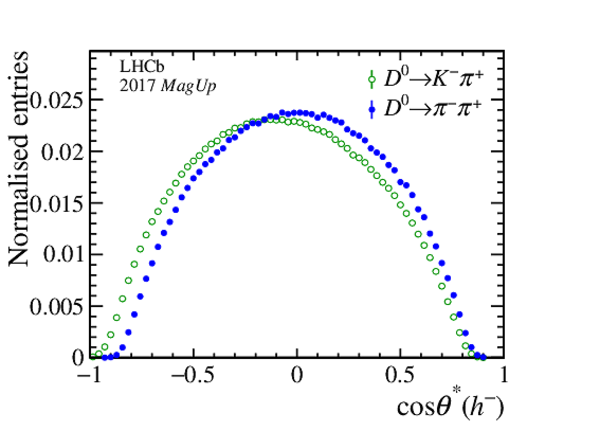
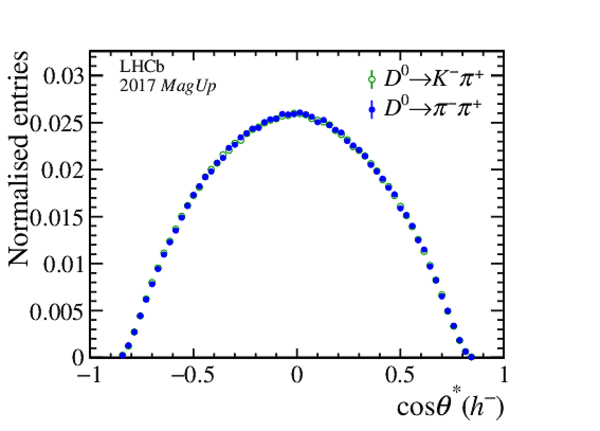
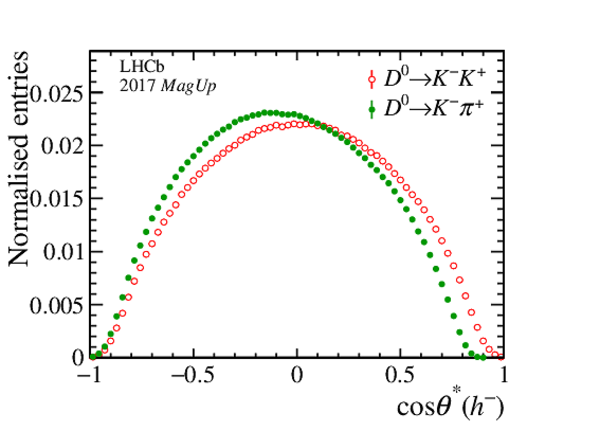
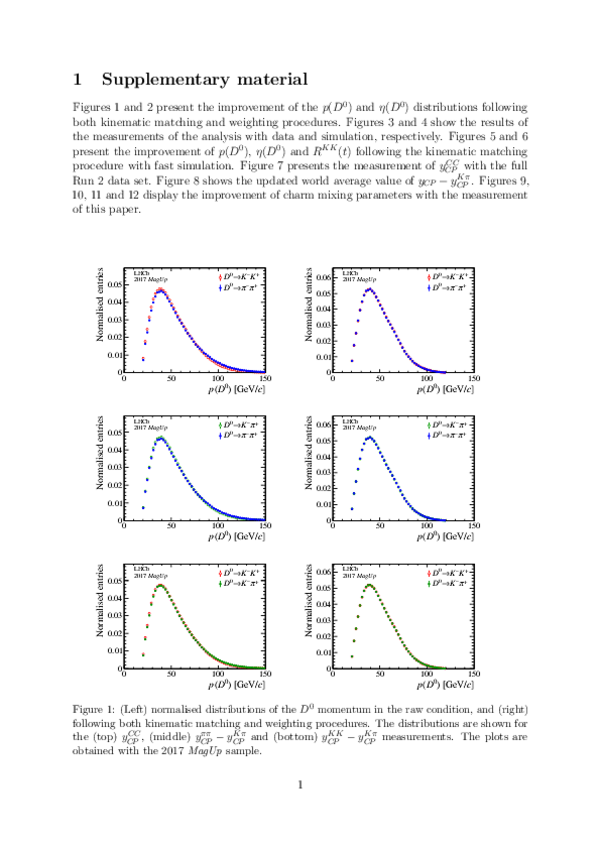
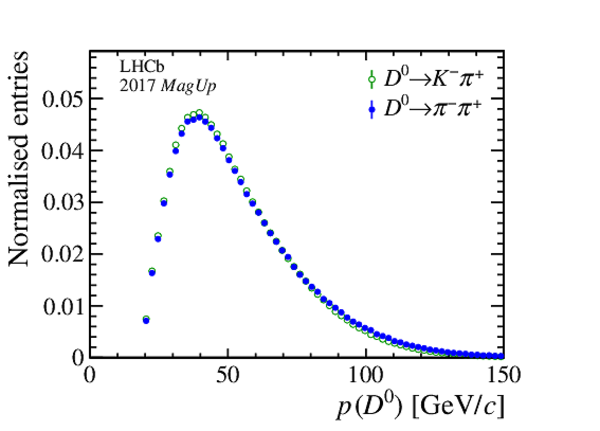
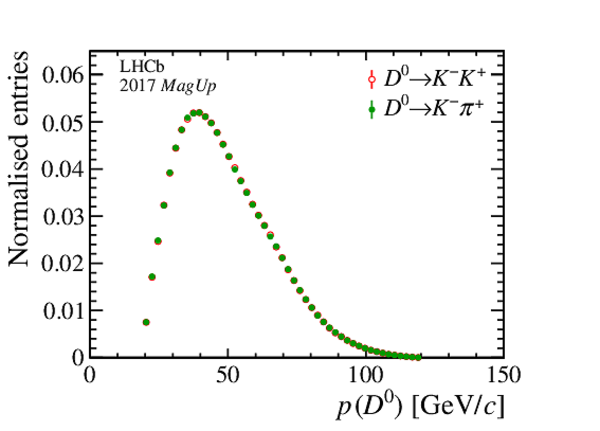
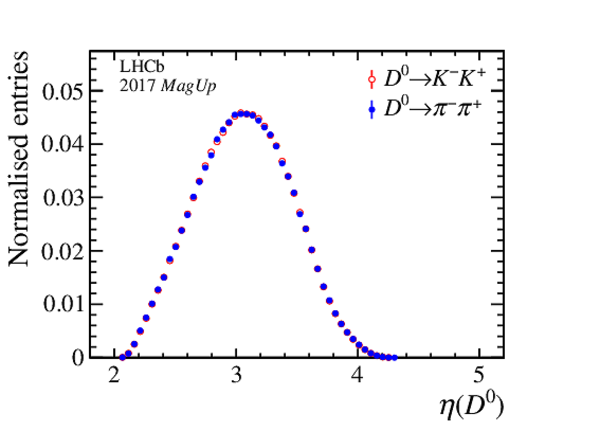
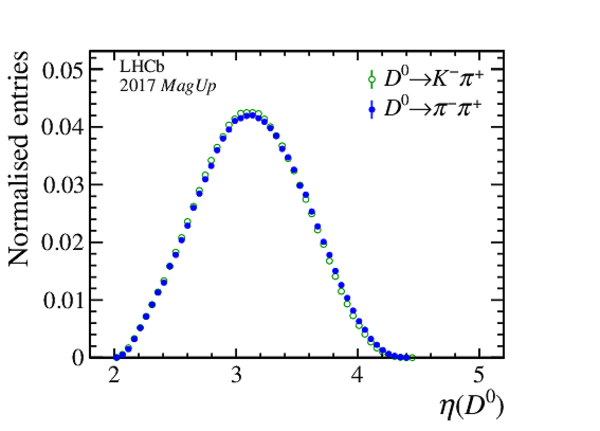
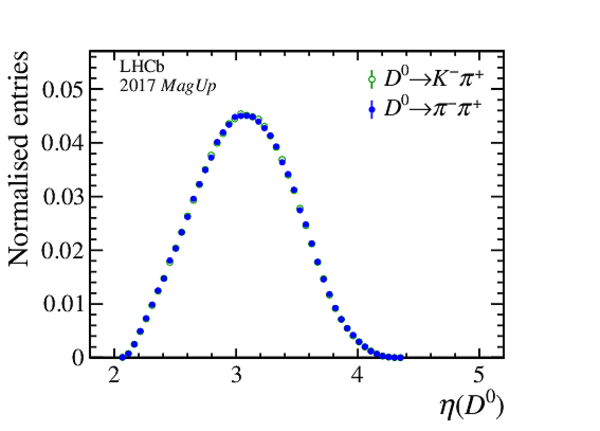
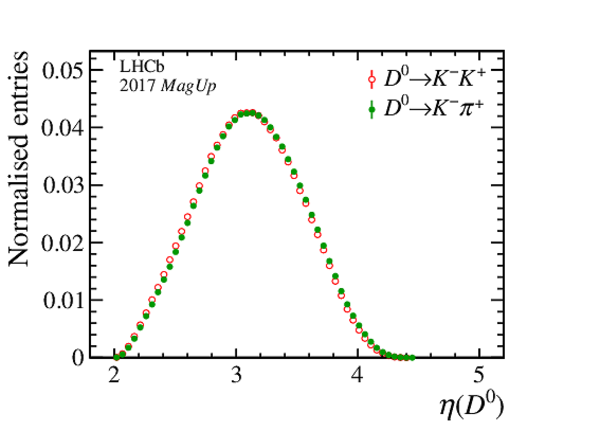
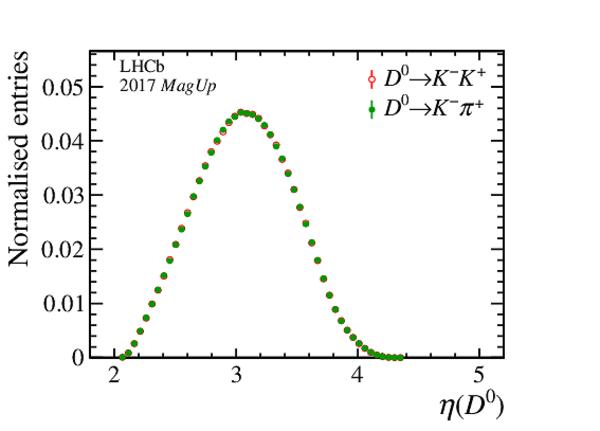
(Left) normalised distributions of the $D^0$ decay angle $\cos \theta^{\ast}(h^-)$ in the raw condition, and (right) following both kinematic matching and reweighting procedures. The distributions are shown for the (top) $ y_{ C P } ^{CC}$, (middle) $ y_{ C P } ^{\pi\pi} - y_{ C P } ^{K\pi}$ and (bottom) $ y_{ C P } ^{KK} - y_{ C P } ^{K\pi}$ measurements. The plots are obtained with the 2017 MagUp sample. |
Fig5a.pdf [18 KiB] HiDef png [191 KiB] Thumbnail [147 KiB] *.C file |
|
|
Fig5b.pdf [17 KiB] HiDef png [166 KiB] Thumbnail [139 KiB] *.C file |

|
|
|
Fig5c.pdf [18 KiB] HiDef png [203 KiB] Thumbnail [153 KiB] *.C file |
|
|
|
Fig5d.pdf [17 KiB] HiDef png [170 KiB] Thumbnail [140 KiB] *.C file |
|
|
|
Fig5e.pdf [18 KiB] HiDef png [207 KiB] Thumbnail [156 KiB] *.C file |
|
|
|
Fig5f.pdf [17 KiB] HiDef png [176 KiB] Thumbnail [140 KiB] *.C file |

|
|
|
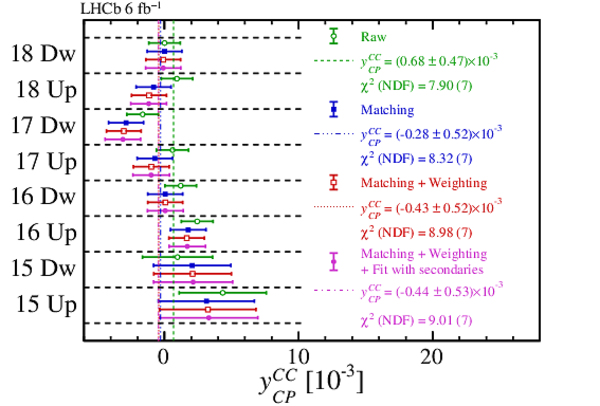
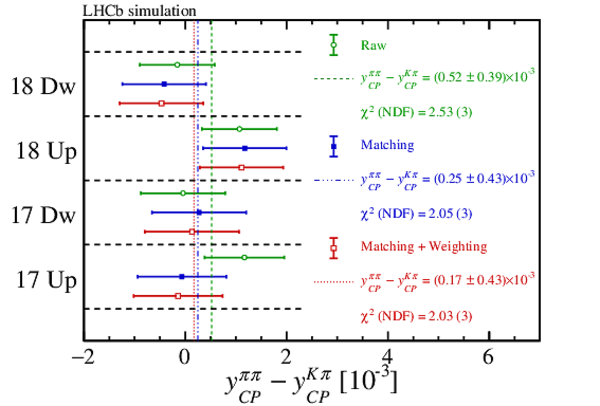
Results for (top) $ y_{ C P } ^{CC}$, (centre) $ y_{ C P } ^{\pi\pi} - y_{ C P } ^{K\pi}$ and (bottom) $ y_{ C P } ^{KK} - y_{ C P } ^{K\pi}$. The measurements employing raw data, and following both matching and weighting conditions are shown in green, blue and red, respectively. The measurements in purple employ the fit model where the presence of secondary decays is considered. The dashed vertical lines correspond to $\chi^2$ fits, used to determine the average values other all subsamples. In the y-axis labels, the data-taking year is abbreviated with the last two digits only and the magnet polarity Mag Up ( MagDown ) is abbreviated as "Up" ("Dw"). |
Fig6a.pdf [15 KiB] HiDef png [259 KiB] Thumbnail [207 KiB] *.C file |

|
|
Fig6b.pdf [15 KiB] HiDef png [271 KiB] Thumbnail [216 KiB] *.C file |

|
|
|
Fig6c.pdf [15 KiB] HiDef png [266 KiB] Thumbnail [208 KiB] *.C file |

|
|
|
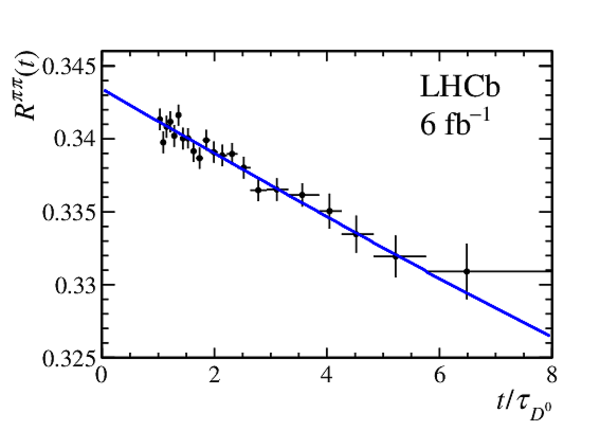
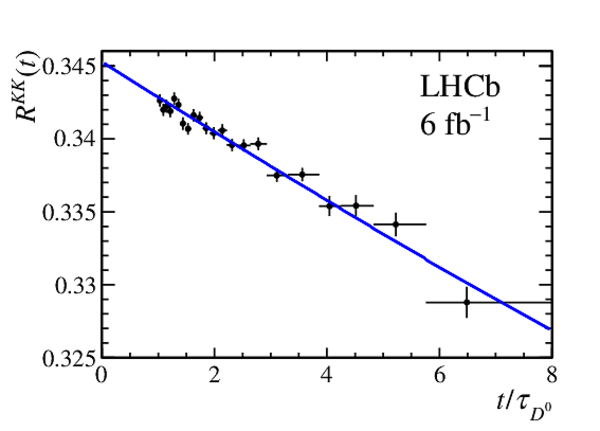
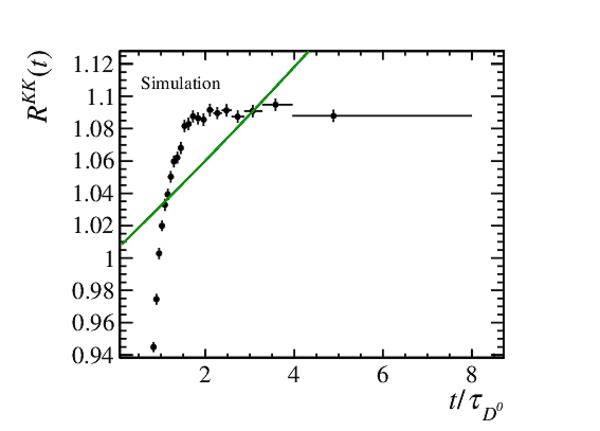
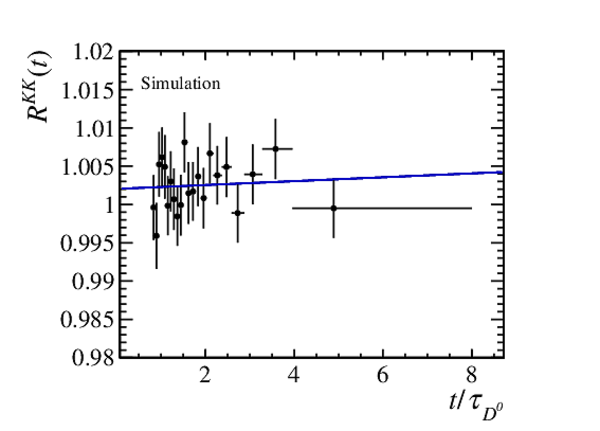
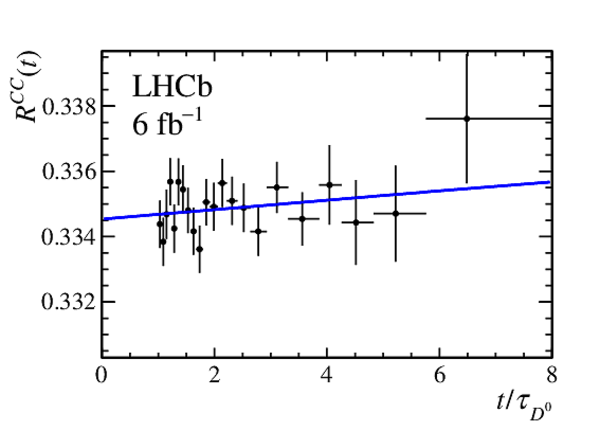
Distributions of (left) $R^{\pi\pi}(t)$ and (right) $R^{KK}(t)$ using the full LHCb Run 2 data set, with the results of $ y_{ C P } ^{\pi\pi} - y_{ C P } ^{K\pi}$ and $ y_{ C P } ^{KK} - y_{ C P } ^{K\pi}$ overlaid as the blue slopes. |
Fig7a.pdf [15 KiB] HiDef png [111 KiB] Thumbnail [106 KiB] *.C file |
|
|
Fig7b.pdf [15 KiB] HiDef png [110 KiB] Thumbnail [104 KiB] *.C file |
|
|
|
Animated gif made out of all figures. |
PAPER-2021-041.gif Thumbnail |

|
Tables and captions
|
Results of the $\chi^2$ fits of Fig. 6 for each correction procedure. The results are shown in units of $10^{-3}$, while the values in parenthesis correspond to the $\chi^2$ of the fits, where the number of degrees of freedom is 7 for all measurements. |
Table_1.pdf [55 KiB] HiDef png [63 KiB] Thumbnail [29 KiB] tex code |

|
|
Systematic uncertainties for the $ y_{ C P } ^{\pi\pi} - y_{ C P } ^{K\pi}$ and $ y_{ C P } ^{KK} - y_{ C P } ^{K\pi}$ measurements. |
Table_2.pdf [71 KiB] HiDef png [78 KiB] Thumbnail [35 KiB] tex code |

|
Supplementary Material [file]


![HiDef png [96 KiB]](Directory_LHCb-PAPER-2021-041/hidef_Fig1.png)
![HiDef png [576 KiB]](Directory_LHCb-PAPER-2021-041/hidef_Fig2.png)
![HiDef png [176 KiB]](Directory_LHCb-PAPER-2021-041/hidef_Fig3a.png)
![HiDef png [183 KiB]](Directory_LHCb-PAPER-2021-041/hidef_Fig3b.png)
![HiDef png [199 KiB]](Directory_LHCb-PAPER-2021-041/hidef_Fig3c.png)
![HiDef png [67 KiB]](Directory_LHCb-PAPER-2021-041/hidef_Fig4a.png)
![HiDef png [106 KiB]](Directory_LHCb-PAPER-2021-041/hidef_Fig4b.png)
![HiDef png [191 KiB]](Directory_LHCb-PAPER-2021-041/hidef_Fig5a.png)
![HiDef png [166 KiB]](Directory_LHCb-PAPER-2021-041/hidef_Fig5b.png)
![HiDef png [203 KiB]](Directory_LHCb-PAPER-2021-041/hidef_Fig5c.png)
![HiDef png [170 KiB]](Directory_LHCb-PAPER-2021-041/hidef_Fig5d.png)
![HiDef png [207 KiB]](Directory_LHCb-PAPER-2021-041/hidef_Fig5e.png)
![HiDef png [176 KiB]](Directory_LHCb-PAPER-2021-041/hidef_Fig5f.png)
![HiDef png [259 KiB]](Directory_LHCb-PAPER-2021-041/hidef_Fig6a.png)
![HiDef png [271 KiB]](Directory_LHCb-PAPER-2021-041/hidef_Fig6b.png)
![HiDef png [266 KiB]](Directory_LHCb-PAPER-2021-041/hidef_Fig6c.png)
![HiDef png [111 KiB]](Directory_LHCb-PAPER-2021-041/hidef_Fig7a.png)
![HiDef png [110 KiB]](Directory_LHCb-PAPER-2021-041/hidef_Fig7b.png)
![HiDef png [63 KiB]](Directory_LHCb-PAPER-2021-041/hidef_Table_1.png)
![HiDef png [78 KiB]](Directory_LHCb-PAPER-2021-041/hidef_Table_2.png)
![HiDef png [269 KiB]](Directory_LHCb-PAPER-2021-041/supplementary/hidef_lhcb-logo.png)
![Thumbnail [142 KiB]](Directory_LHCb-PAPER-2021-041/supplementary/thumbnail_lhcb-logo.png)
![HiDef png [361 KiB]](Directory_LHCb-PAPER-2021-041/supplementary/hidef_Fig10a.png)
![HiDef png [382 KiB]](Directory_LHCb-PAPER-2021-041/supplementary/hidef_Fig10b.png)
![HiDef png [384 KiB]](Directory_LHCb-PAPER-2021-041/supplementary/hidef_Fig10c.png)
![HiDef png [238 KiB]](Directory_LHCb-PAPER-2021-041/supplementary/hidef_Fig11a.png)
![HiDef png [265 KiB]](Directory_LHCb-PAPER-2021-041/supplementary/hidef_Fig11b.png)
![HiDef png [260 KiB]](Directory_LHCb-PAPER-2021-041/supplementary/hidef_Fig11c.png)
![HiDef png [174 KiB]](Directory_LHCb-PAPER-2021-041/supplementary/hidef_Fig12a.png)
![HiDef png [163 KiB]](Directory_LHCb-PAPER-2021-041/supplementary/hidef_Fig12b.png)
![HiDef png [173 KiB]](Directory_LHCb-PAPER-2021-041/supplementary/hidef_Fig12c.png)
![HiDef png [158 KiB]](Directory_LHCb-PAPER-2021-041/supplementary/hidef_Fig12d.png)
![HiDef png [112 KiB]](Directory_LHCb-PAPER-2021-041/supplementary/hidef_Fig13a.png)
![HiDef png [125 KiB]](Directory_LHCb-PAPER-2021-041/supplementary/hidef_Fig13b.png)
![HiDef png [109 KiB]](Directory_LHCb-PAPER-2021-041/supplementary/hidef_Fig14.png)
![HiDef png [357 KiB]](Directory_LHCb-PAPER-2021-041/supplementary/hidef_Fig15.png)
![HiDef png [371 KiB]](Directory_LHCb-PAPER-2021-041/supplementary/hidef_Fig16.png)
![HiDef png [478 KiB]](Directory_LHCb-PAPER-2021-041/supplementary/hidef_Fig17.png)
![HiDef png [384 KiB]](Directory_LHCb-PAPER-2021-041/supplementary/hidef_Fig18.png)
![HiDef png [400 KiB]](Directory_LHCb-PAPER-2021-041/supplementary/hidef_Fig19.png)
![HiDef png [171 KiB]](Directory_LHCb-PAPER-2021-041/supplementary/hidef_Fig8a.png)
![HiDef png [155 KiB]](Directory_LHCb-PAPER-2021-041/supplementary/hidef_Fig8b.png)
![HiDef png [171 KiB]](Directory_LHCb-PAPER-2021-041/supplementary/hidef_Fig8c.png)
![HiDef png [157 KiB]](Directory_LHCb-PAPER-2021-041/supplementary/hidef_Fig8d.png)
![HiDef png [174 KiB]](Directory_LHCb-PAPER-2021-041/supplementary/hidef_Fig8e.png)
![HiDef png [160 KiB]](Directory_LHCb-PAPER-2021-041/supplementary/hidef_Fig8f.png)
![HiDef png [155 KiB]](Directory_LHCb-PAPER-2021-041/supplementary/hidef_Fig9a.png)
![HiDef png [140 KiB]](Directory_LHCb-PAPER-2021-041/supplementary/hidef_Fig9b.png)
![HiDef png [154 KiB]](Directory_LHCb-PAPER-2021-041/supplementary/hidef_Fig9c.png)
![HiDef png [144 KiB]](Directory_LHCb-PAPER-2021-041/supplementary/hidef_Fig9d.png)
![HiDef png [160 KiB]](Directory_LHCb-PAPER-2021-041/supplementary/hidef_Fig9e.png)
![HiDef png [146 KiB]](Directory_LHCb-PAPER-2021-041/supplementary/hidef_Fig9f.png)
Created on 27 April 2024.