Information
LHCb-PAPER-2021-042
CERN-EP-2021-267
arXiv:2201.10167 [PDF]
(Submitted on 25 Jan 2022)
JHEP 05 (2022) 67
Inspire 2017252
Tools
Abstract
A search for the decay $B^0\to\phi\mu^+\mu^-$ is performed using proton-proton collisions at centre-of-mass energies of 7, 8, and 13 TeV collected by the LHCb experiment and corresponding to an integrated luminosity of 9 fb$^{-1}$. No evidence for the $B^0\to \phi \mu^+ \mu^-$ decay is found and an upper limit on the branching fraction, excluding the $\phi$ and charmonium regions in the dimuon spectrum, of $4.4 \times 10^{-3}$ at a 90$\%$ credibility level, relative to that of the $B^0_s \to \phi \mu^+ \mu^-$ decay, is established. Using the measured $B^0_s\to\phi\mu^+\mu^-$ branching fraction and assuming a phase-space model, the absolute branching fraction of the decay $B^0\to \phi \mu^+ \mu^-$ in the full $q^2$ range is determined to be less than $3.2 \times 10^{-9}$ at a 90$\%$ credibility level.
Figures and captions
|
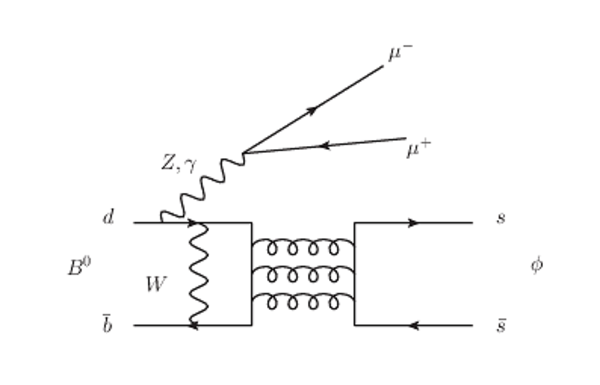
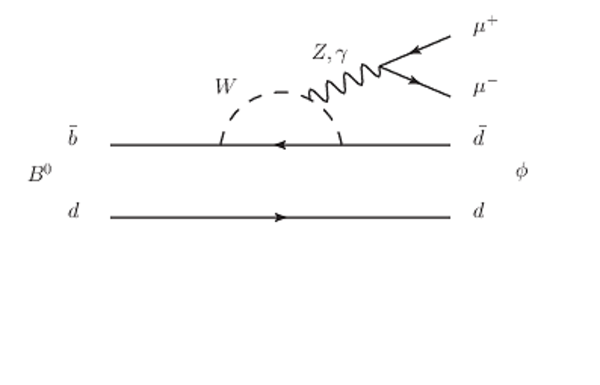
Standard Model Feynman diagrams for the decay $ B ^0 \rightarrow \phi\mu^+\mu^-$. (a), (b), (c) represent the weak annihilation contributions, while (d) represents the contribution from $\omega-\phi$ mixing. |
penguin_1.pdf [9 KiB] HiDef png [157 KiB] Thumbnail [81 KiB] |
|
|
penguin_2.pdf [8 KiB] HiDef png [162 KiB] Thumbnail [84 KiB] |

|
|
|
penguin_3.pdf [9 KiB] HiDef png [139 KiB] Thumbnail [73 KiB] |

|
|
|
penguin_4.pdf [8 KiB] HiDef png [80 KiB] Thumbnail [42 KiB] |
|
|
|
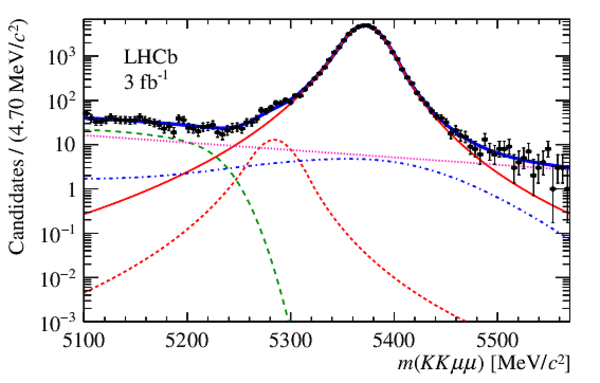
The $ K ^+ K ^- \mu^+\mu^-$ mass distributions of selected $B_s^0 \rightarrow J/\psi\phi$ candidates in (left) Run 1 and (right) Run 2 data, with the fit projections overlaid. The red solid line is $ B ^0_ s \rightarrow { J \mskip -3mu/\mskip -2mu\psi } \phi$ signal, the red dashed line is $ B ^0 \rightarrow { J \mskip -3mu/\mskip -2mu\psi } K ^+ K ^- $ signal, the green dashed line is the partially reconstructed background component, the violet dotted line is the combinatorial background component, and the blue dash-dot line is the $\Lambda ^0_ b \rightarrow { J \mskip -3mu/\mskip -2mu\psi } {p}K^-$ background component. |
run1_m[..].pdf [37 KiB] HiDef png [255 KiB] Thumbnail [195 KiB] |
|
|
run2_m[..].pdf [38 KiB] HiDef png [241 KiB] Thumbnail [185 KiB] |

|
|
|
The $ K ^+ K ^- \mu^+\mu^-$ mass distributions of selected nonresonant $ B _{( s )}^0 \rightarrow \phi\mu^+\mu^-$ candidates in (left) Run 1 and (right) Run 2 data. The red solid line is $ B ^0_ s \rightarrow \phi\mu^+\mu^-$ signal, the red dashed line is $ B ^0 \rightarrow \phi\mu^+\mu^-$ signal, the green dashed line is the partially reconstructed background component, the violet dotted line is the combinatorial background component, the blue dash-dot line is the $\Lambda ^0_ b \rightarrow pK^-\mu^+\mu^-$ background component, the violet dash-dot line is the $B^0\rightarrow K^{*0}(\rightarrow K^+\pi^-)\mu^+\mu^-$ background component, and the orange dash-dot line is the $ B ^0_ s \rightarrow D_s^-(\rightarrow \phi\mu^-\bar{\nu})\mu^+\nu$ background component. |
sim_ru[..].pdf [30 KiB] HiDef png [307 KiB] Thumbnail [234 KiB] |

|
|
sim_ru[..].pdf [33 KiB] HiDef png [294 KiB] Thumbnail [223 KiB] |

|
|
|
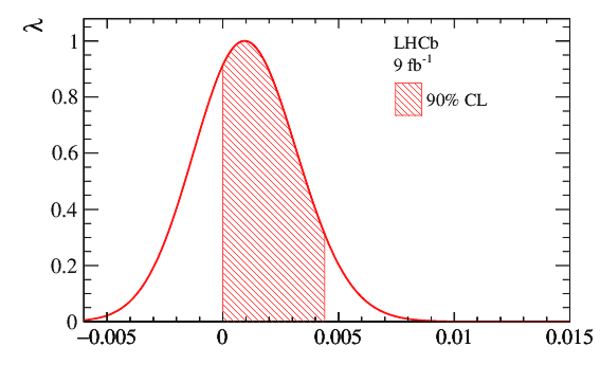
Smeared profile likelihood ratio curve from the simultaneous fit to the Run 1 and Run 2 data samples. The red shaded area indicates the $90\%$ crediblity interval of $\mathcal{R}$. |
smear_[..].pdf [39 KiB] HiDef png [235 KiB] Thumbnail [171 KiB] |
|
|
Animated gif made out of all figures. |
PAPER-2021-042.gif Thumbnail |

|
![HiDef png [157 KiB]](Directory_LHCb-PAPER-2021-042/hidef_penguin_1.png)
![HiDef png [162 KiB]](Directory_LHCb-PAPER-2021-042/hidef_penguin_2.png)
![HiDef png [139 KiB]](Directory_LHCb-PAPER-2021-042/hidef_penguin_3.png)
![HiDef png [80 KiB]](Directory_LHCb-PAPER-2021-042/hidef_penguin_4.png)
![HiDef png [255 KiB]](Directory_LHCb-PAPER-2021-042/hidef_run1_mass_Jpsiphi_log_draft.png)
![HiDef png [241 KiB]](Directory_LHCb-PAPER-2021-042/hidef_run2_mass_Jpsiphi_log_draft.png)
![HiDef png [307 KiB]](Directory_LHCb-PAPER-2021-042/hidef_sim_run1_exp_1_log_draft.png)
![HiDef png [294 KiB]](Directory_LHCb-PAPER-2021-042/hidef_sim_run2_exp_1_log_draft.png)
![HiDef png [235 KiB]](Directory_LHCb-PAPER-2021-042/hidef_smear_pls_sim_tot.png)
Tables and captions
|
Efficiencies of background decay processes relative to that of the decay $B_s^0 \rightarrow \phi \mu^+ \mu^-$ evaluated using simulated samples. The uncertainties are due to limited sizes of these samples. |
Table_1.pdf [84 KiB] HiDef png [62 KiB] Thumbnail [31 KiB] tex code |

|
|
Systematic uncertainties on the measurement of $\mathcal{R}$ for additive and multiplicative sources. |
Table_2.pdf [98 KiB] HiDef png [183 KiB] Thumbnail [84 KiB] tex code |

|
![HiDef png [62 KiB]](Directory_LHCb-PAPER-2021-042/hidef_Table_1.png)
![HiDef png [183 KiB]](Directory_LHCb-PAPER-2021-042/hidef_Table_2.png)
Created on 27 April 2024.