Measurement of CP asymmetries in $ {D}_{(s)}^{+}\to \eta {\pi}^{+} $ and $ {D}_{(s)}^{+}\to {\eta}^{\prime }{\pi}^{+} $ decays
[to restricted-access page]Information
LHCb-PAPER-2021-051
CERN-EP-2022-035
arXiv:2204.12228 [PDF]
(Submitted on 26 Apr 2022)
JHEP 04 (2023) 081
Inspire 2072369
Tools
Abstract
Searches for $CP$ violation in the decays $D^+_{(s)}\rightarrow \eta \pi^+$ and $D^+_{(s)}\rightarrow \eta^{\prime} \pi^+$ are performed using $pp$ collision data corresponding to 6 fb$^{-1}$ of integrated luminosity collected by the LHCb experiment. The calibration channels $D^+_{(s)}\rightarrow \phi \pi^+$ are used to remove production and detection asymmetries. The resulting $CP$-violating asymmetries are $A^{CP}(D^+ \rightarrow \eta \pi^+) = (0.34 \pm 0.66 \pm 0.16 \pm 0.05)\%$, $A^{CP}(D^+_s \rightarrow \eta \pi^+) = (0.32 \pm 0.51 \pm 0.12)\%$, $A^{CP}(D^+ \rightarrow \eta^{\prime} \pi^+) = (0.49 \pm 0.18 \pm 0.06 \pm 0.05)\%$, $A^{CP}(D^+_s \rightarrow \eta^{\prime} \pi^+) = (0.01 \pm 0.12 \pm 0.08)\%$, where the first uncertainty is statistical, the second is systematic and the third, relevant for the $D^+$ channels, is due to the uncertainty on $A^{CP}(D^+ \to \phi \pi^+)$. These measurements, currently the most precise for three of the four channels considered, are consistent with the absence of $CP$ violation. A combination of these results with previous LHCb measurements is presented.
Figures and captions
|
Two-dimensional distributions of $m(\gamma\pi ^+ \pi ^- )$ versus $m(\eta ^{(\prime)} \pi ^+ )$ for (left) the $\eta ^{\prime}$ $\pi ^+$ final state and (right) the $\eta $ $\pi ^+$ final state. The background candidates at low values of $m(\gamma\pi ^+ \pi ^- )$ for the $\eta $ $\pi ^+$ final state arise from $\eta \rightarrow \pi ^+ \pi ^- \pi ^0 $ decays. These distributions correspond to a subset of the signal data sample. |
fig1_left.pdf [50 KiB] HiDef png [1007 KiB] Thumbnail [657 KiB] *.C file |

|
|
fig1_right.pdf [57 KiB] HiDef png [1 MiB] Thumbnail [876 KiB] *.C file |

|
|
|
Distribution of the invariant mass $m(\eta ^{\prime} \pi ^+ )$ of (left) $ D ^+_{( s )} \rightarrow \eta ^{\prime} \pi ^+ $ candidates and (right) $D^{-}_{(s)}\rightarrow \eta ^{\prime} \pi ^- $ candidates, summed over the eight subsamples. Candidates have $ m(\gamma\pi ^+ \pi ^- )$ in the range 936--976$\text{ Me V} $. The results of the fit described in the text are superimposed. The lower panels show the normalised fit residuals (pulls). |
fig2.pdf [48 KiB] HiDef png [215 KiB] Thumbnail [195 KiB] *.C file |

|
|
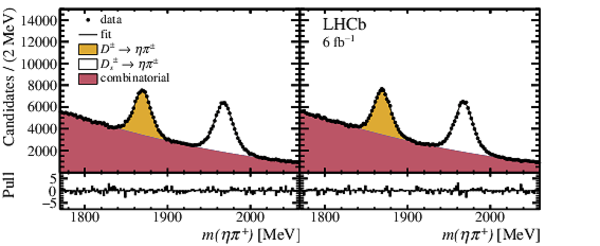
Distribution of the invariant mass $m(\eta \pi ^+ )$ of (left) $ D ^+_{( s )} \rightarrow \eta \pi ^+ $ candidates and (right) $D^{-}_{(s)}\rightarrow \eta \pi ^- $ candidates, summed over the eight subsamples. Candidates have $ m(\gamma\pi ^+ \pi ^- )$ in the range 526--570$\text{ Me V} $. The results of the fit described in the text are superimposed. The lower panels show the normalised fit residuals (pulls). |
fig3.pdf [45 KiB] HiDef png [201 KiB] Thumbnail [184 KiB] *.C file |
|
|
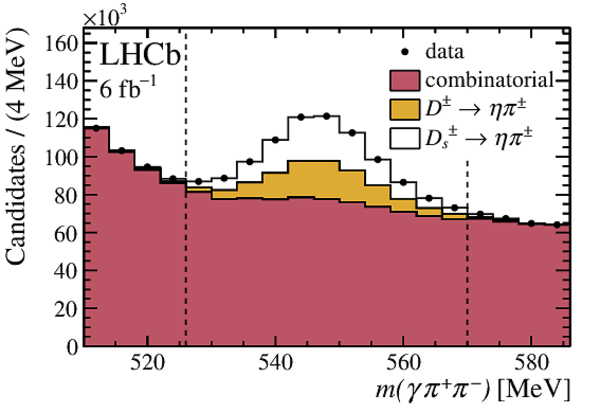
Distributions of the invariant mass $ m(\gamma\pi ^+ \pi ^- )$ for (left) $ D ^+_{( s )} \rightarrow \eta ^{\prime} \pi ^+ $ candidates and (right) $ D ^+_{( s )} \rightarrow \eta \pi ^+ $ candidates, with the projections of the fit superimposed, summed over the subsamples and the $ D ^+_{( s )}$ charges. In this figure, the $ m(\gamma\pi ^+ \pi ^- )$ mass ranges are enlarged with respect to the baseline fit. The default mass ranges are indicated by the vertical dashed lines. |
fig4_left.pdf [16 KiB] HiDef png [203 KiB] Thumbnail [214 KiB] *.C file |

|
|
fig4_right.pdf [15 KiB] HiDef png [177 KiB] Thumbnail [185 KiB] *.C file |
|
|
|
Mass distributions with corresponding fits of (top) $ D ^+_ s \rightarrow \phi\pi ^+ $ candidates and (bottom) $ D ^+ \rightarrow \phi\pi ^+ $ candidates. The candidates are weighted to match the signal distributions for the $\eta ^{\prime} \pi ^+ $ channels. The positively charged candidates are shown on the left and the negatively charged candidates on the right. The blue curves represent the total fit, while the red curves show the very small background component. The data shown are from the 2017, magnet up polarity subsample. |
fig5_top.pdf [34 KiB] HiDef png [131 KiB] Thumbnail [108 KiB] *.C file |

|
|
fig5_b[..].pdf [33 KiB] HiDef png [120 KiB] Thumbnail [98 KiB] *.C file |

|
|
|
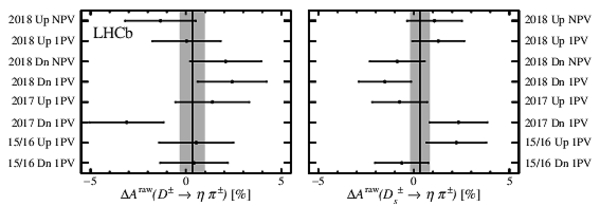
Measured values of $\Delta {\mathcal{A}}^{\mathrm{ raw}} $ for the individual subsamples for (upper left) the $ D ^+ \rightarrow \eta \pi ^+ $ channel, (upper right) the $ D ^+_ s \rightarrow \eta \pi ^+ $ channel, (lower left) the $ D ^+ \rightarrow \eta ^{\prime} \pi ^+ $ channel and (lower right) the $ D ^+_ s \rightarrow \eta ^{\prime} \pi ^+ $ channel. The subsample labels indicate year of data taking (15/16 = 2015 + 2016), magnet polarity ("Up" or "Dn") and number of PVs ("1PV" for one primary vertex and "NPV" for $N_{\rm PV}>1$). The vertical lines and the grey bands indicate the weighted averages and the corresponding statistical uncertainties. |
fig6_top.pdf [14 KiB] HiDef png [92 KiB] Thumbnail [48 KiB] *.C file |
|
|
fig6_b[..].pdf [15 KiB] HiDef png [97 KiB] Thumbnail [50 KiB] *.C file |

|
|
|
Animated gif made out of all figures. |
PAPER-2021-051.gif Thumbnail |

|
![HiDef png [1007 KiB]](Directory_LHCb-PAPER-2021-051/hidef_fig1_left.png)
![HiDef png [1 MiB]](Directory_LHCb-PAPER-2021-051/hidef_fig1_right.png)
![HiDef png [215 KiB]](Directory_LHCb-PAPER-2021-051/hidef_fig2.png)
![HiDef png [201 KiB]](Directory_LHCb-PAPER-2021-051/hidef_fig3.png)
![HiDef png [203 KiB]](Directory_LHCb-PAPER-2021-051/hidef_fig4_left.png)
![HiDef png [177 KiB]](Directory_LHCb-PAPER-2021-051/hidef_fig4_right.png)
![HiDef png [131 KiB]](Directory_LHCb-PAPER-2021-051/hidef_fig5_top.png)
![HiDef png [120 KiB]](Directory_LHCb-PAPER-2021-051/hidef_fig5_bottom.png)
![HiDef png [92 KiB]](Directory_LHCb-PAPER-2021-051/hidef_fig6_top.png)
![HiDef png [97 KiB]](Directory_LHCb-PAPER-2021-051/hidef_fig6_bottom.png)
Tables and captions
|
Systematic uncertainties associated to values of $ {\mathcal{A}}^{\mathrm{ raw}}$ (%). |
Table_1.pdf [68 KiB] HiDef png [54 KiB] Thumbnail [23 KiB] tex code |

|
![HiDef png [54 KiB]](Directory_LHCb-PAPER-2021-051/hidef_Table_1.png)
Created on 27 April 2024.