Search for the doubly heavy baryon $\it{\Xi}_{bc}^{+}$ decaying to $J/\it{\psi} \it{\Xi}_{c}^{+}$
[to restricted-access page]Information
LHCb-PAPER-2022-005
CERN-EP-2022-048
arXiv:2204.09541 [PDF]
(Submitted on 20 Apr 2022)
Chin. Phys. C47 (2023) 093001
Inspire 2069763
Tools
Abstract
A first search for the $\it{\Xi}_{bc}^{+}\to J/\it{\psi}\it{\Xi}_{c}^{+}$ decay is performed by the LHCb experiment with a data sample of proton-proton collisions, corresponding to an integrated luminosity of $9 \mathrm{fb}^{-1}$ recorded at centre-of-mass energies of 7, 8, and $13\mathrm{ Te V}$. Two peaking structures are seen with a local (global) significance of $4.3 (2.8)$ and $4.1 (2.4)$ standard deviations at masses of $6571 \mathrm{Me V /}c^2$ and $6694 \mathrm{Me V /}c^2$, respectively. Upper limits are set on the $\it{\Xi}_{bc}^{+}$ baryon production cross-section times the branching fraction relative to that of the $B_{c}^{+}\to J/\it{\psi} D_{s}^{+}$ decay at centre-of-mass energies of 8 and $13\mathrm{ Te V}$, in the $\it{\Xi}_{bc}^{+}$ and in the $B_{c}^{+}$ rapidity and transverse-momentum ranges from 2.0 to 4.5 and 0 to $20 \mathrm{Ge V /}c$, respectively. Upper limits are presented as a function of the $\it{\Xi}_{bc}^{+}$ mass and lifetime.
Figures and captions
|
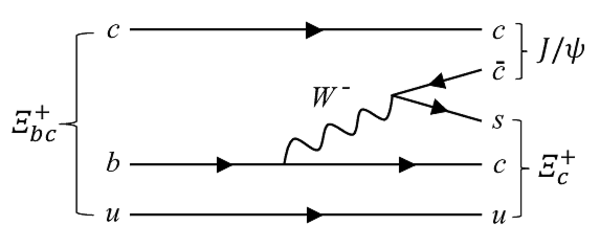
Example leading-order Feynman diagram for the $\Xi ^+_{ b c } \rightarrow { J \mskip -3mu/\mskip -2mu\psi } \Xi ^+_ c $ decay. |
Fig1.pdf [24 KiB] HiDef png [43 KiB] Thumbnail [21 KiB] *.C file |
|
|
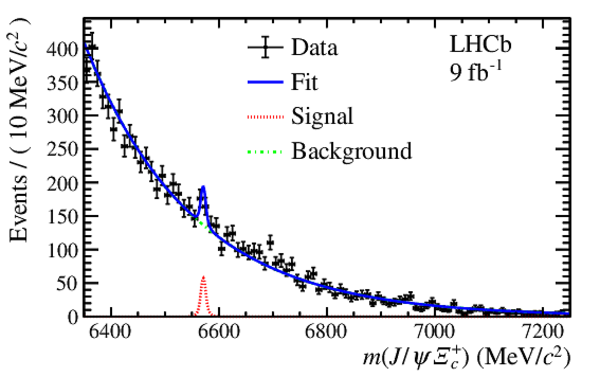
Mass $m( { J \mskip -3mu/\mskip -2mu\psi } \Xi ^+_ c )$ distribution of selected $\Xi ^+_{ b c } $ candidates for the full data set. The fit (blue solid line) with the largest local significance at the mass of 6571 $\text{ Me V /}c^2$ is superimposed. |
Fig2.pdf [24 KiB] HiDef png [236 KiB] Thumbnail [206 KiB] *.C file |
|
|
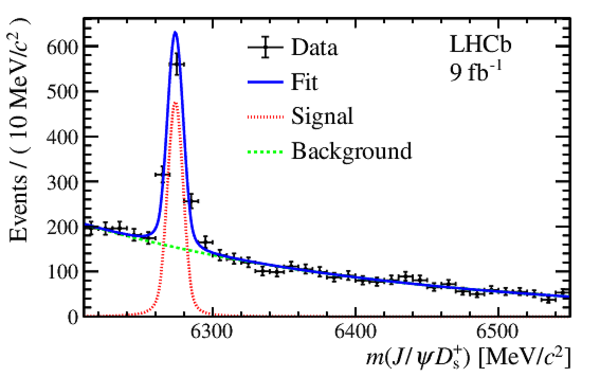
Mass $m( { J \mskip -3mu/\mskip -2mu\psi } D ^+_ s )$ distribution of selected $ B _ c ^+ $ candidates for the full data set. The fit (blue solid line) is superimposed. |
Fig3.pdf [18 KiB] HiDef png [229 KiB] Thumbnail [186 KiB] *.C file |
|
|
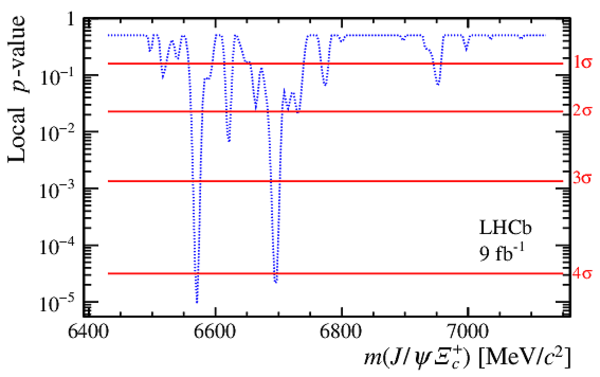
Local $p$-value in the $m( { J \mskip -3mu/\mskip -2mu\psi } \Xi ^+_ c )$ range $6430-7120\text{ Me V /}c^2 $. |
Fig4.pdf [15 KiB] HiDef png [176 KiB] Thumbnail [148 KiB] *.C file |
|
|
Mass $m( { J \mskip -3mu/\mskip -2mu\psi } \Xi ^+_ c )$ distribution of selected $\Xi ^+_{ b c } $ candidates for the full data set. The fit (blue solid line) with the second largest local significance at the mass of 6694 $\text{ Me V /}c^2$ is superimposed. |
Fig5.pdf [25 KiB] HiDef png [234 KiB] Thumbnail [205 KiB] *.C file |

|
|
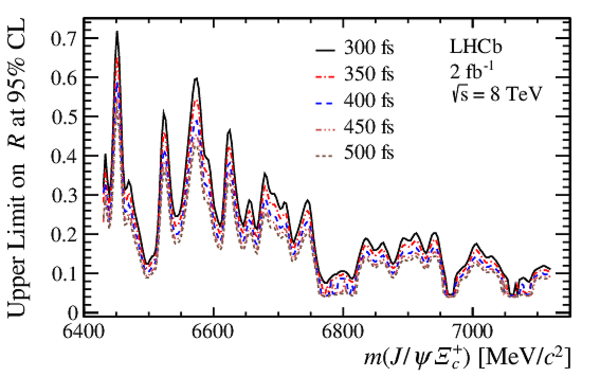
Upper limits on $\mathcal{R}$ at 95% CL as a function of $m( { J \mskip -3mu/\mskip -2mu\psi } \Xi ^+_ c )$ for five $\Xi ^+_{ b c } $ lifetime hypotheses (300, 350, 400, 450 and $500\text{ fs}$) at a centre-of-mass energy of $\sqrt{s} =8\text{ Te V} $. The curves from top to bottom correspond to lifetime hypotheses from $300\text{ fs}$ to $500\text{ fs}$, respectively. |
Fig6.pdf [19 KiB] HiDef png [407 KiB] Thumbnail [256 KiB] *.C file |
|
|
Fig7.pdf [18 KiB] HiDef png [415 KiB] Thumbnail [250 KiB] *.C file |
|
|
|
Animated gif made out of all figures. |
PAPER-2022-005.gif Thumbnail |

|
![HiDef png [43 KiB]](Directory_LHCb-PAPER-2022-005/hidef_Fig1.png)
![HiDef png [236 KiB]](Directory_LHCb-PAPER-2022-005/hidef_Fig2.png)
![HiDef png [229 KiB]](Directory_LHCb-PAPER-2022-005/hidef_Fig3.png)
![HiDef png [176 KiB]](Directory_LHCb-PAPER-2022-005/hidef_Fig4.png)
![HiDef png [234 KiB]](Directory_LHCb-PAPER-2022-005/hidef_Fig5.png)
![HiDef png [407 KiB]](Directory_LHCb-PAPER-2022-005/hidef_Fig6.png)
![HiDef png [415 KiB]](Directory_LHCb-PAPER-2022-005/hidef_Fig7.png)
Tables and captions
|
Efficiency ratios $\varepsilon_{\rm norm}/\varepsilon_{\rm sig}$ between the normalisation and signal modes, signal yields of the normalisation mode $N_{\rm norm}$, and the single-event sensitivity $\alpha$, for the default mass and lifetime of the $\Xi ^+_{ b c } $ baryon, $6900\text{ Me V /}c^2 $ and $400\text{ fs}$, respectively. Uncertainties are statistical only. |
Table_1.pdf [54 KiB] HiDef png [57 KiB] Thumbnail [27 KiB] tex code |

|
|
Single-event sensitivity $\alpha$ in units of 10$^{-3}$ for different lifetime hypotheses of the $\Xi ^+_{ b c } $ baryon for different data taking periods. Uncertainties are due to the limited size of the simulated samples and the statistical uncertainties in the measured $ B _ c ^+ $ yields. |
Table_2.pdf [45 KiB] HiDef png [50 KiB] Thumbnail [24 KiB] tex code |

|
|
Systematic uncertainties on the measurement of the production ratio, $\mathcal{R}$. |
Table_3.pdf [70 KiB] HiDef png [78 KiB] Thumbnail [35 KiB] tex code |

|
![HiDef png [57 KiB]](Directory_LHCb-PAPER-2022-005/hidef_Table_1.png)
![HiDef png [50 KiB]](Directory_LHCb-PAPER-2022-005/hidef_Table_2.png)
![HiDef png [78 KiB]](Directory_LHCb-PAPER-2022-005/hidef_Table_3.png)
Created on 26 April 2024.