Measurement of $\tau _\text {L}$ using the ${B} _s^0 \rightarrow J/\psi \eta $ decay mode
[to restricted-access page]Information
LHCb-PAPER-2022-010
CERN-EP-2022-099
arXiv:2206.03088 [PDF]
(Submitted on 07 Jun 2022)
Eur. Phys. J. C83 (2023) 629
Inspire 2092598
Tools
Abstract
Using a proton-proton collision data sample collected by the LHCb detector and corresponding to an integrated luminosity of 5.7 $\text{fb}^{-1}$, the lifetime of the $B_{s}^{0}$ mass eigenstate, $\tau_{L}$, is measured using $B_{s}^{0} \to J/\psi \eta$ decay mode to be $\tau_{L}$ = 1.445 $\pm$ 0.016(stat) $\pm$ 0.008(syst) ps. A combination of this result with a previous LHCb analysis using an independent dataset corresponding to 3 $\text{fb}^{-1}$ of integrated luminosity gives $\tau_{L}$ = 1.452 $\pm$ 0.014 $\pm$ 0.007 $\pm$ 0.002 ps, where the first uncertainty is statistical, the second due to the uncorrelated part of the systematic uncertainty and the third due to the correlated part of the systematic uncertainty.
Figures and captions
|
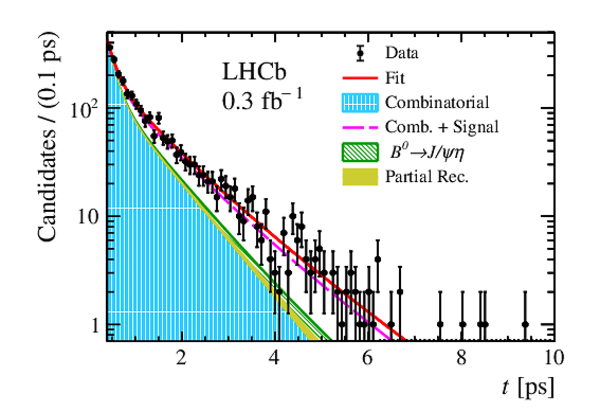
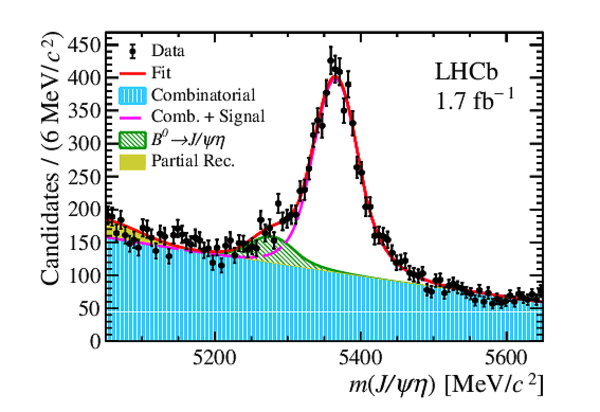
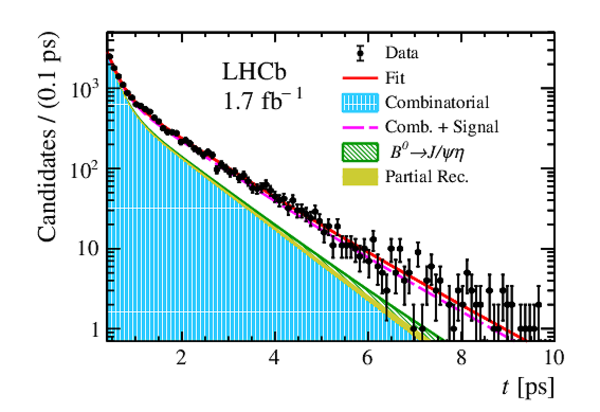
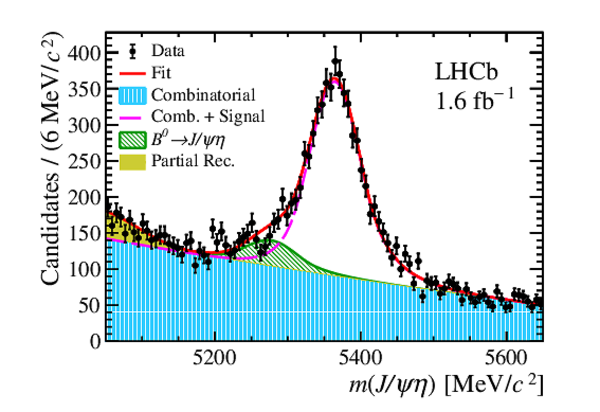
Distributions of (left) invariant mass and (right) decay time by year: (top row) 2015, (second row) 2016, (third row) 2017 and (bottom row) 2018. |
fig1a.pdf [37 KiB] HiDef png [758 KiB] Thumbnail [270 KiB] |

|
|
fig1b.pdf [30 KiB] HiDef png [762 KiB] Thumbnail [204 KiB] |
|
|
|
fig1c.pdf [38 KiB] HiDef png [848 KiB] Thumbnail [254 KiB] |
|
|
|
fig1d.pdf [36 KiB] HiDef png [1003 KiB] Thumbnail [221 KiB] |
|
|
|
fig1e.pdf [38 KiB] HiDef png [835 KiB] Thumbnail [253 KiB] |
|
|
|
fig1f.pdf [36 KiB] HiDef png [953 KiB] Thumbnail [221 KiB] |

|
|
|
fig1g.pdf [37 KiB] HiDef png [885 KiB] Thumbnail [239 KiB] |

|
|
|
fig1h.pdf [36 KiB] HiDef png [1 MiB] Thumbnail [222 KiB] |

|
|
|
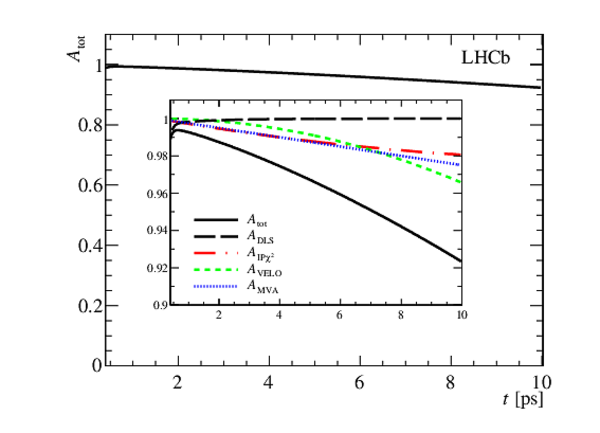
Total acceptance function, $A_{\textrm{tot}}$ for the 2016 data taking period. The insert shows the four individual components of the acceptance that are multiplied to give $A_{\textrm{tot}}$. The acceptance functions for the other years are similar. |
fig2a.pdf [13 KiB] HiDef png [134 KiB] Thumbnail [125 KiB] |
|
|
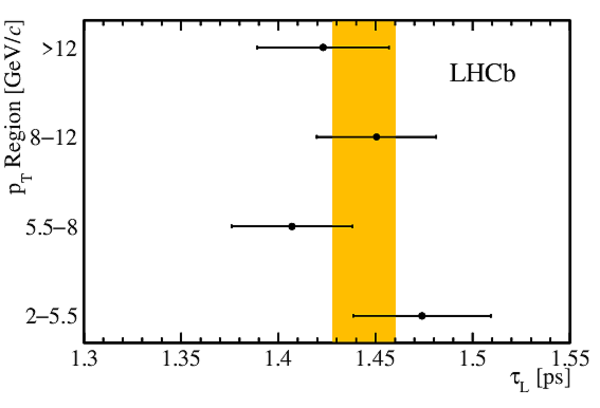
Values of $\tau_{\rm L}$ obtained by dividing the data according to (left) the four years of data-taking and (right) regions in $ B ^0_ s $ $ p_{\mathrm{T}}$ . In both plots the statistical uncertainty for each point is shown. The $1 \sigma$ error bands of the statistical uncertainty on the combined results are shown in yellow. The $\chi^2$ probability of the measurements is $51 \%$($49 \%$) for fits to the data divided by year ( $ B ^0_ s $ $ p_{\mathrm{T}}$ ). |
fig3a.pdf [13 KiB] HiDef png [93 KiB] Thumbnail [91 KiB] |

|
|
fig3b.pdf [13 KiB] HiDef png [77 KiB] Thumbnail [69 KiB] |
|
|
|
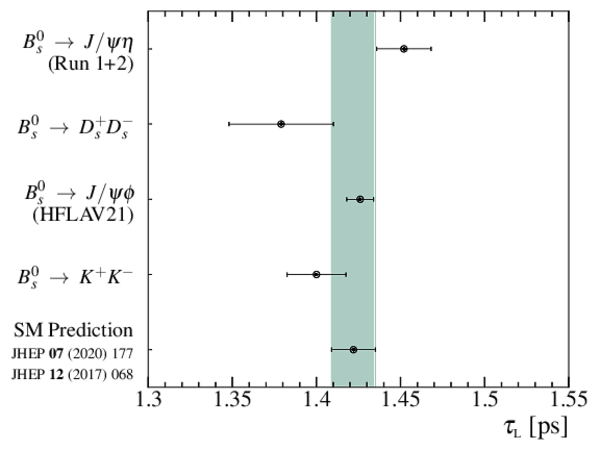
Summary of measurements of $\tau_{\rm L}$ from LHCb [7,8] along with the HFLAV average [35] determined using the measurements of $\Gamma_s$ and $\Delta \Gamma_s$ made using the $ B ^0_ s \rightarrow J/\psi \phi$ decay mode. The SM prediction, calculated using the values in Refs. [1,4] is shown by the grey-green band. |
fig4.pdf [271 KiB] HiDef png [100 KiB] Thumbnail [70 KiB] |
|
|
Animated gif made out of all figures. |
PAPER-2022-010.gif Thumbnail |

|
![HiDef png [758 KiB]](Directory_LHCb-PAPER-2022-010/hidef_fig1a.png)
![HiDef png [762 KiB]](Directory_LHCb-PAPER-2022-010/hidef_fig1b.png)
![HiDef png [848 KiB]](Directory_LHCb-PAPER-2022-010/hidef_fig1c.png)
![HiDef png [1003 KiB]](Directory_LHCb-PAPER-2022-010/hidef_fig1d.png)
![HiDef png [835 KiB]](Directory_LHCb-PAPER-2022-010/hidef_fig1e.png)
![HiDef png [953 KiB]](Directory_LHCb-PAPER-2022-010/hidef_fig1f.png)
![HiDef png [885 KiB]](Directory_LHCb-PAPER-2022-010/hidef_fig1g.png)
![HiDef png [1 MiB]](Directory_LHCb-PAPER-2022-010/hidef_fig1h.png)
![HiDef png [134 KiB]](Directory_LHCb-PAPER-2022-010/hidef_fig2a.png)
![HiDef png [93 KiB]](Directory_LHCb-PAPER-2022-010/hidef_fig3a.png)
![HiDef png [77 KiB]](Directory_LHCb-PAPER-2022-010/hidef_fig3b.png)
![HiDef png [100 KiB]](Directory_LHCb-PAPER-2022-010/hidef_fig4.png)
Tables and captions
|
Systematic uncertainties on the lifetime measurement in $\text{ fs}$. Uncertainties less than $0.1\text{ fs}$ are indicated with a dash. |
Table_1.pdf [72 KiB] HiDef png [133 KiB] Thumbnail [59 KiB] tex code |

|
![HiDef png [133 KiB]](Directory_LHCb-PAPER-2022-010/hidef_Table_1.png)
Created on 27 April 2024.