Search for the rare decays $W^{+}\rightarrow{D^{+}_{s}\gamma}$ and $Z\rightarrow{D^{0}\gamma}$ at LHCb
[to restricted-access page]Information
LHCb-PAPER-2022-033
CERN-EP-2022-252
arXiv:2212.07120 [PDF]
(Submitted on 14 Dec 2022)
Chin. Phys. C
Inspire 2614213
Tools
Abstract
A search for the rare decays $W^{+}\rightarrow{D^{+}_{s}\gamma}$ and $Z\rightarrow{D^{0}\gamma}$ is performed using proton-proton collision data collected by the LHCb experiment at a centre-of-mass energy of 13 TeV, corresponding to an integrated luminosity of 2.0 fb$^{-1}$. No significant signal is observed for either decay mode and upper limits on their branching fractions are set using $W^{+}\rightarrow{\mu^{+}\nu}$ and $Z\rightarrow{\mu^{+}\mu^{-}}$ decays as normalization channels. The upper limits are $6.5\times10^{-4}$ and $2.1\times10^{-3}$ at 95 confidence level for the $W^{+}\rightarrow{D^{+}_{s}\gamma}$ and $Z\rightarrow{D^{0}\gamma}$ decay modes, respectively. This is the first reported search for the $Z\rightarrow{D^{0}\gamma}$ decay, while the upper limit on the $W^{+}\rightarrow{D^{+}_{s}\gamma}$ branching fraction improves upon the previous best limit.
Figures and captions
|
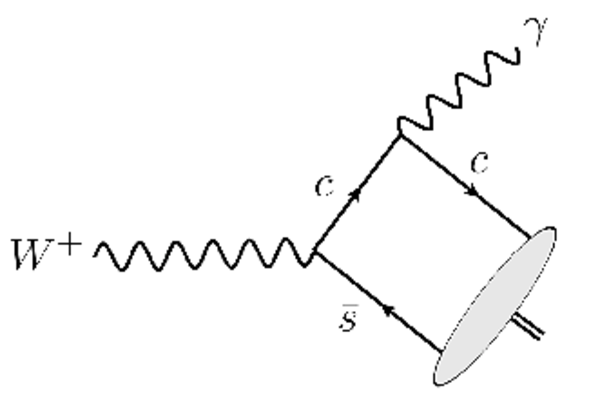
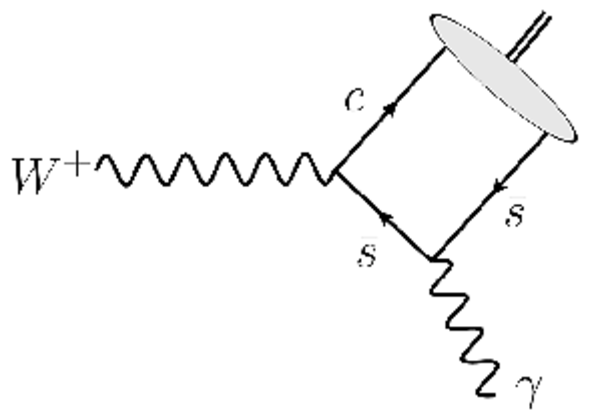
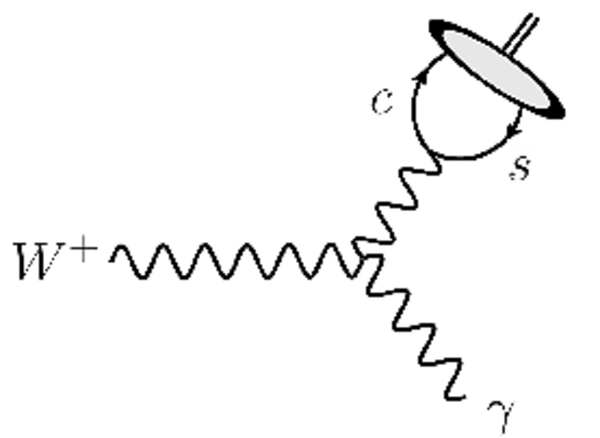
Tree-level Feynman diagrams for the decay $ W ^+ \rightarrow D ^+_ s {\gamma } $ . |
Fig1a.pdf [210 KiB] HiDef png [111 KiB] Thumbnail [97 KiB] *.C file |
|
|
Fig1b.pdf [184 KiB] HiDef png [125 KiB] Thumbnail [114 KiB] *.C file |
|
|
|
Fig1c.pdf [168 KiB] HiDef png [127 KiB] Thumbnail [112 KiB] *.C file |
|
|
|
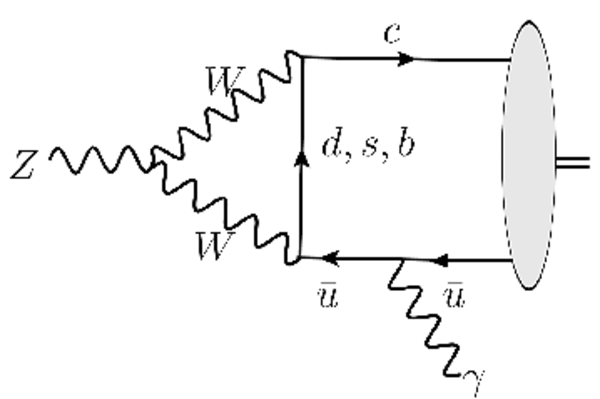
Feynman diagrams contributing to the $ Z \rightarrow D ^0 {\gamma } $ decay in the SM. |
Fig2a.pdf [263 KiB] HiDef png [143 KiB] Thumbnail [107 KiB] *.C file |
|
|
Fig2b.pdf [259 KiB] HiDef png [135 KiB] Thumbnail [112 KiB] *.C file |

|
|
|
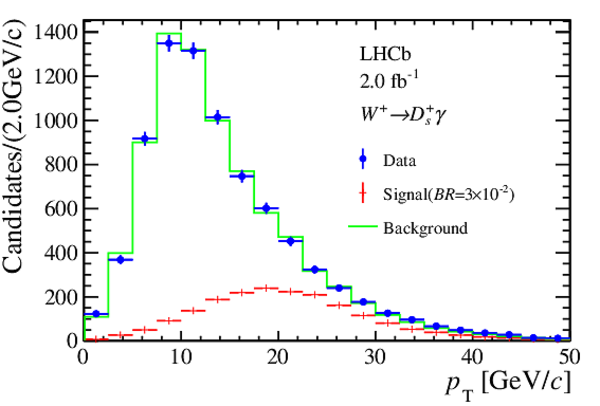
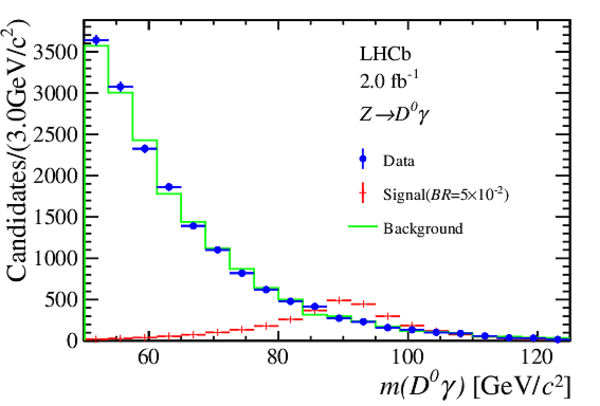
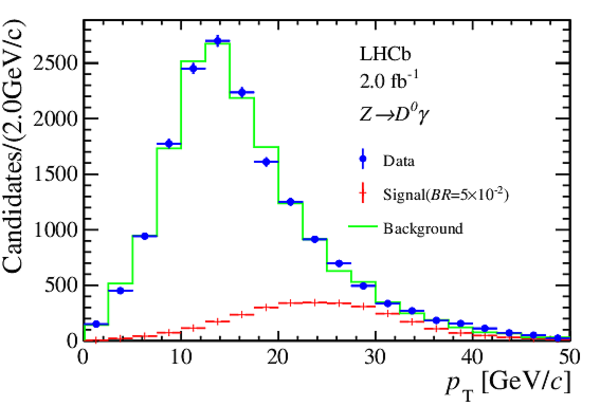
Distributions of (left) pseudomass and (right) $ p_{\mathrm{T}}$ for (upper) $ W ^+ \rightarrow D ^+_ s {\gamma } $ and (lower) $ Z \rightarrow D ^0 {\gamma } $ candidates. The blue points represent the selected data candidates, the red points represent simulated signal events, normalized to the branching fraction of $ W ^+ \rightarrow D ^+_ s {\gamma } $ ( $ Z \rightarrow D ^0 {\gamma } $ ) set to $3\times10^{-2}$ ($5\times10^{-2}$), and the green lines represent the background shape, derived from pseudodata. |
Fig3a.pdf [16 KiB] HiDef png [174 KiB] Thumbnail [162 KiB] *.C file |

|
|
Fig3b.pdf [16 KiB] HiDef png [170 KiB] Thumbnail [160 KiB] *.C file |
|
|
|
Fig3c.pdf [16 KiB] HiDef png [174 KiB] Thumbnail [162 KiB] *.C file |
|
|
|
Fig3d.pdf [16 KiB] HiDef png [163 KiB] Thumbnail [154 KiB] *.C file |
|
|
|
Upper limits on branching fractions of the (left) $ W ^+ \rightarrow D ^+_ s {\gamma } $ and (right) $ Z \rightarrow D ^0 {\gamma } $ decays. |
Fig4a.pdf [21 KiB] HiDef png [172 KiB] Thumbnail [143 KiB] *.C file |

|
|
Fig4b.pdf [21 KiB] HiDef png [164 KiB] Thumbnail [134 KiB] *.C file |

|
|
|
Animated gif made out of all figures. |
PAPER-2022-033.gif Thumbnail |

|
![HiDef png [111 KiB]](Directory_LHCb-PAPER-2022-033/hidef_Fig1a.png)
![HiDef png [125 KiB]](Directory_LHCb-PAPER-2022-033/hidef_Fig1b.png)
![HiDef png [127 KiB]](Directory_LHCb-PAPER-2022-033/hidef_Fig1c.png)
![HiDef png [143 KiB]](Directory_LHCb-PAPER-2022-033/hidef_Fig2a.png)
![HiDef png [135 KiB]](Directory_LHCb-PAPER-2022-033/hidef_Fig2b.png)
![HiDef png [174 KiB]](Directory_LHCb-PAPER-2022-033/hidef_Fig3a.png)
![HiDef png [170 KiB]](Directory_LHCb-PAPER-2022-033/hidef_Fig3b.png)
![HiDef png [174 KiB]](Directory_LHCb-PAPER-2022-033/hidef_Fig3c.png)
![HiDef png [163 KiB]](Directory_LHCb-PAPER-2022-033/hidef_Fig3d.png)
![HiDef png [172 KiB]](Directory_LHCb-PAPER-2022-033/hidef_Fig4a.png)
![HiDef png [164 KiB]](Directory_LHCb-PAPER-2022-033/hidef_Fig4b.png)
Tables and captions
|
Relative systematic uncertainties (in %) in the $\cal{R}$ measurements for the $ Z \rightarrow D ^0 {\gamma } $ and $ W ^+ \rightarrow D ^+_ s {\gamma } $ decay modes. The total systematic uncertainty is obtained from the sum in quadrature of all contributions. |
Table_1.pdf [64 KiB] HiDef png [86 KiB] Thumbnail [40 KiB] tex code |

|
![HiDef png [86 KiB]](Directory_LHCb-PAPER-2022-033/hidef_Table_1.png)
Created on 27 April 2024.