Measurement of $\Upsilon$ production in $pp$ collisions at $\sqrt{s}=5 \ \rm{TeV}$
[to restricted-access page]Information
LHCb-PAPER-2022-036
CERN-EP-2022-269
arXiv:2212.12664 [PDF]
(Submitted on 24 Dec 2022)
JHEP 07 (2023) 069
Inspire 2618202
Tools
Abstract
The production cross-sections of $\Upsilon$ mesons, namely $\Upsilon(1S)$, $\Upsilon(2S)$ and $\Upsilon(3S)$, in $pp$ collisions at $\sqrt{s}=5 \ \rm{TeV}$ are measured with a data sample corresponding to an integrated luminosity of $9.13\pm{0.18} \ \rm{pb}^{-1}$ collected by the LHCb detector. The $\Upsilon$ mesons are reconstructed in the decay mode $\Upsilon \to {\mu}^+ {\mu}^-$. Double differential cross-sections times branching fractions, as functions of the transverse momentum $p_{\rm{T}}$ and the rapidity $y$ of the $\Upsilon$ mesons, are measured in the range $p_{\rm{T}} < 20 \ \rm{GeV}/c$ and $2.0<y<4.5$. The results integrated over these $p_{\rm{T}}$ and $y$ ranges are $\sigma(\Upsilon(1S)) \times\mathcal{B}(\Upsilon(1S)\to {\mu}^+ {\mu}^-) = 2101\pm33\pm83 \ \rm{pb},$ $\sigma(\Upsilon(2S)) \times\mathcal{B}(\Upsilon(2S)\to {\mu}^+ {\mu}^-) = 526\pm20\pm21 \ \rm{pb},$ $\sigma(\Upsilon(3S)) \times\mathcal{B}(\Upsilon(3S)\to {\mu}^+ {\mu}^-) = 242\pm16\pm10 \ \rm{pb},$ where the first uncertainties are statistical and the second are systematic. The ratios of cross-sections between measurements of two different $\Upsilon$ states and between measurements at different center-of-mass energies are determined. The nuclear modification factor of $\Upsilon(1S)$ at $\sqrt{s}=5 \ \rm{TeV}$ is updated as well using the directly measured cross-section results from this analysis.
Figures and captions
|
Invariant mass distribution of $\Upsilon $ candidates in the kinematic range $ p_{\mathrm{T}} \in[0,20]\text{ Ge V /}c $ and $y\in[2.0,4.5]$. The result of the fit with three Crystal Ball functions for the signal plus an exponential function for the background is also shown. |
Fig1.pdf [36 KiB] HiDef png [717 KiB] Thumbnail [308 KiB] *.C file |

|
|
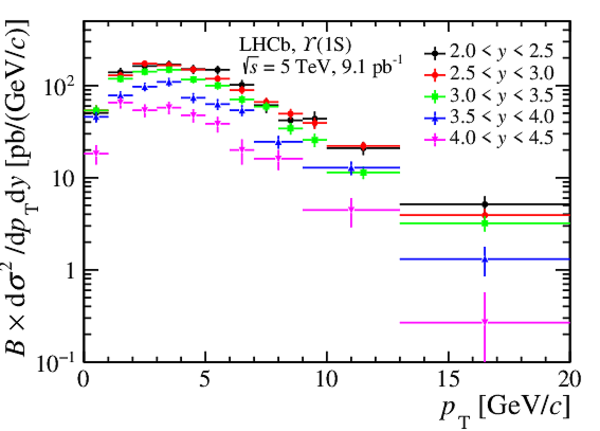
Double-differential cross-section times $\Upsilon \rightarrow \mu ^+\mu ^- $ branching fraction as a function of $ p_{\mathrm{T}} $ in bins of $y$ for (upper left) ${\Y1S} $, (upper right) ${\Y2S} $ and (bottom) ${\Y3S} $ mesons. Statistical and systematic uncertainties are added in quadrature. |
Fig2a.pdf [17 KiB] HiDef png [166 KiB] Thumbnail [164 KiB] *.C file |
|
|
Fig2b.pdf [17 KiB] HiDef png [180 KiB] Thumbnail [176 KiB] *.C file |

|
|
|
Fig2c.pdf [17 KiB] HiDef png [183 KiB] Thumbnail [173 KiB] *.C file |

|
|
|
Differential cross-section times $\Upsilon \rightarrow \mu ^+\mu ^- $ branching fraction (left) as a function of $ p_{\mathrm{T}} $ for $y$ integrated from 2.0 to 4.5 and (right) as a function of $y$ for $ p_{\mathrm{T}} $ integrated from 0 to 20 $\text{ Ge V /}c$ , for the ${\Y1S} $, ${\Y2S} $ and ${\Y3S} $ states. Statistical and systematic uncertainties are added in quadrature. |
Fig3a.pdf [15 KiB] HiDef png [129 KiB] Thumbnail [128 KiB] *.C file |

|
|
Fig3b.pdf [14 KiB] HiDef png [128 KiB] Thumbnail [134 KiB] *.C file |

|
|
|
Differential cross-section of ${\Y1S} $ mesons as a function of $ p_{\mathrm{T}} $, compared with the NRQCD prediction of Ref. \cite{Feng:2015wka}. |
Fig4.pdf [15 KiB] HiDef png [193 KiB] Thumbnail [158 KiB] *.C file |

|
|
Production cross-sections in the range $ p_{\mathrm{T}} < 15 \text{ Ge V /}c $ and $2.0 < y < 4.5$ multiplied by $\Upsilon \rightarrow \mu ^+\mu ^- $ branching fractions as a function of the centre-of-mass energy of $pp$ collisions for (black boxes) ${\Y1S} $, (red upward triangles) ${\Y2S} $ and (blue downward triangles) ${\Y3S} $ states. Statistical and systematic uncertainties are added in quadrature. |
Fig5.pdf [13 KiB] HiDef png [88 KiB] Thumbnail [79 KiB] *.C file |

|
|
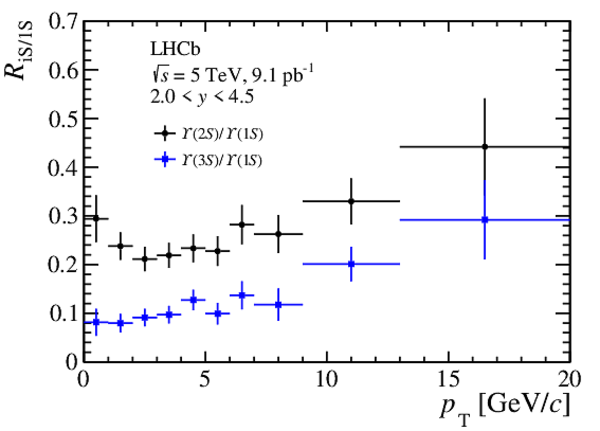
Ratios of the ${\Y2S} $ or ${\Y3S} $ production cross-section over that of the ${\Y1S} $ state, (left) as a function of $ p_{\mathrm{T}} $ for $2.0<y<4.5$ and (right) as a function of $y$ for $ p_{\mathrm{T}} <20\text{ Ge V /}c $. Statistical and systematic uncertainties are added in quadrature. |
Fig6a.pdf [15 KiB] HiDef png [124 KiB] Thumbnail [130 KiB] *.C file |
|
|
Fig6b.pdf [14 KiB] HiDef png [110 KiB] Thumbnail [118 KiB] *.C file |

|
|
|
Ratios of $\Upsilon $ production cross-sections measured at $\sqrt{s} =13\text{ Te V} $ over those measured at $ \sqrt{s} =5\text{ Te V} $ (left) as a function of $ p_{\mathrm{T}} $ for $2.0<y<4.5$ and (right) as a function of $y$ for $ p_{\mathrm{T}} <20\text{ Ge V /}c $. The statistical and systematic uncertainties are added in quadrature. |
Fig7a.pdf [16 KiB] HiDef png [126 KiB] Thumbnail [125 KiB] *.C file |

|
|
Fig7b.pdf [15 KiB] HiDef png [110 KiB] Thumbnail [116 KiB] *.C file |

|
|
|
Nuclear modification factor $R_{p{\rm Pb}}$ as a function of $y$ for the ${\Y1S} $ state, together with the theoretical predictions mentioned in the text. The inner error bars show the statistical uncertainties, while the outer ones show the statistical and systematic uncertainties added in quadrature. |
Fig8.pdf [17 KiB] HiDef png [276 KiB] Thumbnail [203 KiB] *.C file |

|
|
Animated gif made out of all figures. |
PAPER-2022-036.gif Thumbnail |

|
![HiDef png [717 KiB]](Directory_LHCb-PAPER-2022-036/hidef_Fig1.png)
![HiDef png [166 KiB]](Directory_LHCb-PAPER-2022-036/hidef_Fig2a.png)
![HiDef png [180 KiB]](Directory_LHCb-PAPER-2022-036/hidef_Fig2b.png)
![HiDef png [183 KiB]](Directory_LHCb-PAPER-2022-036/hidef_Fig2c.png)
![HiDef png [129 KiB]](Directory_LHCb-PAPER-2022-036/hidef_Fig3a.png)
![HiDef png [128 KiB]](Directory_LHCb-PAPER-2022-036/hidef_Fig3b.png)
![HiDef png [193 KiB]](Directory_LHCb-PAPER-2022-036/hidef_Fig4.png)
![HiDef png [88 KiB]](Directory_LHCb-PAPER-2022-036/hidef_Fig5.png)
![HiDef png [124 KiB]](Directory_LHCb-PAPER-2022-036/hidef_Fig6a.png)
![HiDef png [110 KiB]](Directory_LHCb-PAPER-2022-036/hidef_Fig6b.png)
![HiDef png [126 KiB]](Directory_LHCb-PAPER-2022-036/hidef_Fig7a.png)
![HiDef png [110 KiB]](Directory_LHCb-PAPER-2022-036/hidef_Fig7b.png)
![HiDef png [276 KiB]](Directory_LHCb-PAPER-2022-036/hidef_Fig8.png)
Tables and captions
|
Relative systematic uncertainty ($\%$) from various sources. The ranges correspond to results measured in each $( p_{\mathrm{T}} ,y)$ bin of $\Upsilon $ mesons. For some systematic uncertainties, the results are correlated among different $( p_{\mathrm{T}} ,y)$ bins as noted in the last column. |
Table_1.pdf [42 KiB] HiDef png [75 KiB] Thumbnail [33 KiB] tex code |

|
|
Differential cross-section times the $\Upsilon \rightarrow \mu ^+\mu ^- $ branching fraction (in unit of pb$/( \text{ Ge V /}c )$) in bins of ( $ p_{\mathrm{T}}$ , $y$) for the ${\Y1S} $ meson. The first uncertainties are statistical and the second are systematic. |
Table_2.pdf [52 KiB] HiDef png [105 KiB] Thumbnail [49 KiB] tex code |

|
|
Differential cross-section times the $\Upsilon \rightarrow \mu ^+\mu ^- $ branching fraction (in unit of pb$/( \text{ Ge V /}c )$) in bins of ( $ p_{\mathrm{T}}$ , $y$) for the ${\Y2S} $ meson. The first uncertainties are statistical and the second are systematic. |
Table_3.pdf [51 KiB] HiDef png [101 KiB] Thumbnail [47 KiB] tex code |

|
|
Differential cross-section times the $\Upsilon \rightarrow \mu ^+\mu ^- $ branching fraction (in unit of pb$/( \text{ Ge V /}c )$) in bins of ( $ p_{\mathrm{T}}$ , $y$) for the ${\Y3S} $ meson. The first uncertainties are statistical and the second are systematic. |
Table_4.pdf [51 KiB] HiDef png [112 KiB] Thumbnail [51 KiB] tex code |

|
|
Differential cross-section times the $\Upsilon \rightarrow \mu ^+\mu ^- $ branching fraction (in unit of pb$/( \text{ Ge V /}c )$) of the ${\Y1S} $, ${\Y2S} $ and ${\Y3S} $ mesons as a function of $ p_{\mathrm{T}} $ for $y$ integrated from 2.0 to 4.5. |
Table_5.pdf [51 KiB] HiDef png [91 KiB] Thumbnail [48 KiB] tex code |

|
|
Differential cross-section times the $\Upsilon \rightarrow \mu ^+\mu ^- $ branching fraction (in unit of pb) of ${\Y1S} $, ${\Y2S} $ and ${\Y3S} $ mesons as a function $y$ for $ p_{\mathrm{T}} $ integrated from 0 to 20 $\text{ Ge V /}c $. |
Table_6.pdf [42 KiB] HiDef png [56 KiB] Thumbnail [29 KiB] tex code |

|
|
Cross-section ratios between $\sqrt{s}=13\text{ Te V} $ and $5\text{ Te V} $ of ${\Y1S} $, ${\Y2S} $ and ${\Y3S} $ mesons as a function of $ p_{\mathrm{T}} $ for $y$ integrated from 2.0 to 4.5. |
Table_7.pdf [51 KiB] HiDef png [110 KiB] Thumbnail [54 KiB] tex code |

|
|
Cross-section ratios between $\sqrt{s}=13\text{ Te V} $ and $5\text{ Te V} $ of ${\Y1S} $, ${\Y2S} $ and ${\Y3S} $ mesons as a function of $y$ for $ p_{\mathrm{T}} $ integrated from 0 to 20 $\text{ Ge V /}c $. |
Table_8.pdf [42 KiB] HiDef png [59 KiB] Thumbnail [32 KiB] tex code |

|
|
Relative changes of double-differential cross-sections of $\Upsilon (1S)$ (in %), for a polarisation of $\lambda_{\theta}=0.1$ rather than zero, in ( $ p_{\mathrm{T}}$ ,$y$) intervals. |
Table_9.pdf [51 KiB] HiDef png [116 KiB] Thumbnail [58 KiB] tex code |

|
|
Relative changes of cross-sections of $\Upsilon (2S)$ (in %), for a polarisation of $\lambda_{\theta}=0.1$ rather than zero, in ( $ p_{\mathrm{T}}$ ,$y$) intervals. |
Table_10.pdf [51 KiB] HiDef png [117 KiB] Thumbnail [58 KiB] tex code |

|
|
Relative changes of cross-sections of $\Upsilon (3S)$ (in %), for a polarisation of $\lambda_{\theta}=0.1$ rather than zero, in ( $ p_{\mathrm{T}}$ ,$y$) intervals |
Table_11.pdf [51 KiB] HiDef png [115 KiB] Thumbnail [58 KiB] tex code |

|
|
Relative changes of cross-sections of $\Upsilon (1S)$ (in %), for a polarisation of $\lambda_{\theta}=1$ rather than zero, in ( $ p_{\mathrm{T}}$ ,$y$) intervals |
Table_12.pdf [51 KiB] HiDef png [103 KiB] Thumbnail [54 KiB] tex code |

|
|
Relative changes of cross-sections of $\Upsilon (2S)$ (in %), for a polarisation of $\lambda_{\theta}=1$ rather than zero, in ( $ p_{\mathrm{T}}$ ,$y$) intervals. |
Table_13.pdf [51 KiB] HiDef png [103 KiB] Thumbnail [54 KiB] tex code |

|
|
Relative changes of cross-sections of $\Upsilon (3S)$ (in %), for a polarisation of $\lambda_{\theta}=1$ rather than zero, in ( $ p_{\mathrm{T}}$ ,$y$) intervals. |
Table_14.pdf [51 KiB] HiDef png [104 KiB] Thumbnail [54 KiB] tex code |

|
|
Relative changes of cross-sections of $\Upsilon (1S)$ (in %), for a polarisation of $\lambda_{\theta}=-1$ rather than zero, in ( $ p_{\mathrm{T}}$ ,$y$) intervals. |
Table_15.pdf [51 KiB] HiDef png [94 KiB] Thumbnail [48 KiB] tex code |

|
|
Relative changes of cross-sections of $\Upsilon (2S)$ (in %), for a polarisation of $\lambda_{\theta}=-1$ rather than zero, in ( $ p_{\mathrm{T}}$ ,$y$) intervals. |
Table_16.pdf [51 KiB] HiDef png [95 KiB] Thumbnail [49 KiB] tex code |

|
|
Relative changes of cross-sections of $\Upsilon (3S)$ (in %), for a polarisation of $\lambda_{\theta}=-1$ rather than zero, in ( $ p_{\mathrm{T}}$ ,$y$) intervals. |
Table_17.pdf [51 KiB] HiDef png [95 KiB] Thumbnail [48 KiB] tex code |

|
![HiDef png [75 KiB]](Directory_LHCb-PAPER-2022-036/hidef_Table_1.png)
![HiDef png [105 KiB]](Directory_LHCb-PAPER-2022-036/hidef_Table_2.png)
![HiDef png [101 KiB]](Directory_LHCb-PAPER-2022-036/hidef_Table_3.png)
![HiDef png [112 KiB]](Directory_LHCb-PAPER-2022-036/hidef_Table_4.png)
![HiDef png [91 KiB]](Directory_LHCb-PAPER-2022-036/hidef_Table_5.png)
![HiDef png [56 KiB]](Directory_LHCb-PAPER-2022-036/hidef_Table_6.png)
![HiDef png [110 KiB]](Directory_LHCb-PAPER-2022-036/hidef_Table_7.png)
![HiDef png [59 KiB]](Directory_LHCb-PAPER-2022-036/hidef_Table_8.png)
![HiDef png [116 KiB]](Directory_LHCb-PAPER-2022-036/hidef_Table_9.png)
![HiDef png [117 KiB]](Directory_LHCb-PAPER-2022-036/hidef_Table_10.png)
![HiDef png [115 KiB]](Directory_LHCb-PAPER-2022-036/hidef_Table_11.png)
![HiDef png [103 KiB]](Directory_LHCb-PAPER-2022-036/hidef_Table_12.png)
![HiDef png [103 KiB]](Directory_LHCb-PAPER-2022-036/hidef_Table_13.png)
![HiDef png [104 KiB]](Directory_LHCb-PAPER-2022-036/hidef_Table_14.png)
![HiDef png [94 KiB]](Directory_LHCb-PAPER-2022-036/hidef_Table_15.png)
![HiDef png [95 KiB]](Directory_LHCb-PAPER-2022-036/hidef_Table_16.png)
![HiDef png [95 KiB]](Directory_LHCb-PAPER-2022-036/hidef_Table_17.png)
Created on 26 April 2024.