First observation and branching fraction measurement of the $ {\Lambda}_b^0\to {D}_s^{-}p $ decay
[to restricted-access page]Information
LHCb-PAPER-2022-038
CERN-EP-2022-272
arXiv:2212.12574 [PDF]
(Submitted on 23 Dec 2022)
JHEP 07 (2023) 075
Inspire 2618313
Tools
Abstract
The first observation of the $\Lambda_b^0\to D_s^- p$ decay is presented using proton-proton collision data collected by the LHCb experiment at a centre-of-mass energy of ${\sqrt{s}=13 \textrm{TeV}}$, corresponding to a total integrated luminosity of $6 \textrm{fb}^{-1}$. Using the $\Lambda_b^0\to\Lambda_c^+\pi^-$ decay as the normalisation mode, the branching fraction of the $\Lambda_b^0\to D_s^- p$ decay is measured to be ${\mathcal{B}(\Lambda_b^0\to D_s^- p)=(12.6 \pm 0.5 \pm 0.3 \pm 1.2 )\times 10^{-6}}$, where the first uncertainty is statistical, the second systematic and the third due to uncertainties in the branching fractions of the $\Lambda_b^0\to\Lambda_c^+\pi^-$, $D_s^- \to K^-K^+\pi^-$ and $\Lambda_c^+\to p K^- \pi^+$ decays.
Figures and captions
|
Tree diagram contributing to the $\Lambda ^0_ b \rightarrow D ^-_ s p$ decay. |
Fig1a.pdf [34 KiB] HiDef png [39 KiB] Thumbnail [18 KiB] *.C file |

|
|
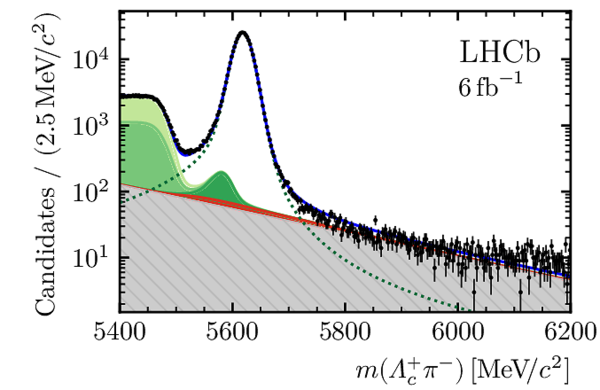
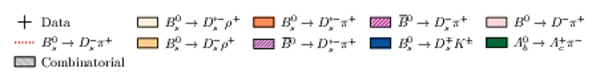
Invariant-mass distribution of $\Lambda ^0_ b \rightarrow \Lambda ^+_ c \pi ^- $ candidates, the normalisation channel in this measurement. The size of the signal peak compared to the backgrounds can be seen clearly in the linear plot on the left, whereas the individual components are displayed more clearly in the logarithmic plot on the right. Overlaid are the fit projections of the signal and background contributions, with individual components illustrated in the legend above. |
Fig2a.pdf [10 KiB] HiDef png [59 KiB] Thumbnail [57 KiB] *.C file |

|
|
Fig2b.pdf [100 KiB] HiDef png [169 KiB] Thumbnail [127 KiB] *.C file |

|
|
|
Fig2c.pdf [121 KiB] HiDef png [405 KiB] Thumbnail [284 KiB] *.C file |
|
|
|
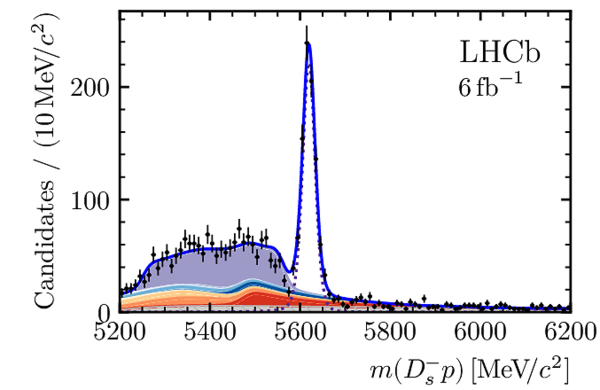
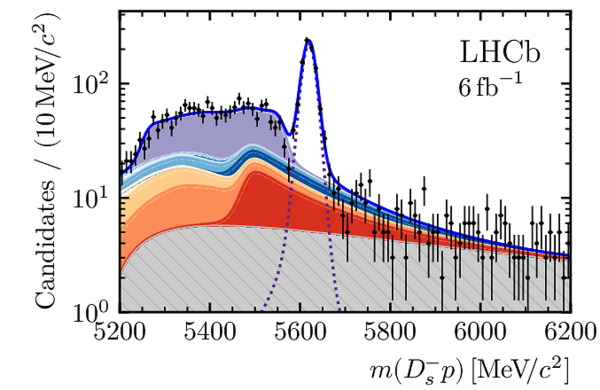
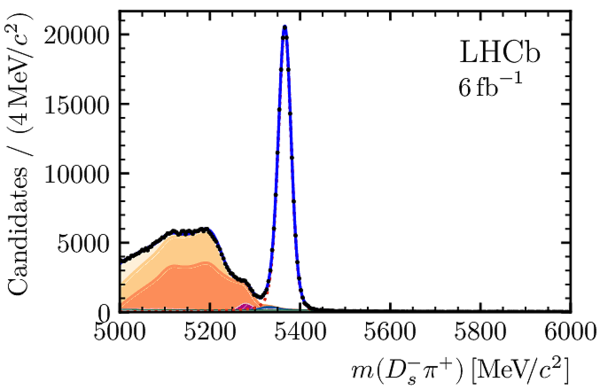
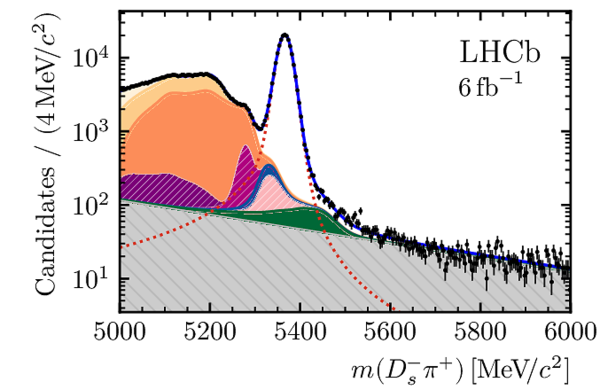
Invariant-mass distribution of $\Lambda ^0_ b \rightarrow D ^-_ s p $ candidates, in (left) linear and (right) logarithmic scale, where the fit projections of the signal and background contributions are overlaid. The individual components in the fit are illustrated in the legend. A few bins around $5575\text{ Me V /}c^2 $ show a disagreement between the model and the data. This effect is covered by the systematic uncertainties as described in the text. |
Fig3a.pdf [11 KiB] HiDef png [63 KiB] Thumbnail [48 KiB] *.C file |

|
|
Fig3b.pdf [184 KiB] HiDef png [309 KiB] Thumbnail [183 KiB] *.C file |
|
|
|
Fig3c.pdf [196 KiB] HiDef png [559 KiB] Thumbnail [329 KiB] *.C file |
|
|
|
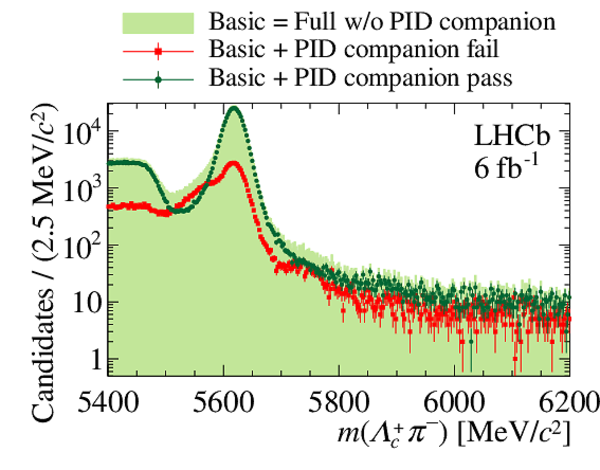
The (left) $m( D ^-_ s p)$ and (right) $m(\Lambda ^+_ c \pi ^- )$ invariant-mass distributions after the full selection without the PID requirement on the companion track (filled area) and passing (circles) or failing (squares) this selection. |
Fig4a.pdf [24 KiB] HiDef png [354 KiB] Thumbnail [279 KiB] *.C file |

|
|
Fig4b.pdf [36 KiB] HiDef png [512 KiB] Thumbnail [326 KiB] *.C file |
|
|
|
Invariant-mass distribution of $ B^0_s \rightarrow D_s^- \pi^+ $ candidates, in (left) linear and (right) logarithmic scale, where the signal and background contributions are overlaid. The individual components of the fit are illustrated in the legend. |
Fig5a.pdf [11 KiB] HiDef png [69 KiB] Thumbnail [55 KiB] *.C file |
|
|
Fig5b.pdf [152 KiB] HiDef png [222 KiB] Thumbnail [160 KiB] *.C file |
|
|
|
Fig5c.pdf [182 KiB] HiDef png [468 KiB] Thumbnail [309 KiB] *.C file |
|
|
|
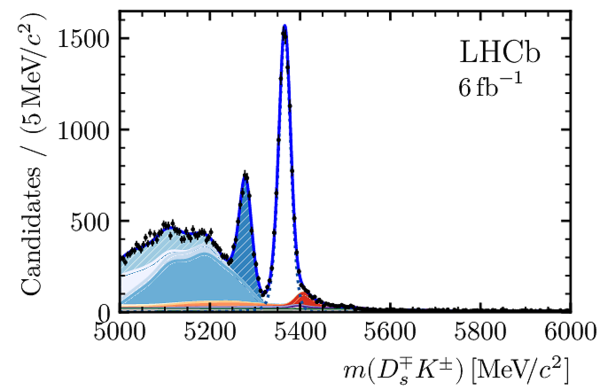
Invariant-mass distribution of $ B^0_s \rightarrow D_s^\mp K^\pm $ candidates, in (left) linear and (right) logarithmic scale, where the signal and background contributions are overlaid. The individual components in the fit are illustrated in the legend. |
Fig6a.pdf [12 KiB] HiDef png [83 KiB] Thumbnail [63 KiB] *.C file |

|
|
Fig6b.pdf [239 KiB] HiDef png [297 KiB] Thumbnail [181 KiB] *.C file |
|
|
|
Fig6c.pdf [270 KiB] HiDef png [547 KiB] Thumbnail [337 KiB] *.C file |

|
|
|
Animated gif made out of all figures. |
PAPER-2022-038.gif Thumbnail |

|
![HiDef png [39 KiB]](Directory_LHCb-PAPER-2022-038/hidef_Fig1a.png)
![HiDef png [59 KiB]](Directory_LHCb-PAPER-2022-038/hidef_Fig2a.png)
![HiDef png [169 KiB]](Directory_LHCb-PAPER-2022-038/hidef_Fig2b.png)
![HiDef png [405 KiB]](Directory_LHCb-PAPER-2022-038/hidef_Fig2c.png)
![HiDef png [63 KiB]](Directory_LHCb-PAPER-2022-038/hidef_Fig3a.png)
![HiDef png [309 KiB]](Directory_LHCb-PAPER-2022-038/hidef_Fig3b.png)
![HiDef png [559 KiB]](Directory_LHCb-PAPER-2022-038/hidef_Fig3c.png)
![HiDef png [354 KiB]](Directory_LHCb-PAPER-2022-038/hidef_Fig4a.png)
![HiDef png [512 KiB]](Directory_LHCb-PAPER-2022-038/hidef_Fig4b.png)
![HiDef png [69 KiB]](Directory_LHCb-PAPER-2022-038/hidef_Fig5a.png)
![HiDef png [222 KiB]](Directory_LHCb-PAPER-2022-038/hidef_Fig5b.png)
![HiDef png [468 KiB]](Directory_LHCb-PAPER-2022-038/hidef_Fig5c.png)
![HiDef png [83 KiB]](Directory_LHCb-PAPER-2022-038/hidef_Fig6a.png)
![HiDef png [297 KiB]](Directory_LHCb-PAPER-2022-038/hidef_Fig6b.png)
![HiDef png [547 KiB]](Directory_LHCb-PAPER-2022-038/hidef_Fig6c.png)
Tables and captions
|
A breakdown of the relative efficiency ratios of the $\Lambda ^0_ b \rightarrow \Lambda ^+_ c \pi ^- $ and $\Lambda ^0_ b \rightarrow D ^-_ s p$ decays, calculated after applying the preceding requirements. The uncertainty on the efficiencies is due to the size of the simulation and calibration samples. |
Table_1.pdf [69 KiB] HiDef png [60 KiB] Thumbnail [27 KiB] tex code |

|
|
Summary of the systematic uncertainties as a percentage of the branching fraction of the $\Lambda ^0_ b \rightarrow D ^-_ s p $ decay. The total systematic uncertainty is the quadratic sum of the individual sources. |
Table_2.pdf [63 KiB] HiDef png [102 KiB] Thumbnail [44 KiB] tex code |

|
|
Obtained signal yields and efficiencies of the $\Lambda ^0_ b \rightarrow D ^-_ s p $ and $\Lambda ^0_ b \rightarrow \Lambda ^+_ c \pi ^- $ decays, as well as branching fractions used for this measurement [7]. The uncertainty on the signal yields and efficiencies is statistical. |
Table_3.pdf [68 KiB] HiDef png [53 KiB] Thumbnail [26 KiB] tex code |

|
![HiDef png [60 KiB]](Directory_LHCb-PAPER-2022-038/hidef_Table_1.png)
![HiDef png [102 KiB]](Directory_LHCb-PAPER-2022-038/hidef_Table_2.png)
![HiDef png [53 KiB]](Directory_LHCb-PAPER-2022-038/hidef_Table_3.png)
Created on 02 May 2024.