Measurement of the ratios of branching fractions $\mathcal{R}(D^{*})$ and $\mathcal{R}(D^{0})$
[to restricted-access page]Information
LHCb-PAPER-2022-039
CERN-EP-2022-284
arXiv:2302.02886 [PDF]
(Submitted on 06 Feb 2023)
Phys. Rev. Lett. 131 (2023) 111802
Inspire 2629770
Tools
Abstract
The ratios of branching fractions $\mathcal{R}(D^{*})\equiv\mathcal{B}(\bar{B}\to D^{*}\tau^{-}\bar{\nu}_{\tau})/\mathcal{B}(\bar{B}\to D^{*}\mu^{-}\bar{\nu}_{\mu})$ and $\mathcal{R}(D^{0})\equiv\mathcal{B}(B^{-}\to D^{0}\tau^{-}\bar{\nu}_{\tau})/\mathcal{B}(B^{-}\to D^{0}\mu^{-}\bar{\nu}_{\mu})$ are measured, assuming isospin symmetry, using a sample of proton-proton collision data corresponding to 3.0 fb${ }^{-1}$ of integrated luminosity recorded by the LHCb experiment during 2011 and 2012. The tau lepton is identified in the decay mode $\tau^{-}\to\mu^{-}\nu_{\tau}\bar{\nu}_{\mu}$. The measured values are $\mathcal{R}(D^{*})=0.281\pm0.018\pm0.024$ and $\mathcal{R}(D^{0})=0.441\pm0.060\pm0.066$, where the first uncertainty is statistical and the second is systematic. The correlation between these measurements is $\rho=-0.43$. Results are consistent with the current average of these quantities and are at a combined 1.9 standard deviations from the predictions based on lepton flavor universality in the Standard Model.
Figures and captions
|
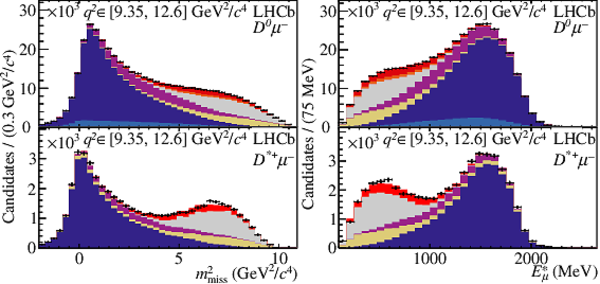
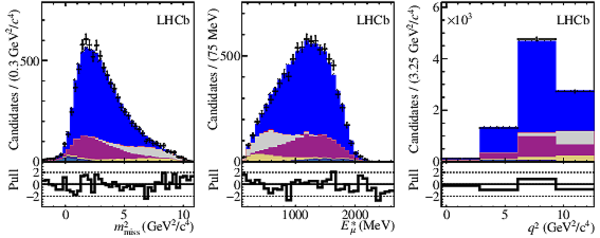
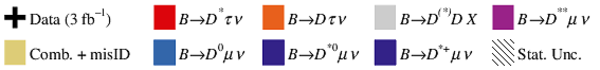
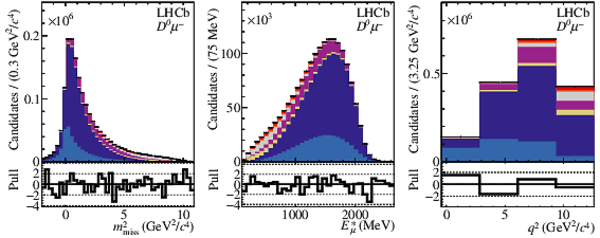
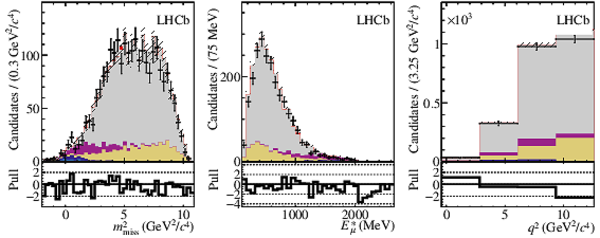
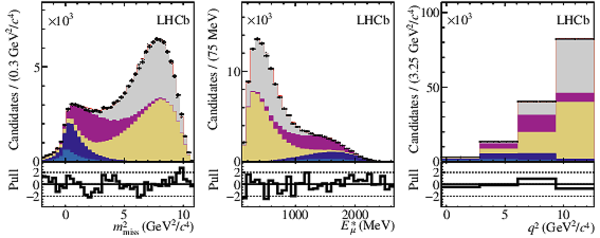
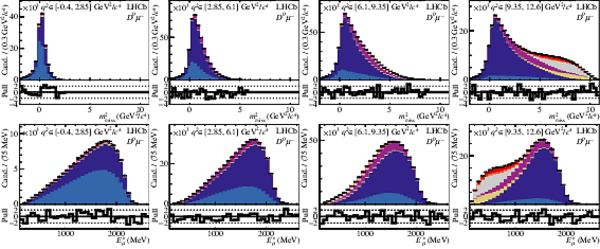
Distributions of (left) $m^2_{\rm miss}$ and (right) $ E^{*}_{\mu}$ in the highest $ q^{2}$ bin (above 9.35 $\text{ Ge V} ^2 /c^4$ ) of the (top) $ D ^0$ $\mu ^-$ and (bottom) $ D ^{*+}$ $\mu ^-$ signal data, overlaid with projections of the fit model. |
Fig1a.pdf [41 KiB] HiDef png [351 KiB] Thumbnail [281 KiB] *.C file |
|
|
Fig1b.pdf [13 KiB] HiDef png [223 KiB] Thumbnail [239 KiB] *.C file |

|
|
|
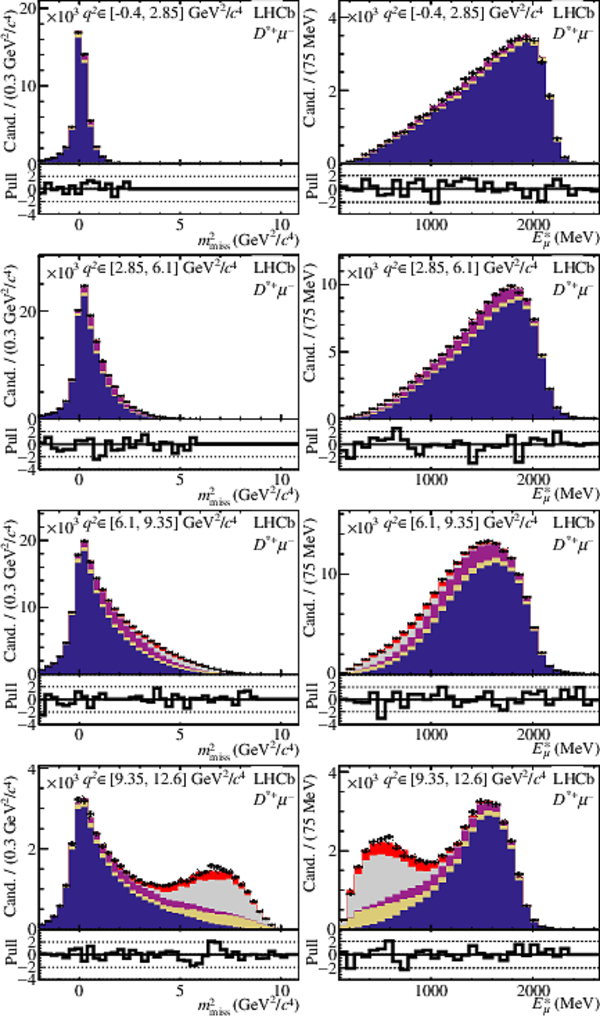
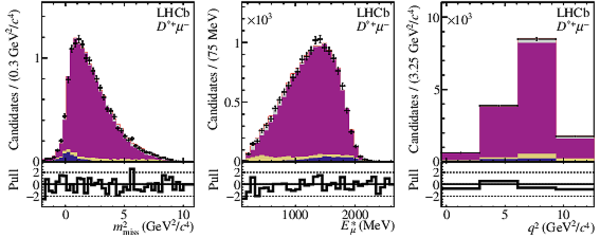
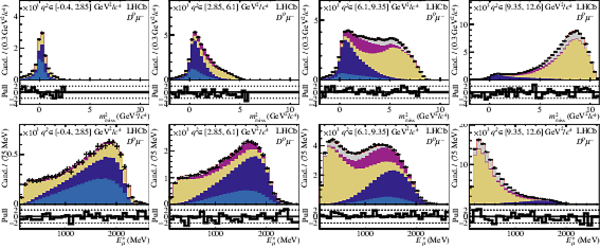
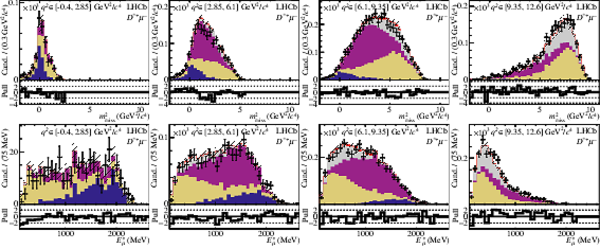
Distributions of (left) $m^2_{\rm miss}$ and (right) $ E^{*}_{\mu}$ in each $ q^{2}$ bin of the $ D ^{*+}$ $\mu ^-$ signal data, overlaid with projections of the fit model. Below each panel differences between the data and fit are shown, normalized by the summed statistical uncertainty of the data and simulation samples. |
FigA1a.pdf [248 KiB] HiDef png [871 KiB] Thumbnail [936 KiB] *.C file |
|
|
FigA1b.pdf [13 KiB] HiDef png [223 KiB] Thumbnail [239 KiB] *.C file |

|
|
|
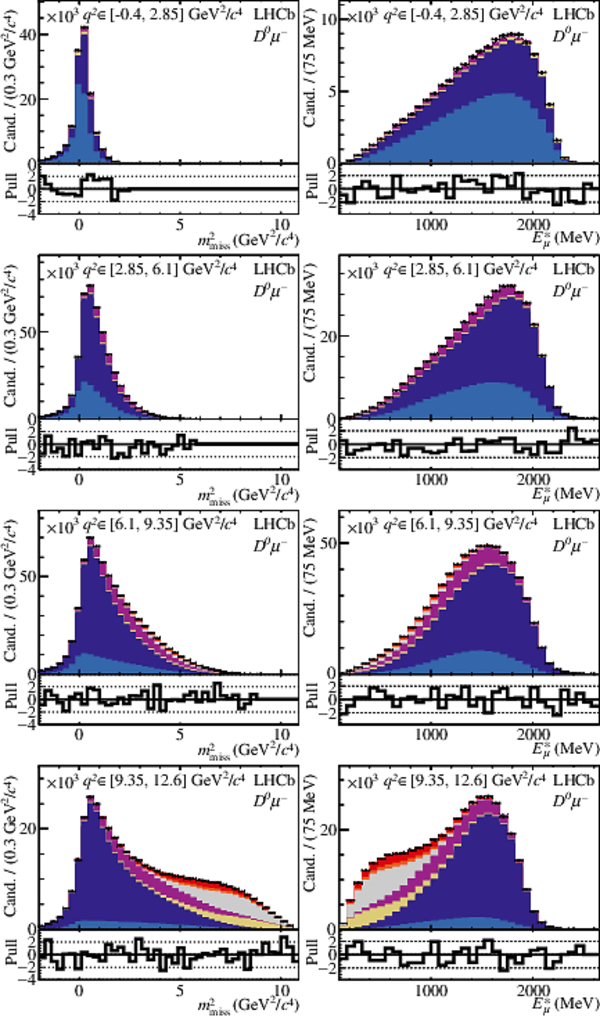
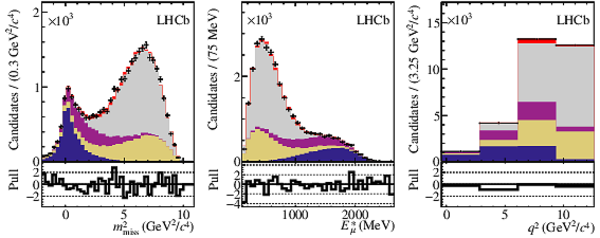
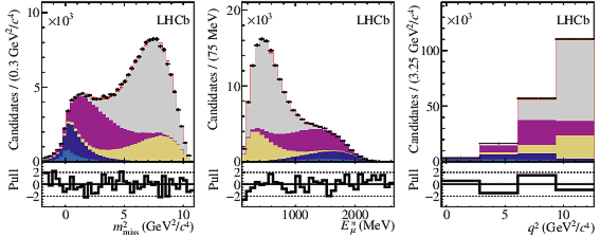
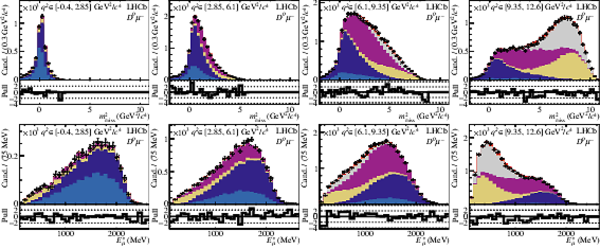
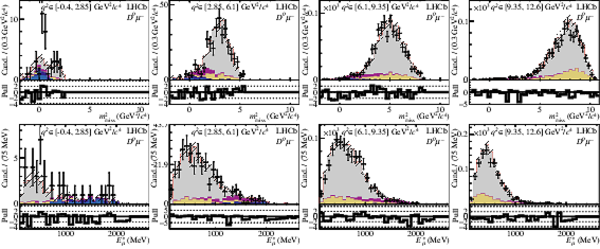
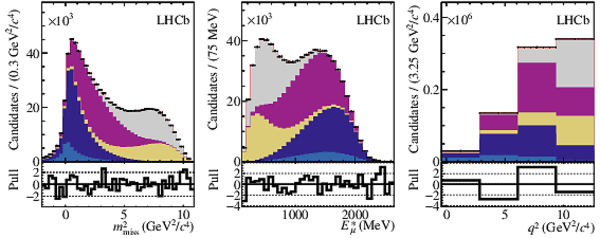
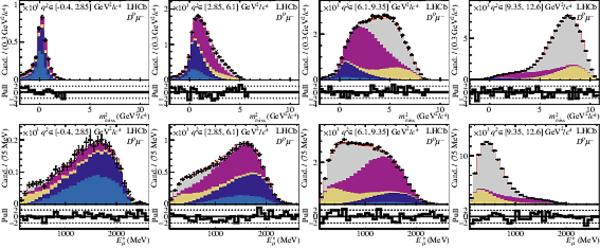
Distributions of (left) $m^2_{\rm miss}$ and (right) $ E^{*}_{\mu}$ in each $ q^{2}$ bin of the $ D ^0$ $\mu ^-$ signal data, overlaid with projections of the fit model. Below each panel differences between the data and fit are shown, normalized by the summed statistical uncertainty of the data and simulation samples. |
FigA2a.pdf [95 KiB] HiDef png [893 KiB] Thumbnail [954 KiB] *.C file |
|
|
FigA2b.pdf [13 KiB] HiDef png [223 KiB] Thumbnail [239 KiB] *.C file |
|
|
|
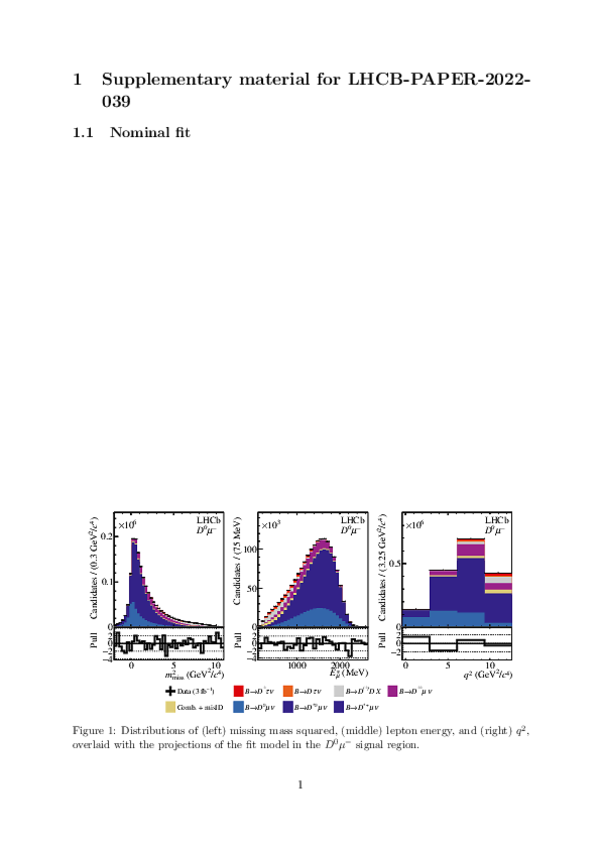
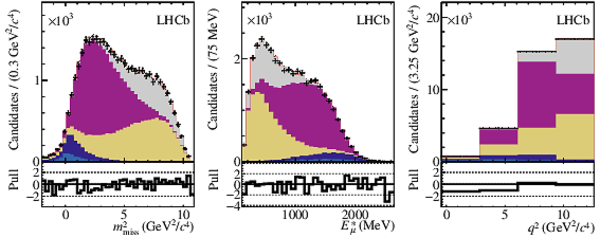
Projections of the fit in (left) missing mass squared, (center) lepton energy, and (right) $ q^{2}$ in the (top) $ D ^* \mu ^- $ and (bottom) $ D ^0 \mu ^- $ region with exactly one extra pion consistent with the $ B $ vertex. |
FigB3a.pdf [46 KiB] HiDef png [221 KiB] Thumbnail [160 KiB] *.C file |
|
|
FigB3b.pdf [13 KiB] HiDef png [49 KiB] Thumbnail [43 KiB] *.C file |

|
|
|
FigB3c.pdf [31 KiB] HiDef png [229 KiB] Thumbnail [175 KiB] *.C file |

|
|
|
FigB3b.pdf [13 KiB] HiDef png [49 KiB] Thumbnail [43 KiB] *.C file |
|
|
|
Projections of the fit in (left) missing mass squared, (center) lepton energy, and (right) $ q^{2}$ in the (top) $ D ^* \mu ^- $ and (bottom) $ D ^0 \mu ^- $ region with exactly two extra opposite-sign pions consistent with the $ B $ vertex. |
FigB4a.pdf [46 KiB] HiDef png [236 KiB] Thumbnail [186 KiB] *.C file |

|
|
FigB4b.pdf [13 KiB] HiDef png [49 KiB] Thumbnail [43 KiB] *.C file |

|
|
|
FigB4c.pdf [31 KiB] HiDef png [229 KiB] Thumbnail [176 KiB] *.C file |

|
|
|
FigB4b.pdf [13 KiB] HiDef png [49 KiB] Thumbnail [43 KiB] *.C file |
|
|
|
Projections of the fit in (left) missing mass squared, (center) lepton energy, and (right) $ q^{2}$ in the (top) $ D ^* \mu ^- $ and (bottom) $ D ^0 \mu ^- $ region with at least one kaon of either sign and no restrictions on the number of additional tracks consistent with the $ B $ vertex. |
FigB5a.pdf [47 KiB] HiDef png [229 KiB] Thumbnail [186 KiB] *.C file |
|
|
FigB5b.pdf [13 KiB] HiDef png [49 KiB] Thumbnail [43 KiB] *.C file |

|
|
|
FigB5c.pdf [49 KiB] HiDef png [224 KiB] Thumbnail [176 KiB] *.C file |
|
|
|
FigB5b.pdf [13 KiB] HiDef png [49 KiB] Thumbnail [43 KiB] *.C file |
|
|
|
Animated gif made out of all figures. |
PAPER-2022-039.gif Thumbnail |

|
Tables and captions
|
Summary of calculations of $\mathcal{R}(D)$ and $\mathcal{R}( D ^* )$ as compiled by the HFLAV collaboration [10]. For consistency with HFLAV this Letter uses the same average value $\mathcal{R}(D) = 0.298\pm 0.004$, $\mathcal{R}( D ^* ) =0.254\pm 0.005$ when making comparisons with the Standard Model. |
Table_1.pdf [63 KiB] HiDef png [144 KiB] Thumbnail [66 KiB] tex code |

|
|
Absolute uncertainties in the extraction of $\mathcal{R}( D ^0 )$ and $\mathcal{R}( D ^* )$ . The model uncertainties are divided into those included directly in the fit likelihood and those determined via supplemental studies. |
Table_2.pdf [100 KiB] HiDef png [150 KiB] Thumbnail [66 KiB] tex code |

|
Supplementary Material [file]


![HiDef png [351 KiB]](Directory_LHCb-PAPER-2022-039/hidef_Fig1a.png)
![HiDef png [223 KiB]](Directory_LHCb-PAPER-2022-039/hidef_Fig1b.png)
![HiDef png [871 KiB]](Directory_LHCb-PAPER-2022-039/hidef_FigA1a.png)
![HiDef png [223 KiB]](Directory_LHCb-PAPER-2022-039/hidef_FigA1b.png)
![HiDef png [893 KiB]](Directory_LHCb-PAPER-2022-039/hidef_FigA2a.png)
![HiDef png [223 KiB]](Directory_LHCb-PAPER-2022-039/hidef_FigA2b.png)
![HiDef png [221 KiB]](Directory_LHCb-PAPER-2022-039/hidef_FigB3a.png)
![HiDef png [49 KiB]](Directory_LHCb-PAPER-2022-039/hidef_FigB3b.png)
![HiDef png [229 KiB]](Directory_LHCb-PAPER-2022-039/hidef_FigB3c.png)
![HiDef png [236 KiB]](Directory_LHCb-PAPER-2022-039/hidef_FigB4a.png)
![HiDef png [49 KiB]](Directory_LHCb-PAPER-2022-039/hidef_FigB4b.png)
![HiDef png [229 KiB]](Directory_LHCb-PAPER-2022-039/hidef_FigB4c.png)
![HiDef png [229 KiB]](Directory_LHCb-PAPER-2022-039/hidef_FigB5a.png)
![HiDef png [49 KiB]](Directory_LHCb-PAPER-2022-039/hidef_FigB5b.png)
![HiDef png [224 KiB]](Directory_LHCb-PAPER-2022-039/hidef_FigB5c.png)
![HiDef png [144 KiB]](Directory_LHCb-PAPER-2022-039/hidef_Table_1.png)
![HiDef png [150 KiB]](Directory_LHCb-PAPER-2022-039/hidef_Table_2.png)
![HiDef png [471 KiB]](Directory_LHCb-PAPER-2022-039/supplementary/hidef_Fig10a.png)
![HiDef png [49 KiB]](Directory_LHCb-PAPER-2022-039/supplementary/hidef_Fig10b.png)
![HiDef png [232 KiB]](Directory_LHCb-PAPER-2022-039/supplementary/hidef_Fig11a.png)
![HiDef png [49 KiB]](Directory_LHCb-PAPER-2022-039/supplementary/hidef_Fig11b.png)
![HiDef png [443 KiB]](Directory_LHCb-PAPER-2022-039/supplementary/hidef_Fig12a.png)
![HiDef png [49 KiB]](Directory_LHCb-PAPER-2022-039/supplementary/hidef_Fig12b.png)
![HiDef png [212 KiB]](Directory_LHCb-PAPER-2022-039/supplementary/hidef_Fig13a.png)
![HiDef png [56 KiB]](Directory_LHCb-PAPER-2022-039/supplementary/hidef_Fig13b.png)
![HiDef png [440 KiB]](Directory_LHCb-PAPER-2022-039/supplementary/hidef_Fig14a.png)
![HiDef png [56 KiB]](Directory_LHCb-PAPER-2022-039/supplementary/hidef_Fig14b.png)
![HiDef png [251 KiB]](Directory_LHCb-PAPER-2022-039/supplementary/hidef_Fig15a.png)
![HiDef png [55 KiB]](Directory_LHCb-PAPER-2022-039/supplementary/hidef_Fig15b.png)
![HiDef png [494 KiB]](Directory_LHCb-PAPER-2022-039/supplementary/hidef_Fig16a.png)
![HiDef png [55 KiB]](Directory_LHCb-PAPER-2022-039/supplementary/hidef_Fig16b.png)
![HiDef png [218 KiB]](Directory_LHCb-PAPER-2022-039/supplementary/hidef_Fig17a.png)
![HiDef png [55 KiB]](Directory_LHCb-PAPER-2022-039/supplementary/hidef_Fig17b.png)
![HiDef png [462 KiB]](Directory_LHCb-PAPER-2022-039/supplementary/hidef_Fig18a.png)
![HiDef png [55 KiB]](Directory_LHCb-PAPER-2022-039/supplementary/hidef_Fig18b.png)
![HiDef png [238 KiB]](Directory_LHCb-PAPER-2022-039/supplementary/hidef_Fig19a.png)
![HiDef png [55 KiB]](Directory_LHCb-PAPER-2022-039/supplementary/hidef_Fig19b.png)
![HiDef png [240 KiB]](Directory_LHCb-PAPER-2022-039/supplementary/hidef_Fig1a.png)
![HiDef png [49 KiB]](Directory_LHCb-PAPER-2022-039/supplementary/hidef_Fig1b.png)
![HiDef png [496 KiB]](Directory_LHCb-PAPER-2022-039/supplementary/hidef_Fig20a.png)
![HiDef png [55 KiB]](Directory_LHCb-PAPER-2022-039/supplementary/hidef_Fig20b.png)
![HiDef png [241 KiB]](Directory_LHCb-PAPER-2022-039/supplementary/hidef_Fig21a.png)
![HiDef png [55 KiB]](Directory_LHCb-PAPER-2022-039/supplementary/hidef_Fig21b.png)
![HiDef png [441 KiB]](Directory_LHCb-PAPER-2022-039/supplementary/hidef_Fig22a.png)
![HiDef png [55 KiB]](Directory_LHCb-PAPER-2022-039/supplementary/hidef_Fig22b.png)
![HiDef png [251 KiB]](Directory_LHCb-PAPER-2022-039/supplementary/hidef_Fig23a.png)
![HiDef png [55 KiB]](Directory_LHCb-PAPER-2022-039/supplementary/hidef_Fig23b.png)
![HiDef png [515 KiB]](Directory_LHCb-PAPER-2022-039/supplementary/hidef_Fig24a.png)
![HiDef png [55 KiB]](Directory_LHCb-PAPER-2022-039/supplementary/hidef_Fig24b.png)
![HiDef png [237 KiB]](Directory_LHCb-PAPER-2022-039/supplementary/hidef_Fig25a.png)
![HiDef png [55 KiB]](Directory_LHCb-PAPER-2022-039/supplementary/hidef_Fig25b.png)
![HiDef png [497 KiB]](Directory_LHCb-PAPER-2022-039/supplementary/hidef_Fig26a.png)
![HiDef png [55 KiB]](Directory_LHCb-PAPER-2022-039/supplementary/hidef_Fig26b.png)
![HiDef png [220 KiB]](Directory_LHCb-PAPER-2022-039/supplementary/hidef_Fig27a.png)
![HiDef png [55 KiB]](Directory_LHCb-PAPER-2022-039/supplementary/hidef_Fig27b.png)
![HiDef png [462 KiB]](Directory_LHCb-PAPER-2022-039/supplementary/hidef_Fig28a.png)
![HiDef png [55 KiB]](Directory_LHCb-PAPER-2022-039/supplementary/hidef_Fig28b.png)
![HiDef png [239 KiB]](Directory_LHCb-PAPER-2022-039/supplementary/hidef_Fig29a.png)
![HiDef png [55 KiB]](Directory_LHCb-PAPER-2022-039/supplementary/hidef_Fig29b.png)
![HiDef png [212 KiB]](Directory_LHCb-PAPER-2022-039/supplementary/hidef_Fig2a.png)
![HiDef png [49 KiB]](Directory_LHCb-PAPER-2022-039/supplementary/hidef_Fig2b.png)
![HiDef png [450 KiB]](Directory_LHCb-PAPER-2022-039/supplementary/hidef_Fig30a.png)
![HiDef png [55 KiB]](Directory_LHCb-PAPER-2022-039/supplementary/hidef_Fig30b.png)
![HiDef png [240 KiB]](Directory_LHCb-PAPER-2022-039/supplementary/hidef_Fig31a.png)
![HiDef png [278 KiB]](Directory_LHCb-PAPER-2022-039/supplementary/hidef_Fig31b.png)
![HiDef png [234 KiB]](Directory_LHCb-PAPER-2022-039/supplementary/hidef_Fig31c.png)
![HiDef png [254 KiB]](Directory_LHCb-PAPER-2022-039/supplementary/hidef_Fig31d.png)
![HiDef png [240 KiB]](Directory_LHCb-PAPER-2022-039/supplementary/hidef_Fig31e.png)
![HiDef png [274 KiB]](Directory_LHCb-PAPER-2022-039/supplementary/hidef_Fig31f.png)
![HiDef png [257 KiB]](Directory_LHCb-PAPER-2022-039/supplementary/hidef_Fig32a.png)
![HiDef png [240 KiB]](Directory_LHCb-PAPER-2022-039/supplementary/hidef_Fig32b.png)
![HiDef png [254 KiB]](Directory_LHCb-PAPER-2022-039/supplementary/hidef_Fig32c.png)
![HiDef png [221 KiB]](Directory_LHCb-PAPER-2022-039/supplementary/hidef_Fig32d.png)
![HiDef png [259 KiB]](Directory_LHCb-PAPER-2022-039/supplementary/hidef_Fig33a.png)
![HiDef png [271 KiB]](Directory_LHCb-PAPER-2022-039/supplementary/hidef_Fig33b.png)
![HiDef png [247 KiB]](Directory_LHCb-PAPER-2022-039/supplementary/hidef_Fig33c.png)
![HiDef png [218 KiB]](Directory_LHCb-PAPER-2022-039/supplementary/hidef_Fig33d.png)
![HiDef png [249 KiB]](Directory_LHCb-PAPER-2022-039/supplementary/hidef_Fig34a.png)
![HiDef png [244 KiB]](Directory_LHCb-PAPER-2022-039/supplementary/hidef_Fig34b.png)
![HiDef png [242 KiB]](Directory_LHCb-PAPER-2022-039/supplementary/hidef_Fig34c.png)
![HiDef png [247 KiB]](Directory_LHCb-PAPER-2022-039/supplementary/hidef_Fig34d.png)
![HiDef png [256 KiB]](Directory_LHCb-PAPER-2022-039/supplementary/hidef_Fig35a.png)
![HiDef png [264 KiB]](Directory_LHCb-PAPER-2022-039/supplementary/hidef_Fig35b.png)
![HiDef png [273 KiB]](Directory_LHCb-PAPER-2022-039/supplementary/hidef_Fig35c.png)
![HiDef png [252 KiB]](Directory_LHCb-PAPER-2022-039/supplementary/hidef_Fig36a.png)
![HiDef png [297 KiB]](Directory_LHCb-PAPER-2022-039/supplementary/hidef_Fig36b.png)
![HiDef png [246 KiB]](Directory_LHCb-PAPER-2022-039/supplementary/hidef_Fig36c.png)
![HiDef png [273 KiB]](Directory_LHCb-PAPER-2022-039/supplementary/hidef_Fig36d.png)
![HiDef png [256 KiB]](Directory_LHCb-PAPER-2022-039/supplementary/hidef_Fig36e.png)
![HiDef png [298 KiB]](Directory_LHCb-PAPER-2022-039/supplementary/hidef_Fig36f.png)
![HiDef png [276 KiB]](Directory_LHCb-PAPER-2022-039/supplementary/hidef_Fig37a.png)
![HiDef png [244 KiB]](Directory_LHCb-PAPER-2022-039/supplementary/hidef_Fig37b.png)
![HiDef png [275 KiB]](Directory_LHCb-PAPER-2022-039/supplementary/hidef_Fig37c.png)
![HiDef png [226 KiB]](Directory_LHCb-PAPER-2022-039/supplementary/hidef_Fig37d.png)
![HiDef png [278 KiB]](Directory_LHCb-PAPER-2022-039/supplementary/hidef_Fig38a.png)
![HiDef png [290 KiB]](Directory_LHCb-PAPER-2022-039/supplementary/hidef_Fig38b.png)
![HiDef png [269 KiB]](Directory_LHCb-PAPER-2022-039/supplementary/hidef_Fig38c.png)
![HiDef png [257 KiB]](Directory_LHCb-PAPER-2022-039/supplementary/hidef_Fig38d.png)
![HiDef png [267 KiB]](Directory_LHCb-PAPER-2022-039/supplementary/hidef_Fig39a.png)
![HiDef png [265 KiB]](Directory_LHCb-PAPER-2022-039/supplementary/hidef_Fig39b.png)
![HiDef png [260 KiB]](Directory_LHCb-PAPER-2022-039/supplementary/hidef_Fig39c.png)
![HiDef png [263 KiB]](Directory_LHCb-PAPER-2022-039/supplementary/hidef_Fig39d.png)
![HiDef png [435 KiB]](Directory_LHCb-PAPER-2022-039/supplementary/hidef_Fig3a.png)
![HiDef png [49 KiB]](Directory_LHCb-PAPER-2022-039/supplementary/hidef_Fig3b.png)
![HiDef png [238 KiB]](Directory_LHCb-PAPER-2022-039/supplementary/hidef_Fig40a.png)
![HiDef png [277 KiB]](Directory_LHCb-PAPER-2022-039/supplementary/hidef_Fig40b.png)
![HiDef png [233 KiB]](Directory_LHCb-PAPER-2022-039/supplementary/hidef_Fig40c.png)
![HiDef png [251 KiB]](Directory_LHCb-PAPER-2022-039/supplementary/hidef_Fig40d.png)
![HiDef png [238 KiB]](Directory_LHCb-PAPER-2022-039/supplementary/hidef_Fig40e.png)
![HiDef png [274 KiB]](Directory_LHCb-PAPER-2022-039/supplementary/hidef_Fig40f.png)
![HiDef png [259 KiB]](Directory_LHCb-PAPER-2022-039/supplementary/hidef_Fig41a.png)
![HiDef png [240 KiB]](Directory_LHCb-PAPER-2022-039/supplementary/hidef_Fig41b.png)
![HiDef png [252 KiB]](Directory_LHCb-PAPER-2022-039/supplementary/hidef_Fig41c.png)
![HiDef png [218 KiB]](Directory_LHCb-PAPER-2022-039/supplementary/hidef_Fig41d.png)
![HiDef png [259 KiB]](Directory_LHCb-PAPER-2022-039/supplementary/hidef_Fig42a.png)
![HiDef png [270 KiB]](Directory_LHCb-PAPER-2022-039/supplementary/hidef_Fig42b.png)
![HiDef png [247 KiB]](Directory_LHCb-PAPER-2022-039/supplementary/hidef_Fig42c.png)
![HiDef png [216 KiB]](Directory_LHCb-PAPER-2022-039/supplementary/hidef_Fig42d.png)
![HiDef png [247 KiB]](Directory_LHCb-PAPER-2022-039/supplementary/hidef_Fig43a.png)
![HiDef png [243 KiB]](Directory_LHCb-PAPER-2022-039/supplementary/hidef_Fig43b.png)
![HiDef png [242 KiB]](Directory_LHCb-PAPER-2022-039/supplementary/hidef_Fig43c.png)
![HiDef png [246 KiB]](Directory_LHCb-PAPER-2022-039/supplementary/hidef_Fig43d.png)
![HiDef png [422 KiB]](Directory_LHCb-PAPER-2022-039/supplementary/hidef_Fig4a.png)
![HiDef png [49 KiB]](Directory_LHCb-PAPER-2022-039/supplementary/hidef_Fig4b.png)
![HiDef png [454 KiB]](Directory_LHCb-PAPER-2022-039/supplementary/hidef_Fig5a.png)
![HiDef png [49 KiB]](Directory_LHCb-PAPER-2022-039/supplementary/hidef_Fig5b.png)
![HiDef png [474 KiB]](Directory_LHCb-PAPER-2022-039/supplementary/hidef_Fig6a.png)
![HiDef png [49 KiB]](Directory_LHCb-PAPER-2022-039/supplementary/hidef_Fig6b.png)
![HiDef png [490 KiB]](Directory_LHCb-PAPER-2022-039/supplementary/hidef_Fig7a.png)
![HiDef png [49 KiB]](Directory_LHCb-PAPER-2022-039/supplementary/hidef_Fig7b.png)
![HiDef png [516 KiB]](Directory_LHCb-PAPER-2022-039/supplementary/hidef_Fig8a.png)
![HiDef png [49 KiB]](Directory_LHCb-PAPER-2022-039/supplementary/hidef_Fig8b.png)
![HiDef png [460 KiB]](Directory_LHCb-PAPER-2022-039/supplementary/hidef_Fig9a.png)
![HiDef png [49 KiB]](Directory_LHCb-PAPER-2022-039/supplementary/hidef_Fig9b.png)
Created on 27 April 2024.