Associated production of prompt $J/\psi$ and $\mathit{\Upsilon}$ mesons in $pp$ collisions at $\sqrt{s}=13 \mathrm{TeV}$
[to restricted-access page]Information
LHCb-PAPER-2022-047
CERN-EP-2023-078
arXiv:2305.15580 [PDF]
(Submitted on 24 May 2023)
JHEP
Inspire 2662581
Tools
Abstract
The associated production of prompt $J/\psi$ and $\mathit{\mathit{\Upsilon}}$ mesons in $pp$ collisions at a centre-of-mass energy of $\sqrt{s}=13 \mathrm{TeV}$ is studied using LHCb data, corresponding to an integrated luminosity of $4 \mathrm{fb}^{-1}$. The measurement is performed for $J/\psi$ ($\mathit{\Upsilon}$) mesons with a transverse momentum $p_{\mathrm{T}}<10 (30) \mathrm{GeV}/c$ in the rapidity range $2.0<y<4.5$. In this kinematic range, the cross-section of the associated production of prompt $J/\psi$ and $\mathit{\Upsilon}(1S)$ mesons is measured to be $133 \pm 22 \pm 7 \pm 3 \mathrm{pb}$, with a significance of $7.9 \sigma$, and that of prompt $J/\psi$ and $\mathit{\Upsilon}(2S)$ mesons to be $76\pm 21 \pm 4 \pm 7 \mathrm{pb}$, with a significance of $4.9 \sigma$. The first uncertainty is statistical, the second systematic, and the third due to uncertainties on the used branching fractions. This is the first observation of the associated production of $J/\psi$ and $\mathit{\Upsilon}(1S)$ in proton-proton collisions. Differential cross-sections are measured as functions of variables that are sensitive to kinematic correlations between the $J/\psi$ and $\mathit{\Upsilon}(1S)$ mesons. The effective cross-sections of the associated production of prompt $J/\psi$ and $\mathit{\Upsilon}$ mesons are obtained and found to be compatible with measurements using other particle productions.
Figures and captions
|
Representative Feynman diagrams of the (left) SPS and the (right) DPS process with colour-singlet LDMEs. |
Fig1a.pdf [20 KiB] HiDef png [105 KiB] Thumbnail [41 KiB] *.C file |

|
|
Fig1b.pdf [22 KiB] HiDef png [157 KiB] Thumbnail [59 KiB] *.C file |

|
|
|
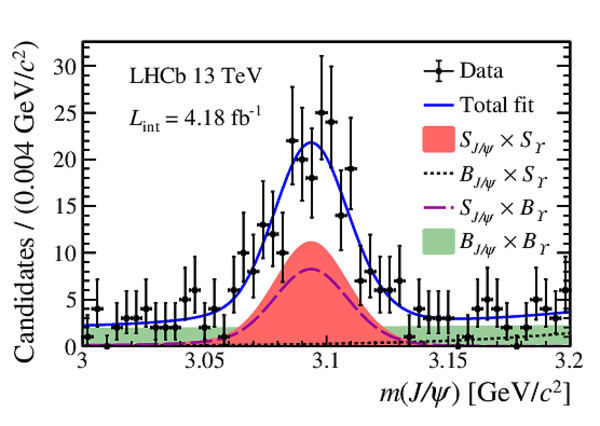
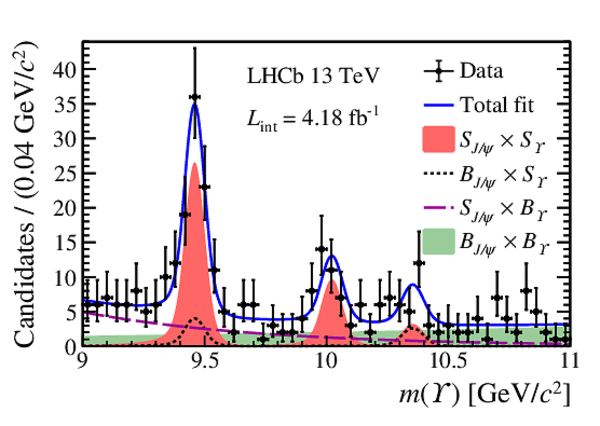
Two-dimensional invariant mass distribution of the $ { J \mskip -3mu/\mskip -2mu\psi } $--$\Upsilon$ candidates projected on (left) the $ { J \mskip -3mu/\mskip -2mu\psi }$ invariant mass $m( { J \mskip -3mu/\mskip -2mu\psi } )$ and (right) the $\Upsilon$ invariant mass $m(\Upsilon)$. The black points with error bars represent the data. The blue solid line represents the result of the fit to the data sample. The red shaded area represents the signal component. The black (dotted) and violet (dashed) lines represent the background where one dimuon candidate is a true meson decay and the other is combinatorial background. The green shaded area indicates the background where both the $ { J \mskip -3mu/\mskip -2mu\psi }$ and $\Upsilon$ candidates are combinatorial background. |
Fig2a.pdf [23 KiB] HiDef png [309 KiB] Thumbnail [249 KiB] *.C file |
|
|
Fig2b.pdf [25 KiB] HiDef png [326 KiB] Thumbnail [255 KiB] *.C file |
|
|
|
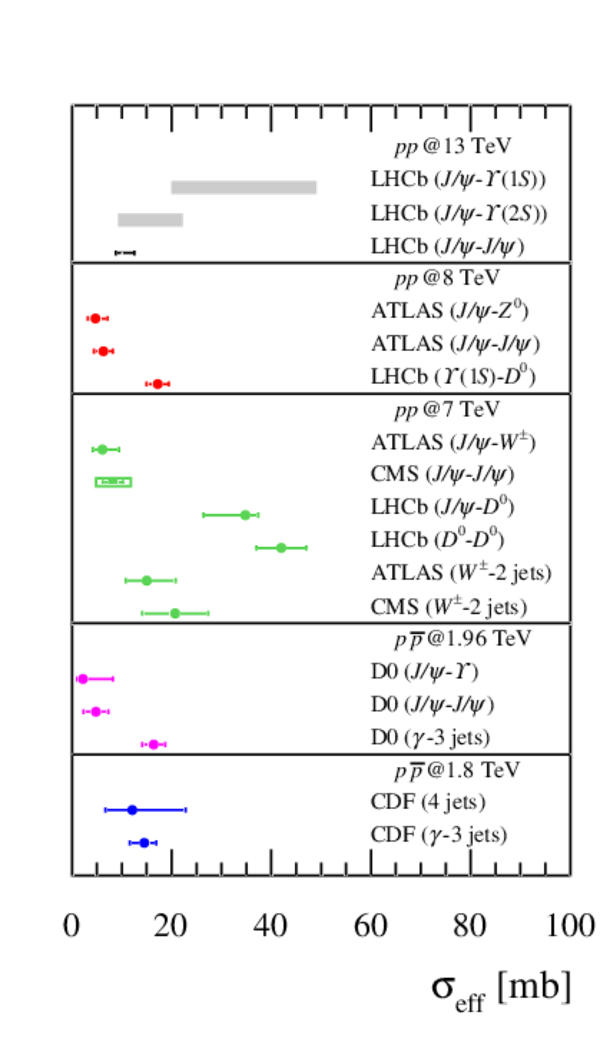
Effective cross-sections measured in different particle production by various experiments. For the LHCb measurements of $ { J \mskip -3mu/\mskip -2mu\psi } \text{--}\Upsilon (1S)$ and $ { J \mskip -3mu/\mskip -2mu\psi } \text{--}\Upsilon (2S)$ effective cross-sections, the error bars (grey boxes) represent the experimental (total) uncertainties. The result for $ { J \mskip -3mu/\mskip -2mu\psi } $--$ { J \mskip -3mu/\mskip -2mu\psi } $ production at LHCb is given as a range covering several model-dependent measurements [46]. Results from other analyses are reproduced from Refs. [1,38]. |
Fig3.pdf [15 KiB] HiDef png [452 KiB] Thumbnail [416 KiB] *.C file |
|
|
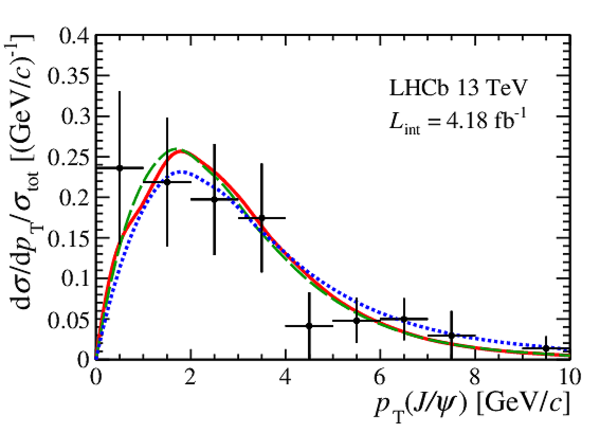
Distributions of (top left) invariant mass $m( { J \mskip -3mu/\mskip -2mu\psi } \text{--}\Upsilon (1S))$, (top right) transverse momentum $ p_{\mathrm{T}} ( { J \mskip -3mu/\mskip -2mu\psi } \text{--}\Upsilon (1S))$, (middle left) azimuthal angle difference $|\Delta \phi|$, (middle right) rapidity difference $|\Delta y|$ of $ { J \mskip -3mu/\mskip -2mu\psi } $--${\Y1S} $, and (bottom) $ p_{\mathrm{T}} $ of the $ { J \mskip -3mu/\mskip -2mu\psi }$ and {\Y1S} mesons for data and the pseudodata modelled from previous measurements [74,77]. Black points with error bars represent the data distributions with statistical uncertainties. Red solid lines represent distributions of the DPS pseudodata. Green dashed lines and blue dotted lines represent the DPS distribution together with the lower limit and the upper limit of the SPS distributions, respectively. |
Fig4a.pdf [15 KiB] HiDef png [258 KiB] Thumbnail [223 KiB] *.C file |

|
|
Fig4b.pdf [16 KiB] HiDef png [243 KiB] Thumbnail [203 KiB] *.C file |

|
|
|
Fig4c.pdf [18 KiB] HiDef png [145 KiB] Thumbnail [137 KiB] *.C file |

|
|
|
Fig4d.pdf [15 KiB] HiDef png [149 KiB] Thumbnail [128 KiB] *.C file |

|
|
|
Fig4e.pdf [16 KiB] HiDef png [218 KiB] Thumbnail [183 KiB] *.C file |
|
|
|
Fig4f.pdf [16 KiB] HiDef png [199 KiB] Thumbnail [167 KiB] *.C file |

|
|
|
Animated gif made out of all figures. |
PAPER-2022-047.gif Thumbnail |

|
![HiDef png [105 KiB]](Directory_LHCb-PAPER-2022-047/hidef_Fig1a.png)
![HiDef png [157 KiB]](Directory_LHCb-PAPER-2022-047/hidef_Fig1b.png)
![HiDef png [309 KiB]](Directory_LHCb-PAPER-2022-047/hidef_Fig2a.png)
![HiDef png [326 KiB]](Directory_LHCb-PAPER-2022-047/hidef_Fig2b.png)
![HiDef png [452 KiB]](Directory_LHCb-PAPER-2022-047/hidef_Fig3.png)
![HiDef png [258 KiB]](Directory_LHCb-PAPER-2022-047/hidef_Fig4a.png)
![HiDef png [243 KiB]](Directory_LHCb-PAPER-2022-047/hidef_Fig4b.png)
![HiDef png [145 KiB]](Directory_LHCb-PAPER-2022-047/hidef_Fig4c.png)
![HiDef png [149 KiB]](Directory_LHCb-PAPER-2022-047/hidef_Fig4d.png)
![HiDef png [218 KiB]](Directory_LHCb-PAPER-2022-047/hidef_Fig4e.png)
![HiDef png [199 KiB]](Directory_LHCb-PAPER-2022-047/hidef_Fig4f.png)
Tables and captions
|
Raw yields from the fit, the efficiency-corrected yields ($N_\mathrm{cor}$) and the signal significances. |
Table_1.pdf [54 KiB] HiDef png [45 KiB] Thumbnail [21 KiB] tex code |

|
|
Relative systematic uncertainties on the measurement of the $ { J \mskip -3mu/\mskip -2mu\psi } $--$\Upsilon(1S)$ and $ { J \mskip -3mu/\mskip -2mu\psi } $--${\Y2S} $ cross-sections. |
Table_2.pdf [87 KiB] HiDef png [80 KiB] Thumbnail [37 KiB] tex code |

|
![HiDef png [45 KiB]](Directory_LHCb-PAPER-2022-047/hidef_Table_1.png)
![HiDef png [80 KiB]](Directory_LHCb-PAPER-2022-047/hidef_Table_2.png)
Created on 26 April 2024.