Study of the Bose-Einstein correlations of same-sign pions in proton-lead collisions
[to restricted-access page]Information
LHCb-PAPER-2023-002
CERN-EP-2023-096
arXiv:2306.09755 [PDF]
(Submitted on 16 Jun 2023)
JHEP 09 (2023) 172
Inspire 2669595
Tools
Abstract
Correlations of same-sign charged particles are analysed using proton-lead collision data collected by the LHCb experiment at a nucleon-nucleon centre-of-mass energy of 5.02 TeV, corresponding to an integrated luminosity of 1.06 nb-1. Bose-Einstein correlations are observed in the form of an enhancement of pair production for same-sign charged pions with a small four-momentum difference squared. The dependence of the correlation radius and the intercept parameter on the reconstructed charged-particle multiplicity is investigated. The measured correlation radii scale linearly with the cube root of the reconstructed charged-particle multiplicity, being compatible with predictions of hydrodynamic models on the collision system evolution.
Figures and captions
|
Example of the OS correlation functions in individual $ N_{\text{VELO }}$ bins together with the global fit using Eq. 9 to parametrize the cluster contribution. The results are shown for (left) a moderate-multiplicity region ( $ 35 \leqslant N_{\text{VELO }} < 40 $ ) of the $ p $ {}Pb and (right) a high-multiplicity regime ( $ 100 \leqslant N_{\text{VELO }} < 115 $ ) of the Pb $ p $ dataset. Only statistical uncertainties are shown. |
Fig1a.pdf [87 KiB] HiDef png [285 KiB] Thumbnail [188 KiB] *.C file |

|
|
Fig1b.pdf [93 KiB] HiDef png [287 KiB] Thumbnail [186 KiB] *.C file |

|
|
|
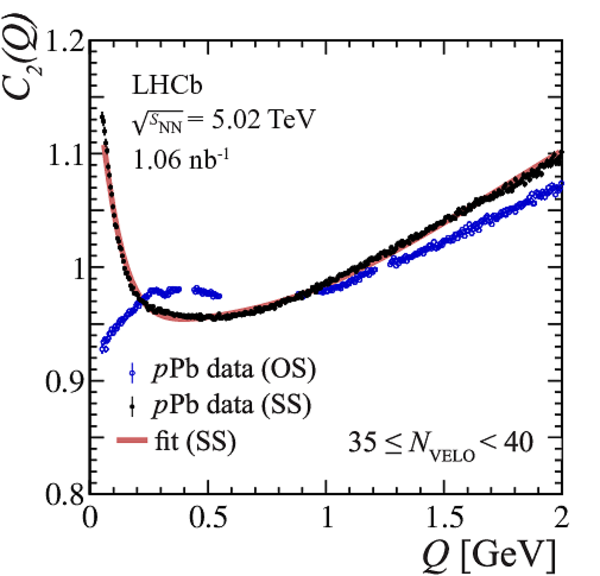
Example of fits to the SS correlation functions in (left) a moderate-multiplicity region ( $ 35 \leqslant N_{\text{VELO }} < 40 $ ) of the $ p $ {}Pb and (right) high-multiplicity regime ( $ 100 \leqslant N_{\text{VELO }} < 115 $ ) of the Pb $ p $ dataset. The black points correspond to the SS correlation functions , while the blue ones illustrate the OS correlation functions which are used to estimate the cluster contribution in the given $ N_{\text{VELO }}$ bin. The results of fits using Eq. 7 are indicated by red solid lines. Only statistical uncertainties are shown. |
Fig2a.pdf [107 KiB] HiDef png [427 KiB] Thumbnail [242 KiB] *.C file |
|
|
Fig2b.pdf [74 KiB] HiDef png [407 KiB] Thumbnail [239 KiB] *.C file |

|
|
|
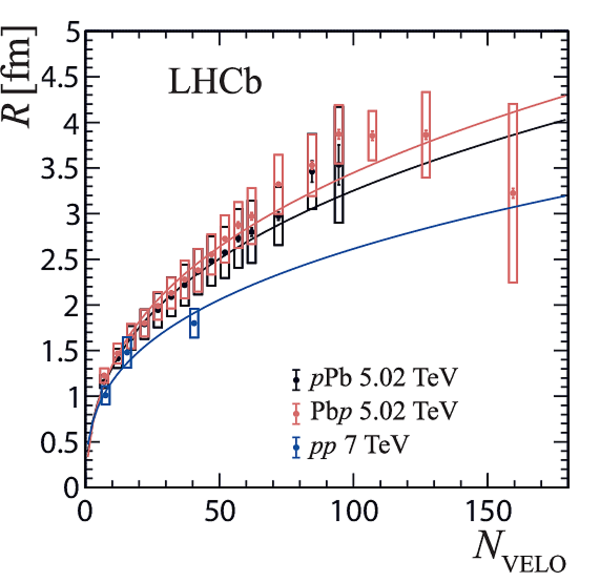
Correlation radius as a function of the reconstructed charged-particle multiplicity measured in the $ p $ $ p $ [52], $ p $ {}Pb and Pb $ p $ collision systems in the LHCb experiment. Error bars indicate the statistical uncertainties, while boxes illustrate the systematic ones. Data points are positioned at the centres of the multiplicity bins. Results of the fits to the observed radii scale linearly in the cube root of the reconstructed multiplicity (solid lines). |
Fig3.pdf [63 KiB] HiDef png [506 KiB] Thumbnail [248 KiB] *.C file |
|
|
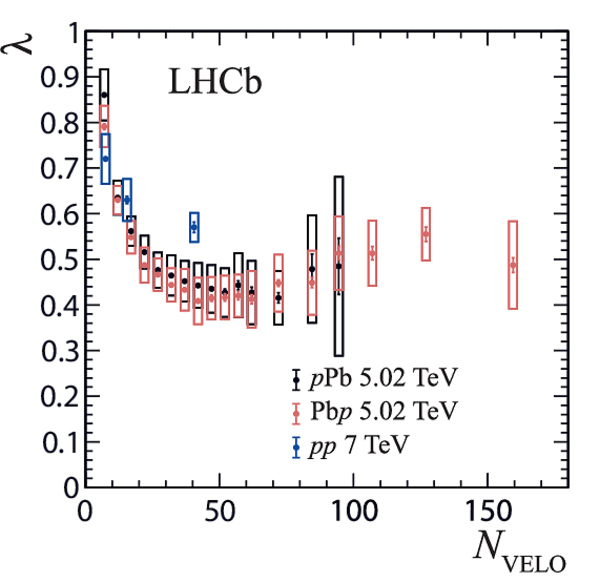
Intercept parameter as a function of the reconstructed charged-particle multiplicity measured in the $ p $ $ p $ [52], $ p $ {}Pb and Pb $ p $ collision systems in the LHCb experiment. Error bars indicate the statistical uncertainties, while boxes illustrate the systematic ones. Data points are positioned at the centres of the multiplicity bins. |
Fig4.pdf [55 KiB] HiDef png [357 KiB] Thumbnail [211 KiB] *.C file |
|
|
Distribution of the selected signal pairs originating from primary vertices with the given VELO -track multiplicity in the $ p $ {}Pb (black dots) and Pb $ p $ (red circles) data. |
Fig5.pdf [66 KiB] HiDef png [325 KiB] Thumbnail [217 KiB] *.C file |

|
|
Animated gif made out of all figures. |
PAPER-2023-002.gif Thumbnail |

|
![HiDef png [285 KiB]](Directory_LHCb-PAPER-2023-002/hidef_Fig1a.png)
![HiDef png [287 KiB]](Directory_LHCb-PAPER-2023-002/hidef_Fig1b.png)
![HiDef png [427 KiB]](Directory_LHCb-PAPER-2023-002/hidef_Fig2a.png)
![HiDef png [407 KiB]](Directory_LHCb-PAPER-2023-002/hidef_Fig2b.png)
![HiDef png [506 KiB]](Directory_LHCb-PAPER-2023-002/hidef_Fig3.png)
![HiDef png [357 KiB]](Directory_LHCb-PAPER-2023-002/hidef_Fig4.png)
![HiDef png [325 KiB]](Directory_LHCb-PAPER-2023-002/hidef_Fig5.png)
Tables and captions
|
Ranges of the VELO -track multiplicity bins in the $ p $ {}Pb and Pb $ p $ datasets. An approximate fraction of the relevant data sample corresponding to the given bin is also indicated. |
Table_1.pdf [47 KiB] HiDef png [116 KiB] Thumbnail [65 KiB] tex code |

|
|
Results of the global fits to the OS correlation functions using Eq. 9 to parametrize the cluster contribution in the $ p $ {}Pb and Pb $ p $ data. |
Table_2.pdf [65 KiB] HiDef png [28 KiB] Thumbnail [12 KiB] tex code |

|
|
Systematic uncertainties on the $ R$ and $\lambda$ parameters. The listed ranges correspond to the lowest and highest values of the given input determined across most of the $ N_{\text{VELO }}$ bins in the $ p $ {}Pb and Pb $ p $ samples (see the description in text for details). Negligible contributions are not listed. The total uncertainty is a quadratic sum of the individual inputs. |
Table_3.pdf [52 KiB] HiDef png [98 KiB] Thumbnail [40 KiB] tex code |

|
|
Fractions of fake tracks in the selected pion sample and in the signal pairs (with $ Q$ values restricted to the $ Q < 1.0 \text{ Ge V} $ region) containing a fake track in the $ p $ {}Pb and Pb $ p $ datasets. The values are determined using the simulation. |
Table_4.pdf [40 KiB] HiDef png [31 KiB] Thumbnail [14 KiB] tex code |

|
|
Correlation parameters determined from fits to the SS correlation functions using Eq. 7 in the $ N_{\text{VELO }}$ bins for the $ p $ {}Pb and Pb $ p $ datasets. The first and second uncertainties are statistical and systematic, respectively. |
Table_5.pdf [51 KiB] HiDef png [170 KiB] Thumbnail [76 KiB] tex code |

|
![HiDef png [116 KiB]](Directory_LHCb-PAPER-2023-002/hidef_Table_1.png)
![HiDef png [28 KiB]](Directory_LHCb-PAPER-2023-002/hidef_Table_2.png)
![HiDef png [98 KiB]](Directory_LHCb-PAPER-2023-002/hidef_Table_3.png)
![HiDef png [31 KiB]](Directory_LHCb-PAPER-2023-002/hidef_Table_4.png)
![HiDef png [170 KiB]](Directory_LHCb-PAPER-2023-002/hidef_Table_5.png)
Created on 27 April 2024.