Measurement of the $Z$ boson production cross-section in $pp$ collisions at $\sqrt{s} = 5.02$ TeV
[to restricted-access page]Information
LHCb-PAPER-2023-010
CERN-EP-2023-141
arXiv:2308.12940 [PDF]
(Submitted on 24 Aug 2023)
JHEP 02 (2024) 070
Inspire 2690798
Tools
Abstract
The first measurement of the $Z$ boson production cross-section at centre-of-mass energy $\sqrt{s} = 5.02 $TeV in the forward region is reported, using $pp$ collision data collected by the LHCb experiment in year 2017, corresponding to an integrated luminosity of $100 \pm 2 \rm{pb^{-1}}$. The production cross-section is measured for final-state muons in the pseudorapidity range $2.0<\eta<4.5$ with transverse momentum $p_{\rm{T}}> 20 \rm{GeV/}\it{c}$. The integrated cross-section is determined to be \[ \sigma_{Z \rightarrow \mu^{+}\mu^{-}} = 39.6 \pm 0.7 (\rm{stat}) \pm 0.6 (\rm{syst}) \pm 0.8 (\rm{lumi}) \rm{pb} \] for the di-muon invariant mass in the range $60<M_{\mu\mu}<120 \rm{GeV/}\it{c^{2}}$. This result and the differential cross-section results are in good agreement with theoretical predictions at next-to-next-to-leading order in the strong coupling. Based on a previous LHCb measurement of the $Z$ boson production cross-section in $p$Pb collisions at $\sqrt{s_{NN}}=5.02$ TeV, the nuclear modification factor $R_{p\rm{Pb}}$ is measured for the first time at this energy. The measured values are $1.2^{+0.5}_{-0.3} (\rm{stat}) \pm 0.1 (\rm{syst})$ in the forward region ($1.53<y^*_{\mu}<4.03$) and $3.6^{+1.6}_{-0.9} (\rm{stat}) \pm 0.2 (\rm{syst})$ in the backward region ($-4.97<y^*_{\mu}<-2.47$), where $y^*_{\mu}$ represents the muon rapidity in the centre-of-mass frame.
Figures and captions
|
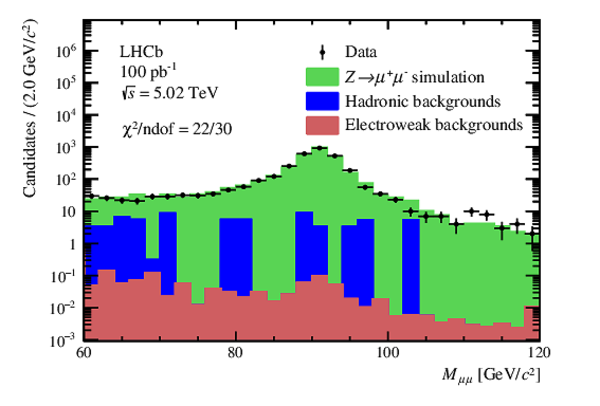
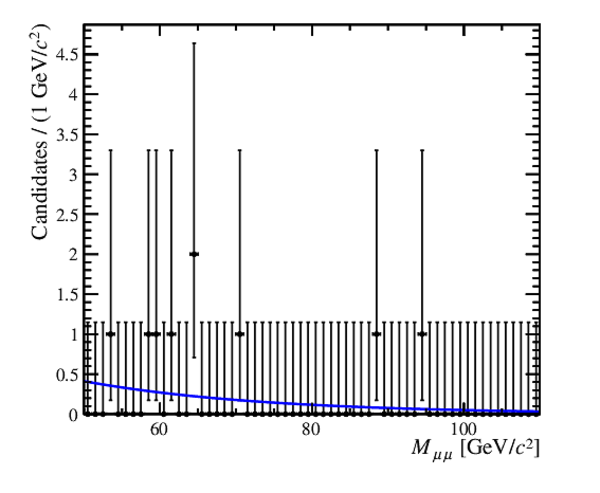
Mass distribution of the $ Z \rightarrow \mu ^+\mu ^- $ signal candidates. The data are overlaid with model of the signal and background models. The signal component is scaled such that the sum of the signal and background matches the integral of the data. |
Fig1.pdf [18 KiB] HiDef png [190 KiB] Thumbnail [174 KiB] *.C file |
|
|
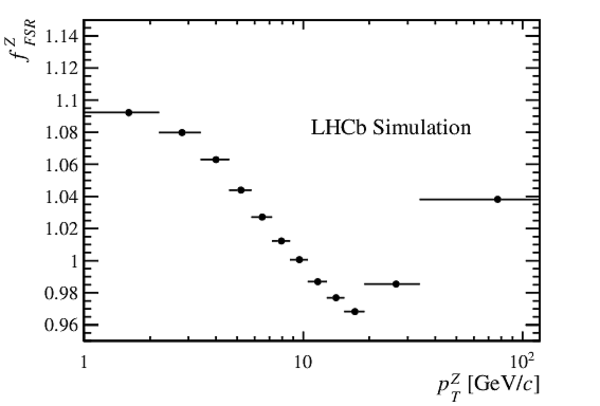
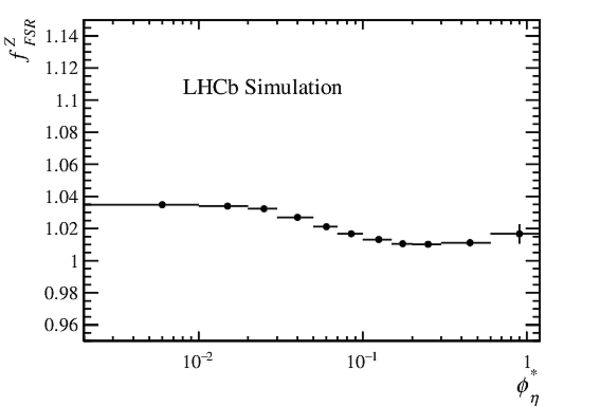
Final state radiation correction estimated for the (top-left) $ y^{{Z}}$ , (top-right) $ p_{\mathrm{T}}^{Z}$ , and (bottom) $\phi_{\eta}^{*}$ differential cross-section measurements. The error bars represent the total (statistical and systematic) uncertainties. |
Fig2a.pdf [14 KiB] HiDef png [63 KiB] Thumbnail [37 KiB] *.C file |

|
|
Fig2b.pdf [14 KiB] HiDef png [65 KiB] Thumbnail [39 KiB] *.C file |
|
|
|
Fig2c.pdf [14 KiB] HiDef png [63 KiB] Thumbnail [38 KiB] *.C file |
|
|
|
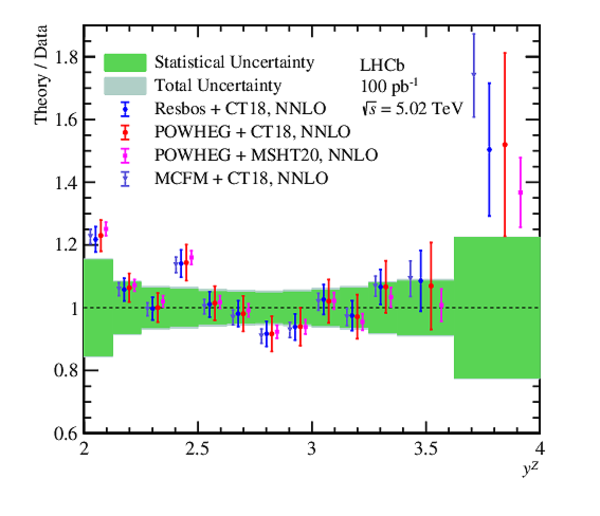
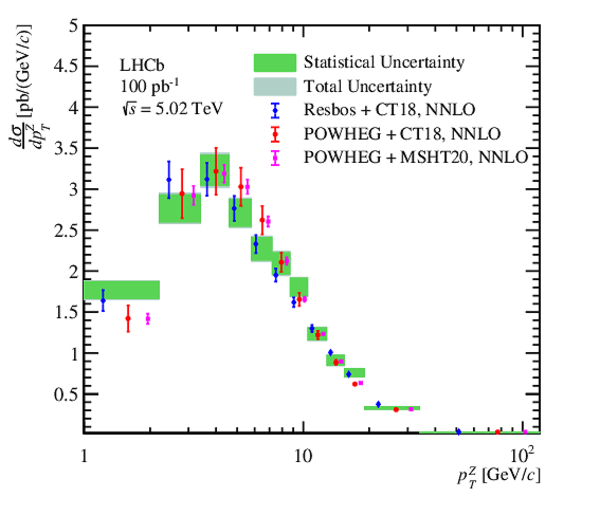
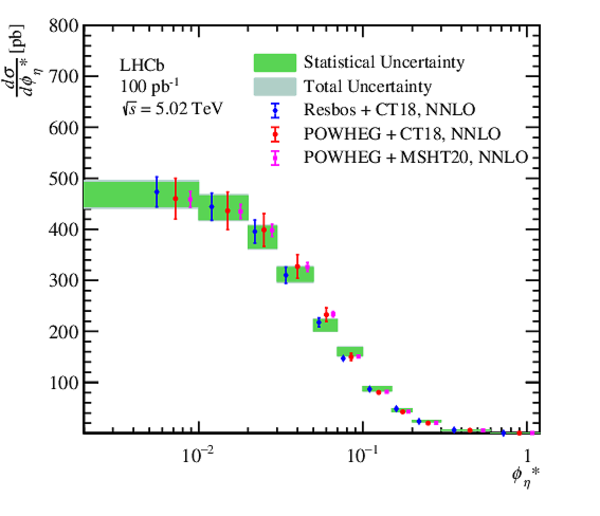
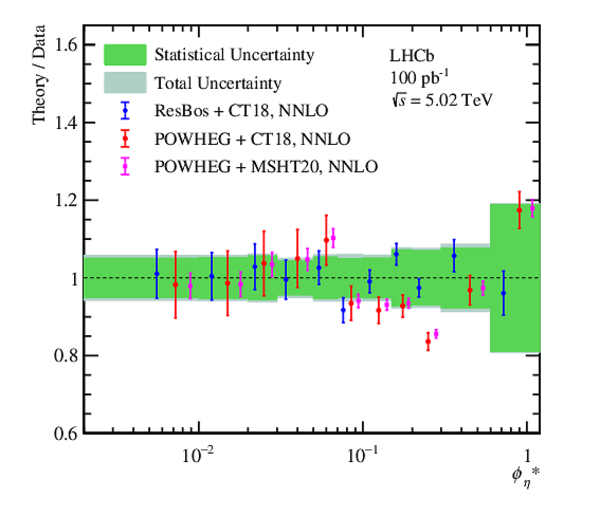
(Left) Measured single differential cross-section as a function of $ y^{{Z}}$ , $ p_{\mathrm{T}}^{Z}$ and $\phi_{\eta}^{*}$ compared with different theoretical predictions. (Right) Ratio of theoretical predictions to measured values, with the horizontal bars showing the uncertainty from the PDFs. The green band, centered at unity, shows the uncertainty of the measurement. |
Fig3a.pdf [18 KiB] HiDef png [217 KiB] Thumbnail [186 KiB] *.C file |

|
|
Fig3b.pdf [18 KiB] HiDef png [241 KiB] Thumbnail [200 KiB] *.C file |
|
|
|
Fig3c.pdf [17 KiB] HiDef png [194 KiB] Thumbnail [181 KiB] *.C file |
|
|
|
Fig3d.pdf [17 KiB] HiDef png [207 KiB] Thumbnail [180 KiB] *.C file |

|
|
|
Fig3e.pdf [16 KiB] HiDef png [192 KiB] Thumbnail [174 KiB] *.C file |
|
|
|
Fig3f.pdf [17 KiB] HiDef png [208 KiB] Thumbnail [181 KiB] *.C file |
|
|
|
Comparison of the integrated cross-section, $\sigma_{ Z \rightarrow \mu ^+\mu ^- }$, between data and theoretical predictions. The bands correspond to the data, with the inner band corresponding to the statistical uncertainty and the outer bands corresponding to the systematic uncertainty and total uncertainty. |
Fig4.pdf [14 KiB] HiDef png [216 KiB] Thumbnail [188 KiB] *.C file |

|
|
Measured $\sigma_{ Z \rightarrow \mu ^+\mu ^- }$ for $pp$ collisions, as a function of $\sqrt{s}$. The uncertainty on the data is smaller than the marker size. The data are overlaid with a curve showing the theoretical prediction. |
Fig5.pdf [14 KiB] HiDef png [84 KiB] Thumbnail [66 KiB] *.C file |

|
|
Invariant mass distributions of heavy-flavour samples with (left) PV fit quality $\chi^2 > 95$ and (right) $I_{\mu}< 91\%$ applied to both muons. Only statistical uncertainties are shown. |
Fig6a.pdf [17 KiB] HiDef png [154 KiB] Thumbnail [134 KiB] *.C file |

|
|
Fig6b.pdf [17 KiB] HiDef png [150 KiB] Thumbnail [130 KiB] *.C file |
|
|
|
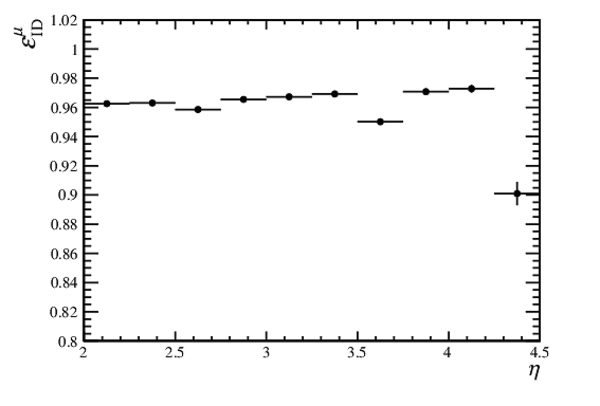
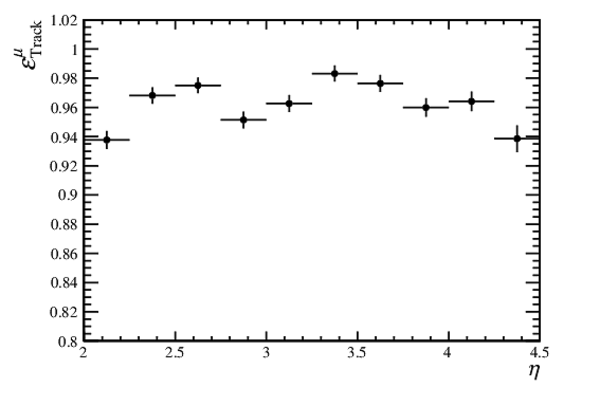
Muon tracking, identification and trigger efficiency as a function of pseudorapidity, estimated from the data and simulation at 5.02 $\text{ Te V}$ and 13 $\text{ Te V}$ . |
Fig7a.pdf [14 KiB] HiDef png [57 KiB] Thumbnail [34 KiB] *.C file |
|
|
Fig7b.pdf [14 KiB] HiDef png [60 KiB] Thumbnail [36 KiB] *.C file |
|
|
|
Fig7c.pdf [14 KiB] HiDef png [58 KiB] Thumbnail [35 KiB] *.C file |

|
|
|
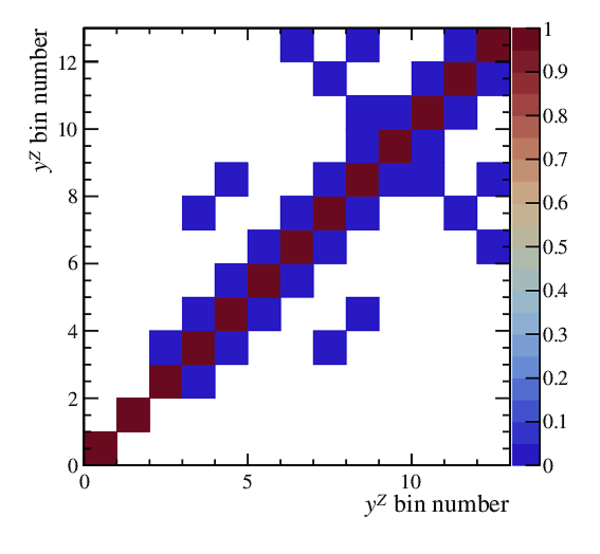
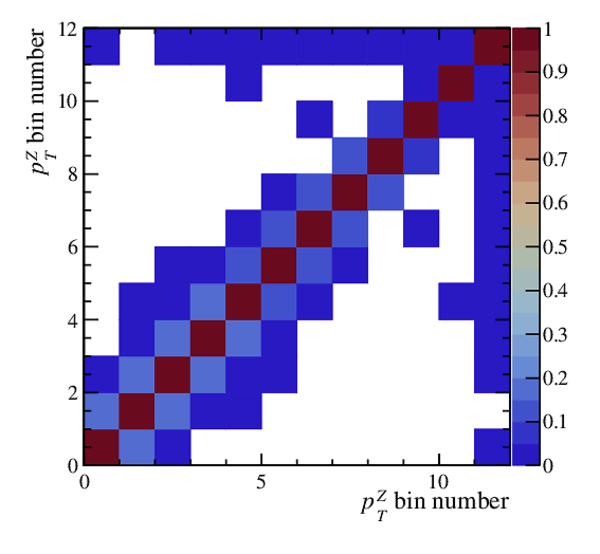
Statistical correlation matrices for the differential cross-section measurements as functions of (top-left) $ y^{{Z}}$ , (top-right) $ p_{\mathrm{T}}^{Z}$ and (bottom) $\phi_{\eta}^{*}$ . |
Fig8a.pdf [14 KiB] HiDef png [120 KiB] Thumbnail [108 KiB] *.C file |
|
|
Fig8b.pdf [14 KiB] HiDef png [130 KiB] Thumbnail [114 KiB] *.C file |
|
|
|
Fig8c.pdf [14 KiB] HiDef png [127 KiB] Thumbnail [110 KiB] *.C file |

|
|
|
Correlation matrices for the efficiency uncertainties as functions of (top-left) $ y^{{Z}}$ , (top-right) $ p_{\mathrm{T}}^{Z}$ and (bottom) $\phi_{\eta}^{*}$ . |
Fig9a.pdf [14 KiB] HiDef png [146 KiB] Thumbnail [124 KiB] *.C file |

|
|
Fig9b.pdf [14 KiB] HiDef png [154 KiB] Thumbnail [131 KiB] *.C file |

|
|
|
Fig9c.pdf [14 KiB] HiDef png [138 KiB] Thumbnail [113 KiB] *.C file |

|
|
|
Animated gif made out of all figures. |
PAPER-2023-010.gif Thumbnail |

|
![HiDef png [190 KiB]](Directory_LHCb-PAPER-2023-010/hidef_Fig1.png)
![HiDef png [63 KiB]](Directory_LHCb-PAPER-2023-010/hidef_Fig2a.png)
![HiDef png [65 KiB]](Directory_LHCb-PAPER-2023-010/hidef_Fig2b.png)
![HiDef png [63 KiB]](Directory_LHCb-PAPER-2023-010/hidef_Fig2c.png)
![HiDef png [217 KiB]](Directory_LHCb-PAPER-2023-010/hidef_Fig3a.png)
![HiDef png [241 KiB]](Directory_LHCb-PAPER-2023-010/hidef_Fig3b.png)
![HiDef png [194 KiB]](Directory_LHCb-PAPER-2023-010/hidef_Fig3c.png)
![HiDef png [207 KiB]](Directory_LHCb-PAPER-2023-010/hidef_Fig3d.png)
![HiDef png [192 KiB]](Directory_LHCb-PAPER-2023-010/hidef_Fig3e.png)
![HiDef png [208 KiB]](Directory_LHCb-PAPER-2023-010/hidef_Fig3f.png)
![HiDef png [216 KiB]](Directory_LHCb-PAPER-2023-010/hidef_Fig4.png)
![HiDef png [84 KiB]](Directory_LHCb-PAPER-2023-010/hidef_Fig5.png)
![HiDef png [154 KiB]](Directory_LHCb-PAPER-2023-010/hidef_Fig6a.png)
![HiDef png [150 KiB]](Directory_LHCb-PAPER-2023-010/hidef_Fig6b.png)
![HiDef png [57 KiB]](Directory_LHCb-PAPER-2023-010/hidef_Fig7a.png)
![HiDef png [60 KiB]](Directory_LHCb-PAPER-2023-010/hidef_Fig7b.png)
![HiDef png [58 KiB]](Directory_LHCb-PAPER-2023-010/hidef_Fig7c.png)
![HiDef png [120 KiB]](Directory_LHCb-PAPER-2023-010/hidef_Fig8a.png)
![HiDef png [130 KiB]](Directory_LHCb-PAPER-2023-010/hidef_Fig8b.png)
![HiDef png [127 KiB]](Directory_LHCb-PAPER-2023-010/hidef_Fig8c.png)
![HiDef png [146 KiB]](Directory_LHCb-PAPER-2023-010/hidef_Fig9a.png)
![HiDef png [154 KiB]](Directory_LHCb-PAPER-2023-010/hidef_Fig9b.png)
![HiDef png [138 KiB]](Directory_LHCb-PAPER-2023-010/hidef_Fig9c.png)
Tables and captions
|
Summary of the background composition in the $ Z \rightarrow \mu ^+\mu ^- $ data sample of candidates satisfying the signal selection. |
Table_1.pdf [64 KiB] HiDef png [78 KiB] Thumbnail [37 KiB] tex code |

|
|
The uncertainties for the integrated $ Z \rightarrow \mu ^+\mu ^- $ cross-section measurement. |
Table_2.pdf [64 KiB] HiDef png [79 KiB] Thumbnail [38 KiB] tex code |

|
|
Final state radiation correction used in the $ y^{{Z}}$ cross-section measurement. The first uncertainty is statistical and the second is systematic. |
Table_3.pdf [51 KiB] HiDef png [235 KiB] Thumbnail [112 KiB] tex code |

|
|
Final state radiation correction used in the $ p_{\mathrm{T}}^{Z}$ cross-section measurement. The first uncertainty is statistical and the second is systematic. |
Table_4.pdf [59 KiB] HiDef png [201 KiB] Thumbnail [96 KiB] tex code |

|
|
Final state radiation correction used in the $\phi_{\eta}^{*}$ cross-section measurement. The first uncertainty is statistical and the second is systematic. |
Table_5.pdf [58 KiB] HiDef png [194 KiB] Thumbnail [92 KiB] tex code |

|
|
The muon tracking, muon identification and trigger efficiency in each pseudorapidity bin. |
Table_6.pdf [52 KiB] HiDef png [161 KiB] Thumbnail [74 KiB] tex code |

|
|
Systematic uncertainties on the single differential cross-sections in bins of $ y^{{Z}}$ , presented in percentage. |
Table_7.pdf [47 KiB] HiDef png [135 KiB] Thumbnail [66 KiB] tex code |

|
|
Systematic uncertainties on the single differential cross-sections in bins of $ p_{\mathrm{T}}^{Z}$ , presented in percentage. |
Table_8.pdf [56 KiB] HiDef png [91 KiB] Thumbnail [41 KiB] tex code |

|
|
Systematic uncertainties on the single differential cross-sections in bins of $\phi_{\eta}^{*}$ , presented in percentage. |
Table_9.pdf [54 KiB] HiDef png [112 KiB] Thumbnail [55 KiB] tex code |

|
|
Measured single differential cross-sections in bins of $ y^{{Z}}$ . The first uncertainty is statistical, the second systematic, and the third is from the uncertainty on the integrated luminosity. |
Table_10.pdf [66 KiB] HiDef png [153 KiB] Thumbnail [81 KiB] tex code |

|
|
Measured single differential cross-sections in bins of $ p_{\mathrm{T}}^{Z}$ . The first uncertainty is statistical, the second systematic, and the third is due to the luminosity. |
Table_11.pdf [67 KiB] HiDef png [119 KiB] Thumbnail [62 KiB] tex code |

|
|
Measured single differential cross-sections in bins of $\phi_{\eta}^{*}$ . The first uncertainty is statistical, the second systematic, and the third is due to the luminosity. |
Table_12.pdf [66 KiB] HiDef png [113 KiB] Thumbnail [61 KiB] tex code |

|
|
Statistical correlation matrix for the one-dimensional $ y^{{Z}}$ measurement. |
Table_13.pdf [29 KiB] HiDef png [77 KiB] Thumbnail [26 KiB] tex code |

|
|
Statistical correlation matrix for the one-dimensional $ p_{\mathrm{T}}^{Z}$ measurement. |
Table_14.pdf [29 KiB] HiDef png [64 KiB] Thumbnail [32 KiB] tex code |

|
|
Statistical correlation matrix for the one-dimensional $\phi_{\eta}^{*}$ measurement. |
Table_15.pdf [29 KiB] HiDef png [68 KiB] Thumbnail [30 KiB] tex code |

|
|
Correlation matrix for the efficiency uncertainty of the one-dimensional $ y^{{Z}}$ measurement. |
Table_16.pdf [29 KiB] HiDef png [79 KiB] Thumbnail [32 KiB] tex code |

|
|
Correlation matrix for the efficiency uncertainty of the one-dimensional $ p_{\mathrm{T}}^{Z}$ measurement. |
Table_17.pdf [29 KiB] HiDef png [69 KiB] Thumbnail [34 KiB] tex code |

|
|
Correlation matrix for the efficiency uncertainty of the one-dimensional $\phi_{\eta}^{*}$ measurement. |
Table_18.pdf [29 KiB] HiDef png [74 KiB] Thumbnail [34 KiB] tex code |

|
![HiDef png [78 KiB]](Directory_LHCb-PAPER-2023-010/hidef_Table_1.png)
![HiDef png [79 KiB]](Directory_LHCb-PAPER-2023-010/hidef_Table_2.png)
![HiDef png [235 KiB]](Directory_LHCb-PAPER-2023-010/hidef_Table_3.png)
![HiDef png [201 KiB]](Directory_LHCb-PAPER-2023-010/hidef_Table_4.png)
![HiDef png [194 KiB]](Directory_LHCb-PAPER-2023-010/hidef_Table_5.png)
![HiDef png [161 KiB]](Directory_LHCb-PAPER-2023-010/hidef_Table_6.png)
![HiDef png [135 KiB]](Directory_LHCb-PAPER-2023-010/hidef_Table_7.png)
![HiDef png [91 KiB]](Directory_LHCb-PAPER-2023-010/hidef_Table_8.png)
![HiDef png [112 KiB]](Directory_LHCb-PAPER-2023-010/hidef_Table_9.png)
![HiDef png [153 KiB]](Directory_LHCb-PAPER-2023-010/hidef_Table_10.png)
![HiDef png [119 KiB]](Directory_LHCb-PAPER-2023-010/hidef_Table_11.png)
![HiDef png [113 KiB]](Directory_LHCb-PAPER-2023-010/hidef_Table_12.png)
![HiDef png [77 KiB]](Directory_LHCb-PAPER-2023-010/hidef_Table_13.png)
![HiDef png [64 KiB]](Directory_LHCb-PAPER-2023-010/hidef_Table_14.png)
![HiDef png [68 KiB]](Directory_LHCb-PAPER-2023-010/hidef_Table_15.png)
![HiDef png [79 KiB]](Directory_LHCb-PAPER-2023-010/hidef_Table_16.png)
![HiDef png [69 KiB]](Directory_LHCb-PAPER-2023-010/hidef_Table_17.png)
![HiDef png [74 KiB]](Directory_LHCb-PAPER-2023-010/hidef_Table_18.png)
Created on 27 April 2024.