Information
LHCb-PAPER-2023-014
CERN-EP-2023-140
arXiv:2308.00587 [PDF]
(Submitted on 01 Aug 2023)
JHEP 10 (2023) 106
Inspire 2685710
Tools
Abstract
This paper reports the observation of the decays $B_{(s)}^{0}\to D_{s1}(2536)^{\mp}K^{\pm}$ using proton-proton collision data collected by the LHCb experiment, corresponding to an integrated luminosity of $9 \mathrm{fb}^{-1}$. The branching fractions of these decays are measured relative to the normalisation channel $B^{0}\to \overline{D}^{0}K^{+}K^{-}$. The $D_{s1}(2536)^{-}$ meson is reconstructed in the $\overline{D}^{*}(2007)^{0}K^{-}$ decay channel and the products of branching fractions are measured to be $$\mathcal{B}(B_{s}^{0}\to D_{s1}(2536)^{\mp}K^{\pm})\times\mathcal{B}(D_{s1}(2536)^{-}\to\overline{D}^{*}(2007)^{0}K^{-})=(2.49\pm0.11\pm0.12\pm0.25\pm0.06)\times 10^{-5}, $$ $$\mathcal{B}(B^{0}\to D_{s1}(2536)^{\mp}K^{\pm})\times\mathcal{B}(D_{s1}(2536)^{-}\to\overline{D}^{*}(2007)^{0}K^{-}) = (0.510\pm0.021\pm0.036\pm0.050)\times 10^{-5}.$$ The first uncertainty is statistical, the second systematic, and the third arises from the uncertainty of the branching fraction of the $B^{0}\to \overline{D}^{0}K^{+}K^{-}$ normalisation channel. The last uncertainty in the $B_{s}^{0}$ result is due to the limited knowledge of the fragmentation fraction ratio, $f_{s}/f_{d}$. The significance for the $B_{s}^{0}$ and $B^{0}$ signals is larger than $10 \sigma$. The ratio of the helicity amplitudes which governs the angular distribution of the $D_{s1}(2536)^{-}\to\overline{D}^{*}(2007)^{0}K^{-}$ decay is determined from the data. The ratio of the $S$- and $D$-wave amplitudes is found to be $1.11\pm0.15\pm 0.06$ and its phase $0.70\pm0.09\pm 0.04$ rad, where the first uncertainty is statistical and the second systematic.
Figures and captions
|
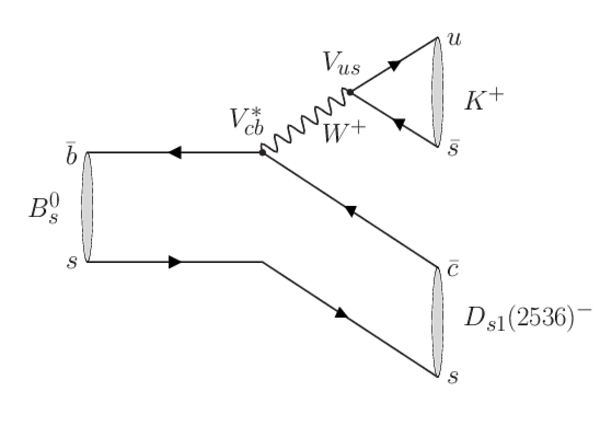
Feynman diagrams for the $ B ^0_ s \rightarrow D _{ s 1}(2536)^{-} K ^+ $ (left) and $\overline{ B } {}^0_ s \rightarrow D _{ s 1}(2536)^{-} K ^+ $ (right) decay channel. |
Bs2Ds1K.pdf [9 KiB] HiDef png [104 KiB] Thumbnail [91 KiB] *.C file |
|
|
Bsb2Ds1K.pdf [9 KiB] HiDef png [103 KiB] Thumbnail [91 KiB] *.C file |

|
|
|
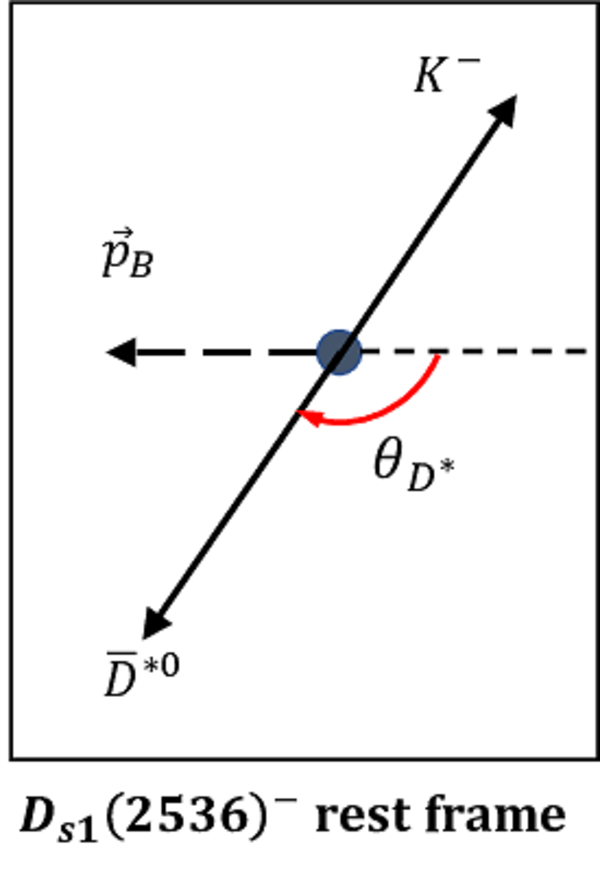
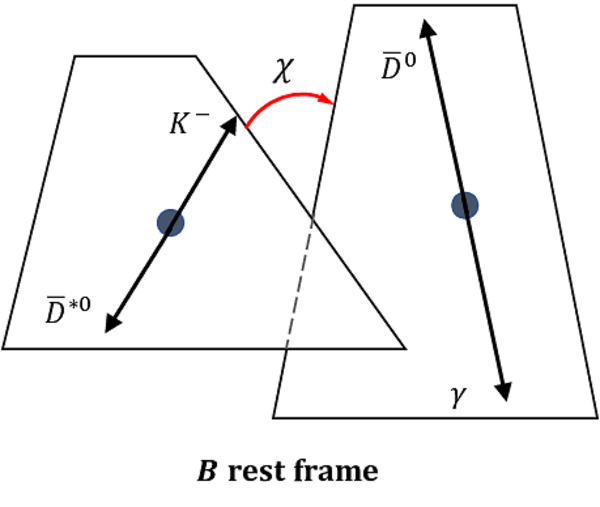
Illustration of the $ B_{(s)}^0 \rightarrow D _{ s 1}(2536)^{\mp} K ^\pm $ decay angles. |
theta_Dst0.pdf [16 KiB] HiDef png [163 KiB] Thumbnail [192 KiB] *.C file |
|
|
theta_D0.pdf [15 KiB] HiDef png [145 KiB] Thumbnail [172 KiB] *.C file |

|
|
|
chi.pdf [13 KiB] HiDef png [146 KiB] Thumbnail [136 KiB] *.C file |
|
|
|
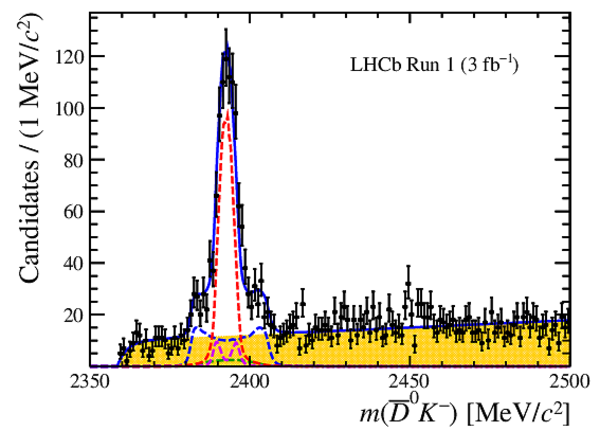
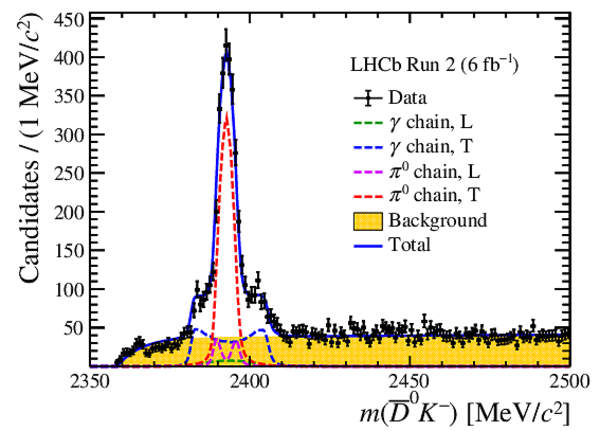
Mass distribution $m(\overline{ D } {}^0 K ^- )$ for selected candidates in (left) Run 1 and (right) Run 2 data, with the fit overlaid. The data is shown as black solid dots, while the blue solid line shows the results of fit. The green dashed line represents the photon chain with longitudinal polarised decay, the blue dashed line represents the photon chain with transverse polarised decay, the violet and red dashed lines describe the $\pi ^0$ chain with longitudinal and transverse polarisation, respectively, and the orange filled histogram represents the background. |
paper_[..].pdf [48 KiB] HiDef png [499 KiB] Thumbnail [259 KiB] *.C file |
|
|
paper_[..].pdf [50 KiB] HiDef png [495 KiB] Thumbnail [286 KiB] *.C file |
|
|
|
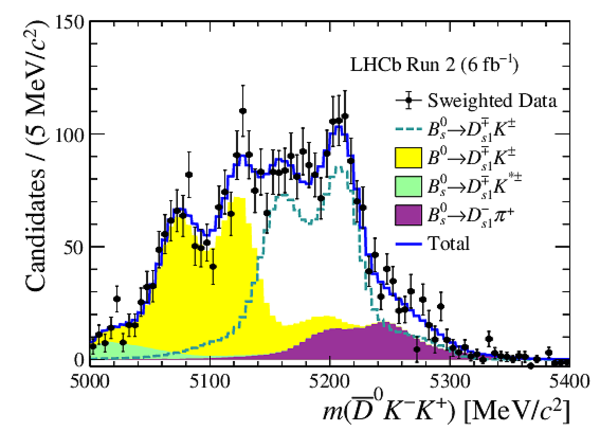
Mass distribution $m(\overline{ D } {}^0 K ^- K ^+ )$ for selected weighted candidates in (left) Run 1 and (right) Run 2 data, with the fit overlaid. The cyan dashed line represents the ${ B ^0_ s \rightarrow D _{ s 1}(2536)^{\mp} K ^\pm }$ decay channel, the yellow filled histogram represents the ${ B ^0 \rightarrow D _{ s 1}(2536)^{\mp} K ^\pm }$ decay channel, the green filled histogram represents the ${ B ^0_ s \rightarrow D _{ s 1}(2536)^{\mp} K ^{*\pm} }$ channel and the purple filled histogram represents the ${ B ^0_ s \rightarrow D _{ s 1}(2536)^{-} \pi ^+ }$ decay channel. |
paper_[..].pdf [36 KiB] HiDef png [279 KiB] Thumbnail [201 KiB] *.C file |

|
|
paper_[..].pdf [37 KiB] HiDef png [322 KiB] Thumbnail [239 KiB] *.C file |
|
|
|
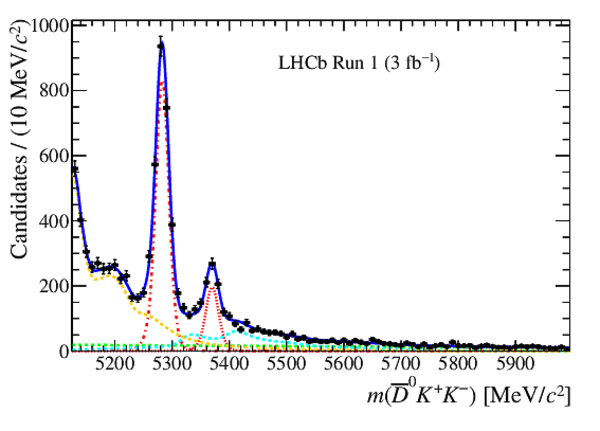
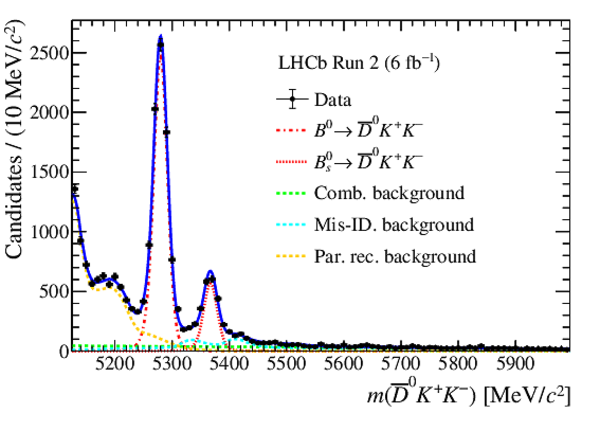
Mass distribution $m(\overline{ D } {}^0 K ^+ K ^- )$ for selected candidates in the normalisation channel in (left) Run 1 and (right) Run 2 data, with the fit overlaid. The red dot-dashed line represents the $ B ^0 \rightarrow \overline{ D } {}^0 K ^+ K ^- $ channel, the red dotted line represents the $ B ^0_ s \rightarrow \overline{ D } {}^0 K ^+ K ^- $ channel, the green dashed line represents the combinatorial background, the cyan dashed line represents the mis-identified backgrounds, which includes the $ B _{(s)}^0 \rightarrow D ^0 K \pi $ , $\Lambda ^0_ b \rightarrow D ^0 p K $ , $\Lambda ^0_ b \rightarrow D ^0 p \pi $ and $\Lambda ^0_ b \rightarrow D ^0 p \pi $ channels, the yellow dashed line represents the partially reconstructed background, which includes the $ B ^0_{(s)} \rightarrow D ^{*0} K K $ and $ B ^0_{(s)} \rightarrow D ^{*0} K \pi $ channels. |
paper_[..].pdf [36 KiB] HiDef png [277 KiB] Thumbnail [183 KiB] *.C file |
|
|
paper_[..].pdf [36 KiB] HiDef png [315 KiB] Thumbnail [228 KiB] *.C file |
|
|
|
Animated gif made out of all figures. |
PAPER-2023-014.gif Thumbnail |

|
![HiDef png [104 KiB]](Directory_LHCb-PAPER-2023-014/hidef_Bs2Ds1K.png)
![HiDef png [103 KiB]](Directory_LHCb-PAPER-2023-014/hidef_Bsb2Ds1K.png)
![HiDef png [163 KiB]](Directory_LHCb-PAPER-2023-014/hidef_theta_Dst0.png)
![HiDef png [145 KiB]](Directory_LHCb-PAPER-2023-014/hidef_theta_D0.png)
![HiDef png [146 KiB]](Directory_LHCb-PAPER-2023-014/hidef_chi.png)
![HiDef png [499 KiB]](Directory_LHCb-PAPER-2023-014/hidef_paper_DK_mass_fit_run1.png)
![HiDef png [495 KiB]](Directory_LHCb-PAPER-2023-014/hidef_paper_DK_mass_fit_run2.png)
![HiDef png [279 KiB]](Directory_LHCb-PAPER-2023-014/hidef_paper_DsoK_mass_fit_run1.png)
![HiDef png [322 KiB]](Directory_LHCb-PAPER-2023-014/hidef_paper_DsoK_mass_fit_run2.png)
![HiDef png [277 KiB]](Directory_LHCb-PAPER-2023-014/hidef_paper_DKK_mass_fit_run1_combine.png)
![HiDef png [315 KiB]](Directory_LHCb-PAPER-2023-014/hidef_paper_DKK_mass_fit_run2_combine.png)
Tables and captions
|
Definitions of the $\omega$ functions in the differential decay rate. |
Table_1.pdf [66 KiB] HiDef png [40 KiB] Thumbnail [17 KiB] tex code |

|
|
The result of fitted parameters in the $m(\overline{ D } {}^0 K ^- K ^+ )$ fit. The uncertainties are statistical. |
Table_2.pdf [69 KiB] HiDef png [57 KiB] Thumbnail [29 KiB] tex code |

|
|
Correlation coefficients between fitted parameters from the $m(\overline{ D } {}^0 K ^- K ^+ )$ fit. $N_{ B ^0 }$ is the sum of the yields from photon and $\pi ^0 $ chains for $ B ^0 \rightarrow D _{ s 1}(2536)^{\mp} K ^\pm $ . $N_{ B ^0_ s }$ is the sum of the yields from photon and $\pi ^0 $ chains for $ B ^0_ s \rightarrow D _{ s 1}(2536)^{\mp} K ^\pm $ . |
Table_3.pdf [65 KiB] HiDef png [47 KiB] Thumbnail [21 KiB] tex code |

|
|
Summary of total efficiencies for the signal $ B_{(s)}^0 \rightarrow D _{ s 1}(2536)^{\mp} K ^\pm $ and the normalisation mode $ B ^0 \rightarrow \overline{ D } {}^0 K ^+ K ^- $ , where the uncertainty is statistical. |
Table_4.pdf [69 KiB] HiDef png [73 KiB] Thumbnail [35 KiB] tex code |

|
|
Relative systematic uncertainties on the measurement of branching fraction ratios, $ {\mathcal{R}} ( B_{(s)}^0 \rightarrow D _{ s 1}(2536)^{\mp} K ^\pm )$, and the helicity-related parameters, $k$ and $|\phi|$. |
Table_5.pdf [84 KiB] HiDef png [72 KiB] Thumbnail [25 KiB] tex code |

|
![HiDef png [40 KiB]](Directory_LHCb-PAPER-2023-014/hidef_Table_1.png)
![HiDef png [57 KiB]](Directory_LHCb-PAPER-2023-014/hidef_Table_2.png)
![HiDef png [47 KiB]](Directory_LHCb-PAPER-2023-014/hidef_Table_3.png)
![HiDef png [73 KiB]](Directory_LHCb-PAPER-2023-014/hidef_Table_4.png)
![HiDef png [72 KiB]](Directory_LHCb-PAPER-2023-014/hidef_Table_5.png)
Created on 26 April 2024.