Observation and branching fraction measurement of the decay $\Xi_b^- \to \Lambda_b^0 \pi^-$
[to restricted-access page]Information
LHCb-PAPER-2023-015
CERN-EP-2023-116
arXiv:2307.09427 [PDF]
(Submitted on 18 Jul 2023)
Phys. Rev. D 108 (2023) 072002
Inspire 2680637
Tools
Abstract
The decay $\Xi_b^-\to\Lambda_b^0\pi^-$ is observed using a proton-proton collision data sample collected at center-of-mass energy $\sqrt{s}=13$ TeV with the LHCb detector, corresponding to an integrated luminosity of 5.5 fb$^{-1}$. This process is mediated by the $s\to u\bar{u}d$ quark-level transition, where the $b$ quark in the $\Xi_b^-$ baryon is a spectator in the decay. Averaging the results obtained using the two $\Lambda_b^0$ decay modes, $\Lambda_b^0\to\Lambda_c^+\pi^-$ and $\Lambda_b^0\to\Lambda_c^+\pi^-\pi^+\pi^-$, the relative production ratio is measured to be $(f_{\Xi_b^-}/f_{\Lambda_b^0}){\cal{B}}(\Xi_b^-\to\Lambda_b^0\pi^-)=(7.3\pm0.8\pm0.6)\times10^{-4}$. Here the uncertainties are statistical and systematic, respectively, and $f_{\Xi_b^-}(f_{\Lambda_b^0})$ is the fragmentation fraction for a $b$ quark into a $\Xi_b^-$ ($\Lambda_b^0$) baryon. Using an independent measurement of $f_{\Xi_b^-}/f_{\Lambda_b^0}$, the branching fraction ${\cal{B}}(\Xi_b^-\to\Lambda_b^0\pi^-)=(0.89\pm0.10\pm0.07\pm0.29)\%$ is obtained, where the last uncertainty is due to the assumed SU(3) flavor symmetry in the determination of $f_{\Xi_b^-}/f_{\Lambda_b^0}$.
Figures and captions
|
Invariant-mass spectra of (left) $\Lambda ^0_ b $ $\rightarrow$ $\Lambda ^+_ c $ $\pi ^-$ and (right) $\Lambda ^0_ b $ $\rightarrow$ $\Lambda ^+_ c $ $\pi ^-$ $\pi ^+$ $\pi ^-$ candidates for the full data sample. The fitted signal and background shapes, as described in the text, are overlaid. |
LbMass[..].pdf [25 KiB] HiDef png [306 KiB] Thumbnail [219 KiB] |

|
|
LbMass[..].pdf [25 KiB] HiDef png [319 KiB] Thumbnail [235 KiB] |

|
|
|
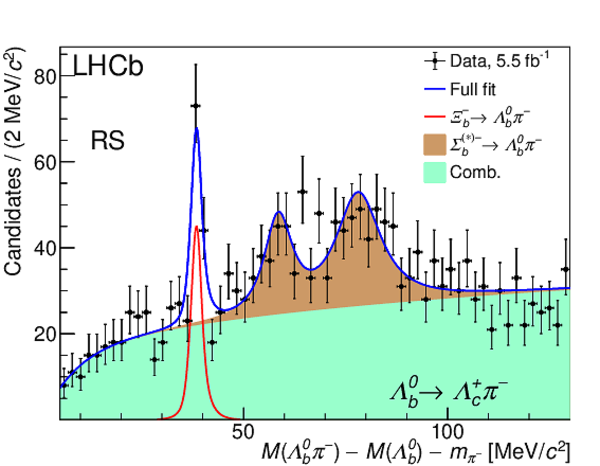
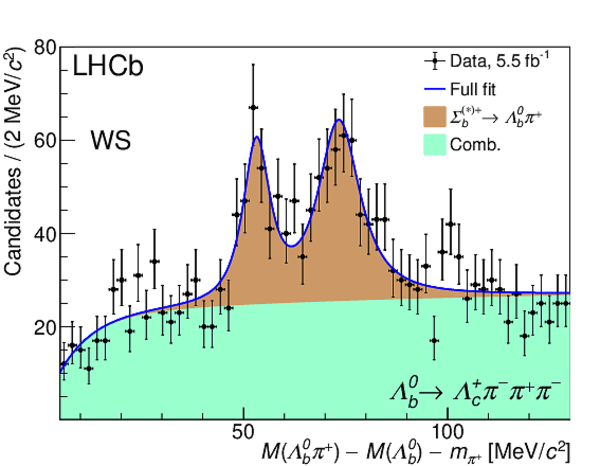
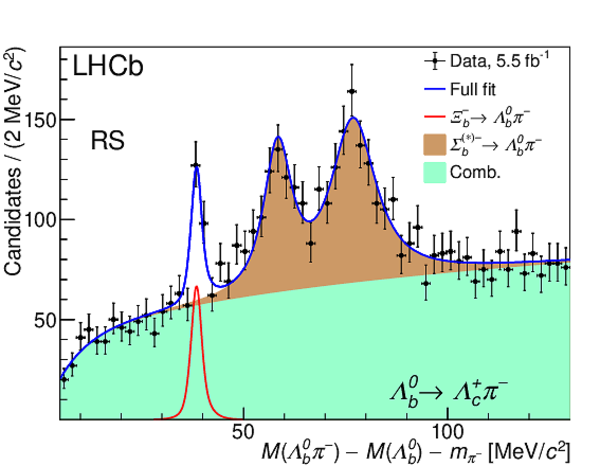
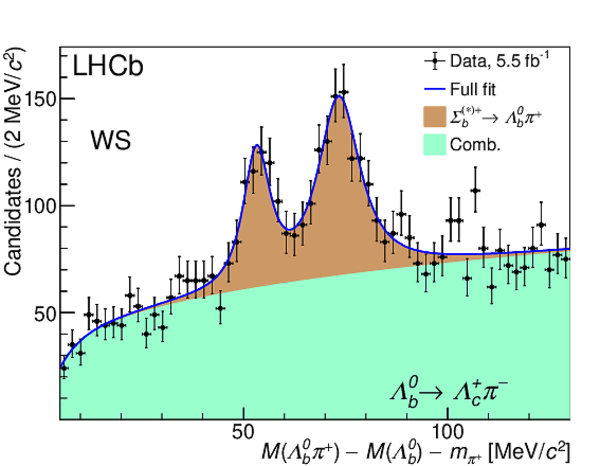
(Top row) Spectra of the mass difference, $M(\Lambda ^0_ b \pi ^- )-M(\Lambda ^0_ b )-m_{\pi ^- }$ for $\Xi ^-_ b \rightarrow \Lambda ^0_ b \pi ^- $ candidates, for the (left) $\Lambda ^0_ b \rightarrow \Lambda ^+_ c \pi ^- $ and (right) $\Lambda ^0_ b \rightarrow \Lambda ^+_ c \pi ^- \pi ^+ \pi ^- $ right-sign samples, with the tight BDT2 selection. The bottom row shows the corresponding distributions for the wrong-sign candidates. Fits to the data are overlaid as described in the text. |
XibMas[..].pdf [28 KiB] HiDef png [332 KiB] Thumbnail [230 KiB] |
|
|
XibMas[..].pdf [28 KiB] HiDef png [360 KiB] Thumbnail [244 KiB] |

|
|
|
XibMas[..].pdf [21 KiB] HiDef png [295 KiB] Thumbnail [210 KiB] |

|
|
|
XibMas[..].pdf [21 KiB] HiDef png [313 KiB] Thumbnail [219 KiB] |
|
|
|
(Top row) Spectra of the mass difference, $M(\Lambda ^0_ b \pi ^- )-M(\Lambda ^0_ b )-m_{\pi ^- }$ for $\Xi ^-_ b \rightarrow \Lambda ^0_ b \pi ^- $ candidates, for the (left) $\Lambda ^0_ b \rightarrow \Lambda ^+_ c \pi ^- $ and (right) $\Lambda ^0_ b \rightarrow \Lambda ^+_ c \pi ^- \pi ^+ \pi ^- $ right-sign samples with the loose BDT2 selection. The bottom row shows the corresponding distributions for the wrong-sign candidates. Fits to the data are overlaid as described in the text. |
XibMas[..].pdf [28 KiB] HiDef png [327 KiB] Thumbnail [227 KiB] |
|
|
XibMas[..].pdf [28 KiB] HiDef png [353 KiB] Thumbnail [240 KiB] |

|
|
|
XibMas[..].pdf [21 KiB] HiDef png [298 KiB] Thumbnail [210 KiB] |
|
|
|
XibMas[..].pdf [21 KiB] HiDef png [304 KiB] Thumbnail [214 KiB] |

|
|
|
Spectra of the mass difference, $M(\Lambda ^0_ b \pi ^- )-M(\Lambda ^0_ b )-m_{\pi ^- }$ for $\Xi ^-_ b \rightarrow \Lambda ^0_ b \pi ^- $ candidates for the combined $\Lambda ^0_ b \rightarrow \Lambda ^+_ c \pi ^- $ and $\Lambda ^0_ b \rightarrow \Lambda ^+_ c \pi ^- \pi ^+ \pi ^- $ samples for (left) tight BDT2 selection and (right) loose BDT2 selection. |
XibMas[..].pdf [28 KiB] HiDef png [339 KiB] Thumbnail [228 KiB] |

|
|
XibMas[..].pdf [28 KiB] HiDef png [343 KiB] Thumbnail [232 KiB] |

|
|
|
Animated gif made out of all figures. |
PAPER-2023-015.gif Thumbnail |

|
![HiDef png [306 KiB]](Directory_LHCb-PAPER-2023-015/hidef_LbMassFit_Run2_LcPi.png)
![HiDef png [319 KiB]](Directory_LHCb-PAPER-2023-015/hidef_LbMassFit_Run2_Lc3Pi.png)
![HiDef png [332 KiB]](Directory_LHCb-PAPER-2023-015/hidef_XibMassFit_Paper_LcPi_tight.png)
![HiDef png [360 KiB]](Directory_LHCb-PAPER-2023-015/hidef_XibMassFit_Paper_Lc3Pi_tight.png)
![HiDef png [295 KiB]](Directory_LHCb-PAPER-2023-015/hidef_XibMassFit_WS_Paper_LcPi_tight.png)
![HiDef png [313 KiB]](Directory_LHCb-PAPER-2023-015/hidef_XibMassFit_WS_Paper_Lc3Pi_tight.png)
![HiDef png [327 KiB]](Directory_LHCb-PAPER-2023-015/hidef_XibMassFit_Paper_LcPi_floatA.png)
![HiDef png [353 KiB]](Directory_LHCb-PAPER-2023-015/hidef_XibMassFit_Paper_Lc3Pi_floatA.png)
![HiDef png [298 KiB]](Directory_LHCb-PAPER-2023-015/hidef_XibMassFit_WS_Paper_LcPi_floatA.png)
![HiDef png [304 KiB]](Directory_LHCb-PAPER-2023-015/hidef_XibMassFit_WS_Paper_Lc3Pi_floatA.png)
![HiDef png [339 KiB]](Directory_LHCb-PAPER-2023-015/hidef_XibMassFit_LcPi_Lc3Pi_Paper_tight_floatA.png)
![HiDef png [343 KiB]](Directory_LHCb-PAPER-2023-015/hidef_XibMassFit_LcPi_Lc3Pi_Paper_floatA.png)
Tables and captions
|
Efficiencies for the two BDT2 selections on simulated $\Xi ^-_ b $ signal decays and on WS background (in %) for the two $\Lambda ^0_ b $ final states. The FOM values are also shown. Uncertainties are statistical only. |
Table_1.pdf [83 KiB] HiDef png [25 KiB] Thumbnail [11 KiB] tex code |

|
|
Summary of the yields in the signal ($N(\Xi ^-_ b )$) and normalization modes ($N(\Lambda ^0_ b )$), the relative efficiencies ($\epsilon_{\rm rel}$), and the resulting $r_s$ values for the loose BDT selection. The $\Lambda ^0_ b $ signal yields are in the invariant-mass region $5560<M(\Lambda ^0_ b )<5680$ $\text{ Me V /}c^2$ . Uncertainties are statistical only. |
Table_2.pdf [68 KiB] HiDef png [50 KiB] Thumbnail [26 KiB] tex code |

|
|
{Systematic uncertainties in the measurement of $r_s$ for each of the two decay modes of the $\Lambda ^0_ b $ baryon. The horizontal dividing line separates the uncorrelated (above) and correlated (below) uncertainties}. For the latter, the listed sources are 100% correlated between the two $\Lambda ^0_ b $ decay modes. |
Table_3.pdf [66 KiB] HiDef png [139 KiB] Thumbnail [64 KiB] tex code |

|
![HiDef png [25 KiB]](Directory_LHCb-PAPER-2023-015/hidef_Table_1.png)
![HiDef png [50 KiB]](Directory_LHCb-PAPER-2023-015/hidef_Table_2.png)
![HiDef png [139 KiB]](Directory_LHCb-PAPER-2023-015/hidef_Table_3.png)
Created on 26 April 2024.