Observation of $\Xi_b^0 \rightarrow \Xi_c^+ D_s^-$ and $\Xi_b^- \rightarrow \Xi_c^0 D_s^-$ decays
[to restricted-access page]Information
LHCb-PAPER-2023-017
CERN-EP-2023-173
arXiv:2310.13546 [PDF]
(Submitted on 20 Oct 2023)
Eur. Phys. J. C 84, 237 (2024)
Inspire 2713081
Tools
Abstract
The $\Xi_b^0 \rightarrow \Xi_c^+ D_s^-$ and $\Xi_b^- \rightarrow \Xi_c^0 D_s^-$ decays are observed for the first time using proton-proton collision data collected by the LHCb experiment at a centre-of-mass energy of $\sqrt{s}=13\mathrm{TeV}$, corresponding to an integrated luminosity of $5.1\mathrm{fb}^{-1}$. The relative branching fractions times the beauty-baryon production cross-sections are measured to be \begin{align*} \mathcal{R}\left(\frac{\Xi_b^0}{\Lambda_b^0}\right) \equiv \frac{\sigma\left(\Xi_b^0\right)}{\sigma\left(\Lambda_b^0\right)} \times \frac{\mathcal{B}\left(\Xi_b^0 \rightarrow \Xi_c^+ D_s^-\right)}{\mathcal{B}\left(\Lambda_b^0 \rightarrow \Lambda_c^0 D_s^-\right)} =(15.8\pm1.1\pm0.6\pm7.7)\%, \mathcal{R}\left(\frac{\Xi_b^-}{\Lambda_b^0}\right) \equiv \frac{\sigma\left(\Xi_b^-\right)}{\sigma\left(\Lambda_b^0\right)} \times \frac{\mathcal{B}\left(\Xi_b^- \rightarrow \Xi_c^0 D_s^-\right)}{\mathcal{B}\left(\Lambda_b^0 \rightarrow \Lambda_c^0 D_s^-\right)} =(16.9\pm1.3\pm0.9\pm4.3)\%, \end{align*} where the first uncertainties are statistical, the second systematic, and the third due to the uncertainties on the branching fractions of relevant charm-baryon decays. The masses of $\Xi_b^0$ and $\Xi_b^-$ baryons are measured to be $m_{\Xi_b^0}=5791.12\pm0.60\pm0.45\pm0.24\mathrm{MeV}/c^2$ and $m_{\Xi_b^-}=5797.02\pm0.63\pm0.49\pm0.29\mathrm{MeV}/c^2$, where the uncertainties are statistical, systematic, and those due to charm-hadron masses, respectively.
Figures and captions
|
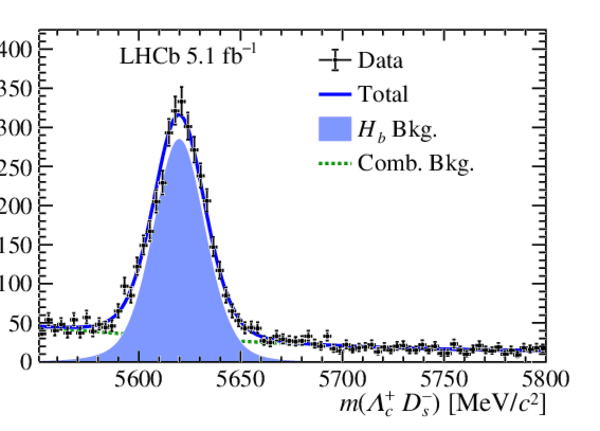
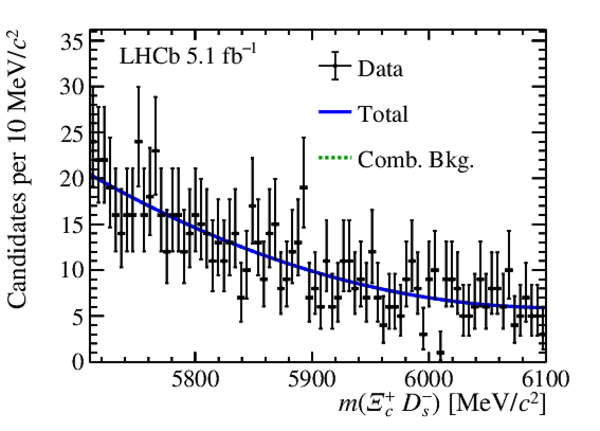
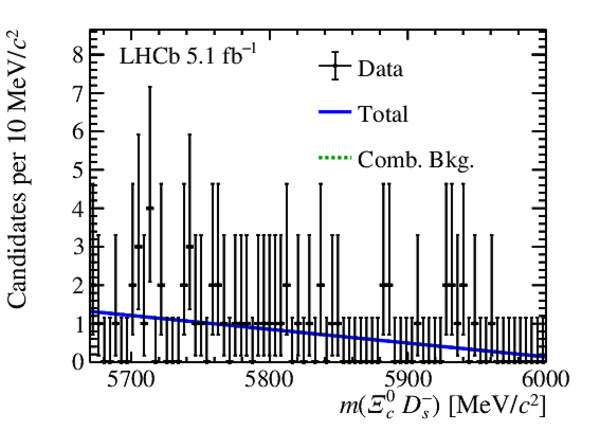
Invariant-mass distributions of (top left) $\Lambda ^0_ b $ , (top right) $\Xi ^0_ b $ , and (bottom) $\Xi ^-_ b $ decays. The data are overlaid on the fit results. |
mass_d[..].pdf [34 KiB] HiDef png [298 KiB] Thumbnail [206 KiB] *.C file |

|
|
mass_d[..].pdf [33 KiB] HiDef png [364 KiB] Thumbnail [253 KiB] *.C file |

|
|
|
mass_d[..].pdf [30 KiB] HiDef png [307 KiB] Thumbnail [209 KiB] *.C file |

|
|
|
Comparison of measured (red) $b$ baryon masses with (blue) the PDG values [2]. The mass of $\Lambda ^0_ b $ is shifted upward by 175 $\text{ Me V /}c^2$ to reduce the range of this plot. The inner (outer) error bar is for the statistical (total) uncertainty. |
M.pdf [13 KiB] HiDef png [64 KiB] Thumbnail [56 KiB] *.C file |

|
|
Measured $\mathcal{R}$ values. The inner (outer) error bar is for the statistical (total) uncertainty. |
BF.pdf [14 KiB] HiDef png [44 KiB] Thumbnail [40 KiB] *.C file |

|
|
Distributions of the $H_c$ mass versus the $ D ^-_ s $ mass with the regions 1--4 indicated. The regions illustrate the signal region and the $H_c$ and/or $ D ^-_ s $ sideband regions. |
mDs_mX[..].pdf [42 KiB] HiDef png [319 KiB] Thumbnail [398 KiB] *.C file |

|
|
mDs_mX[..].pdf [44 KiB] HiDef png [907 KiB] Thumbnail [647 KiB] *.C file |

|
|
|
mDs_mX[..].pdf [21 KiB] HiDef png [495 KiB] Thumbnail [442 KiB] *.C file |

|
|
|
Invariant-mass distributions of $\Lambda ^0_ b $ candidates in the (top left) region 1, (top right) region 2, and (bottom) region 3. |
region1_lb.pdf [31 KiB] HiDef png [313 KiB] Thumbnail [229 KiB] *.C file |

|
|
region2_lb.pdf [32 KiB] HiDef png [323 KiB] Thumbnail [221 KiB] *.C file |
|
|
|
region3_lb.pdf [33 KiB] HiDef png [263 KiB] Thumbnail [230 KiB] *.C file |

|
|
|
Invariant-mass distributions of $\Lambda ^0_ b $ candidates in the (top left) region 1, (top right) region 2, and (bottom) region 3. |
region[..].pdf [29 KiB] HiDef png [222 KiB] Thumbnail [208 KiB] *.C file |
|
|
region[..].pdf [30 KiB] HiDef png [327 KiB] Thumbnail [238 KiB] *.C file |

|
|
|
region[..].pdf [30 KiB] HiDef png [218 KiB] Thumbnail [205 KiB] *.C file |

|
|
|
Invariant-mass distributions of $\Lambda ^0_ b $ candidates in the (top left) region 1, (top right) region 2, and (bottom) region 3. |
region[..].pdf [27 KiB] HiDef png [210 KiB] Thumbnail [186 KiB] *.C file |
|
|
region[..].pdf [28 KiB] HiDef png [299 KiB] Thumbnail [209 KiB] *.C file |

|
|
|
region[..].pdf [30 KiB] HiDef png [331 KiB] Thumbnail [236 KiB] *.C file |

|
|
|
Animated gif made out of all figures. |
PAPER-2023-017.gif Thumbnail |

|
![HiDef png [298 KiB]](Directory_LHCb-PAPER-2023-017/hidef_mass_data_lb_paper.png)
![HiDef png [364 KiB]](Directory_LHCb-PAPER-2023-017/hidef_mass_data_xib0_paper.png)
![HiDef png [307 KiB]](Directory_LHCb-PAPER-2023-017/hidef_mass_data_xibm_paper.png)
![HiDef png [64 KiB]](Directory_LHCb-PAPER-2023-017/hidef_M.png)
![HiDef png [44 KiB]](Directory_LHCb-PAPER-2023-017/hidef_BF.png)
![HiDef png [319 KiB]](Directory_LHCb-PAPER-2023-017/hidef_mDs_mXc_lb_num.png)
![HiDef png [907 KiB]](Directory_LHCb-PAPER-2023-017/hidef_mDs_mXc_xib0_num.png)
![HiDef png [495 KiB]](Directory_LHCb-PAPER-2023-017/hidef_mDs_mXc_xibm_num.png)
![HiDef png [313 KiB]](Directory_LHCb-PAPER-2023-017/hidef_region1_lb.png)
![HiDef png [323 KiB]](Directory_LHCb-PAPER-2023-017/hidef_region2_lb.png)
![HiDef png [263 KiB]](Directory_LHCb-PAPER-2023-017/hidef_region3_lb.png)
![HiDef png [222 KiB]](Directory_LHCb-PAPER-2023-017/hidef_region1_xib0.png)
![HiDef png [327 KiB]](Directory_LHCb-PAPER-2023-017/hidef_region2_xib0.png)
![HiDef png [218 KiB]](Directory_LHCb-PAPER-2023-017/hidef_region3_xib0.png)
![HiDef png [210 KiB]](Directory_LHCb-PAPER-2023-017/hidef_region1_xibm.png)
![HiDef png [299 KiB]](Directory_LHCb-PAPER-2023-017/hidef_region2_xibm.png)
![HiDef png [331 KiB]](Directory_LHCb-PAPER-2023-017/hidef_region3_xibm.png)
Tables and captions
|
Branching fractions of $H_c$ decays [2]. |
Table_1.pdf [68 KiB] HiDef png [60 KiB] Thumbnail [28 KiB] tex code |

|
|
Systematic uncertainties on the relative branching fraction measurements. Results are given as relative uncertainties. |
Table_2.pdf [78 KiB] HiDef png [78 KiB] Thumbnail [35 KiB] tex code |

|
|
Systematic uncertainties for the $H_b$ mass measurements. |
Table_3.pdf [83 KiB] HiDef png [38 KiB] Thumbnail [16 KiB] tex code |

|
|
Systematic uncertainties for the $H_b$ mass-difference measurements. |
Table_4.pdf [82 KiB] HiDef png [42 KiB] Thumbnail [18 KiB] tex code |

|
|
Measured $H_b$ masses and mass differences and the previous world averages [2]. |
Table_5.pdf [76 KiB] HiDef png [49 KiB] Thumbnail [20 KiB] tex code |

|
![HiDef png [60 KiB]](Directory_LHCb-PAPER-2023-017/hidef_Table_1.png)
![HiDef png [78 KiB]](Directory_LHCb-PAPER-2023-017/hidef_Table_2.png)
![HiDef png [38 KiB]](Directory_LHCb-PAPER-2023-017/hidef_Table_3.png)
![HiDef png [42 KiB]](Directory_LHCb-PAPER-2023-017/hidef_Table_4.png)
![HiDef png [49 KiB]](Directory_LHCb-PAPER-2023-017/hidef_Table_5.png)
Created on 26 April 2024.