Search for $\textit{CP}$ violation in the phase space of $D^{0} \rightarrow K_{S}^{0} K^{\pm} \pi^{\mp} $ decays with the energy test
[to restricted-access page]Information
LHCb-PAPER-2023-019
CERN-EP-2023-231
arXiv:2310.19397 [PDF]
(Submitted on 30 Oct 2023)
JHEP 03 (2024) 107
Inspire 2715658
Tools
Abstract
A search for $\textit{CP}$ violation in $D^{0} \rightarrow K_{S}^{0} K^{+} \pi^{-} $ and $D^{0} \rightarrow K_{S}^{0} K^{-} \pi^{+} $ decays is reported. The search is performed using an unbinned model-independent method known as the energy test that probes local $\textit{CP}$ violation in the phase space of the decays. The data analysed correspond to an integrated luminosity of $5.4 $fb$^{-1}$ collected in proton-proton collisions by the LHCb experiment at a centre-of-mass energy of $\sqrt{s}=13$ TeV, amounting to approximately 950 thousand and 620 thousand signal candidates for the $D^{0} \rightarrow K_{S}^{0} K^{-} \pi^{+} $ and $D^{0} \rightarrow K_{S}^{0} K^{+} \pi^{-} $ modes, respectively. The method is validated using $D^{0} \rightarrow K^{-} \pi^{+} \pi^{-} \pi^{+} $ and $D^{0} \rightarrow K_{S}^{0} \pi^{+} \pi^{-} $ decays, where $\textit{CP}$-violating effects are expected to be negligible, and using background-enhanced regions of the signal decays. The results are consistent with $\textit{CP}$ symmetry in both the $D^{0} \rightarrow K_{S}^{0} K^{-} \pi^{+} $ and the $D^{0} \rightarrow K_{S}^{0} K^{+} \pi^{-} $ decays, with $p$-values for the hypothesis of no $\textit{CP}$ violation of 70 and 66, respectively.
Figures and captions
|
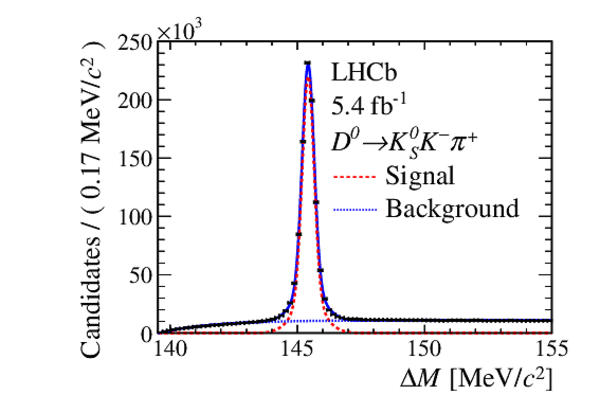
Distributions of $\Delta M$ for $D^{0} \rightarrow K_{S}^{0} K^{\pm} \pi^{\mp}$ decays for (left) SS and (right) OS decays with fit results overlaid. For each decay charge conjugation is always implied. |
Fig1a.pdf [24 KiB] HiDef png [201 KiB] Thumbnail [166 KiB] *.C file |
|
|
Fig1b.pdf [24 KiB] HiDef png [187 KiB] Thumbnail [160 KiB] *.C file |

|
|
|
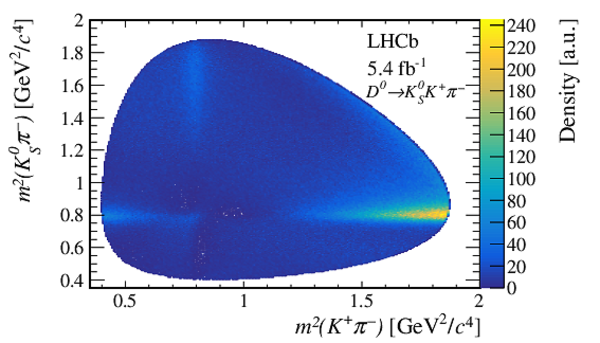
Dalitz plots of the selected signal samples for the (left) SS and (right) OS decays. The peaking structure seen as a horizontal band in both plots corresponds to the $ K ^{*\pm}$ resonance. The $ K ^{*0}$ resonance is also visible as a vertical band in the OS decays phase space distribution. For each decay charge conjugation is always implied. |
Fig2a.pdf [180 KiB] HiDef png [1 MiB] Thumbnail [463 KiB] *.C file |

|
|
Fig2b.pdf [201 KiB] HiDef png [1 MiB] Thumbnail [501 KiB] *.C file |
|
|
|
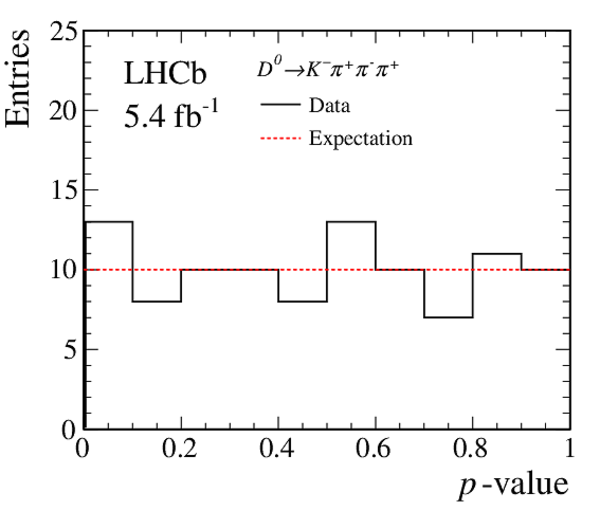
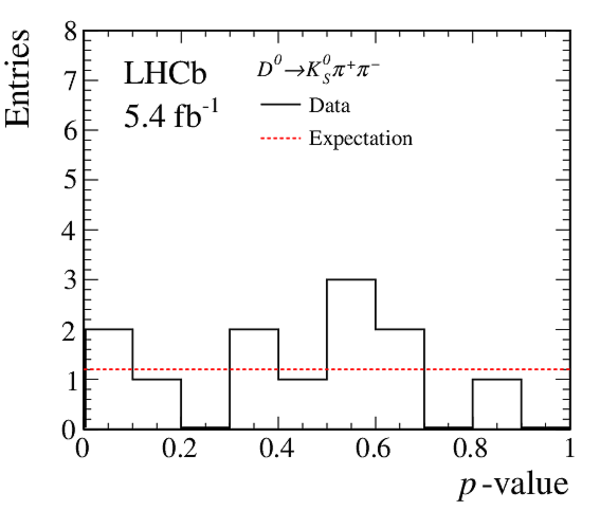
Distribution of $p$-values for the control channels obtained from (left) $ D ^0 \rightarrow K ^- \pi ^+ \pi ^- \pi ^+ $ decays and (right) $ D ^0 \rightarrow K ^0_{\mathrm{S}} \pi ^+ \pi ^- $ decays. Each $p$-value is obtained by comparing subsamples with roughly the same yield as that observed in the signal channel. |
Fig3a.pdf [13 KiB] HiDef png [119 KiB] Thumbnail [117 KiB] *.C file |
|
|
Fig3b.pdf [13 KiB] HiDef png [120 KiB] Thumbnail [124 KiB] *.C file |
|
|
|
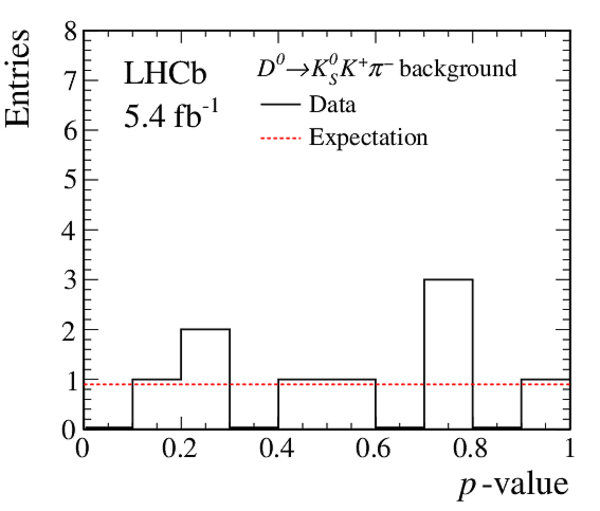
Distribution of $p$-values found in the (left) SS and (right) OS background-enhanced samples selected by considering a side-band in $\Delta M$. Each $p$-value is obtained by comparing datasets that contain roughly twice the background yield present in the signal window. |
Fig4a.pdf [13 KiB] HiDef png [133 KiB] Thumbnail [135 KiB] *.C file |

|
|
Fig4b.pdf [13 KiB] HiDef png [132 KiB] Thumbnail [140 KiB] *.C file |
|
|
|
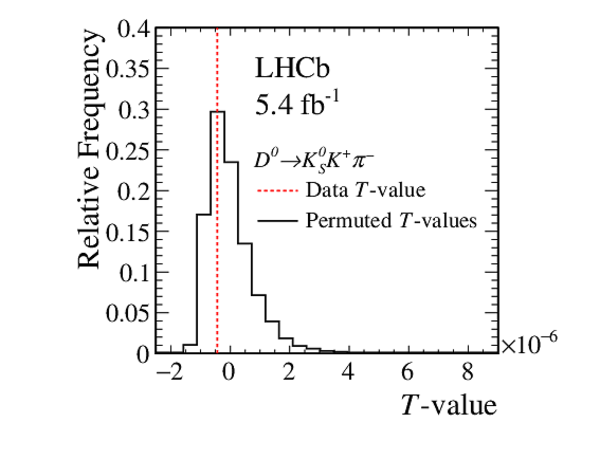
Value of $T$ found in data for (left) SS and (right) OS decays shown as a dotted red line. The normalised distribution of $T$-values expected under the hypothesis of local $ C P$ symmetry is superimposed. |
Fig5a.pdf [13 KiB] HiDef png [139 KiB] Thumbnail [141 KiB] *.C file |

|
|
Fig5b.pdf [14 KiB] HiDef png [146 KiB] Thumbnail [153 KiB] *.C file |
|
|
|
Animated gif made out of all figures. |
PAPER-2023-019.gif Thumbnail |

|
![HiDef png [201 KiB]](Directory_LHCb-PAPER-2023-019/hidef_Fig1a.png)
![HiDef png [187 KiB]](Directory_LHCb-PAPER-2023-019/hidef_Fig1b.png)
![HiDef png [1 MiB]](Directory_LHCb-PAPER-2023-019/hidef_Fig2a.png)
![HiDef png [1 MiB]](Directory_LHCb-PAPER-2023-019/hidef_Fig2b.png)
![HiDef png [119 KiB]](Directory_LHCb-PAPER-2023-019/hidef_Fig3a.png)
![HiDef png [120 KiB]](Directory_LHCb-PAPER-2023-019/hidef_Fig3b.png)
![HiDef png [133 KiB]](Directory_LHCb-PAPER-2023-019/hidef_Fig4a.png)
![HiDef png [132 KiB]](Directory_LHCb-PAPER-2023-019/hidef_Fig4b.png)
![HiDef png [139 KiB]](Directory_LHCb-PAPER-2023-019/hidef_Fig5a.png)
![HiDef png [146 KiB]](Directory_LHCb-PAPER-2023-019/hidef_Fig5b.png)
Created on 27 April 2024.