Information
LHCb-PAPER-2023-025
CERN-EP-2023-218
arXiv:2310.12649 [PDF]
(Submitted on 19 Oct 2023)
JHEP
Inspire 2712668
Tools
Abstract
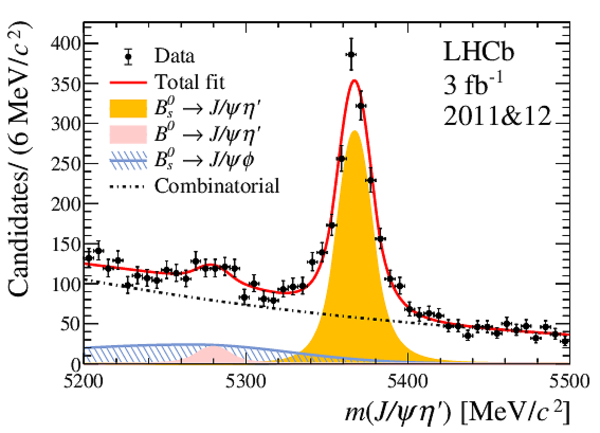
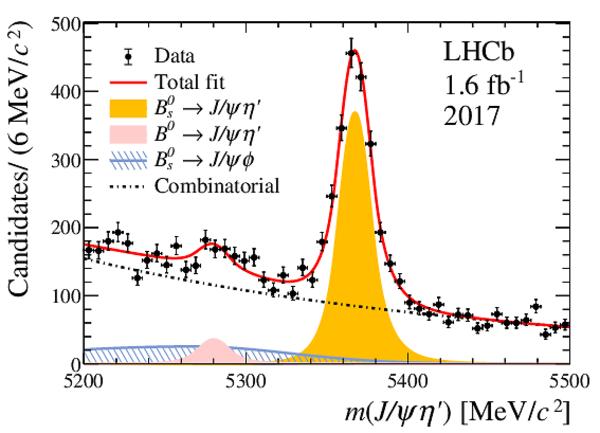
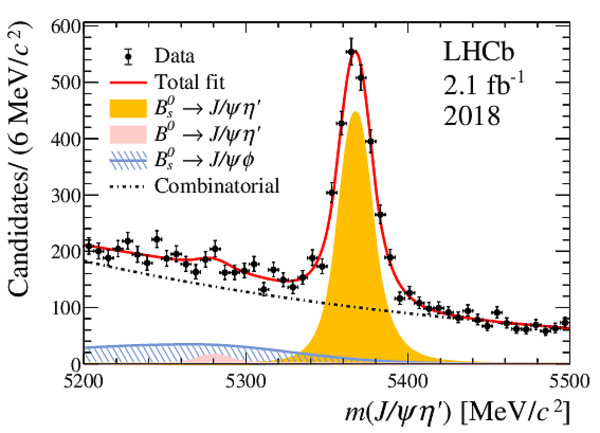
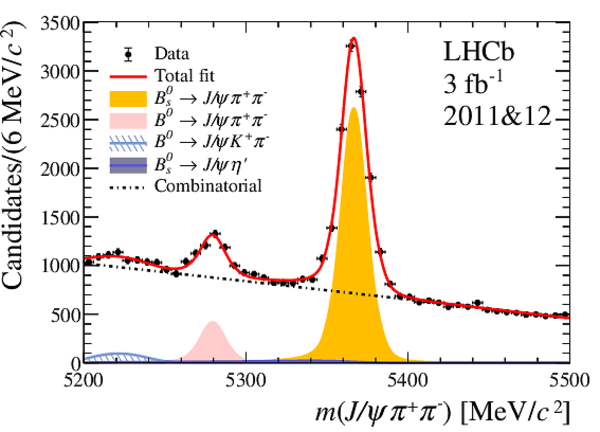
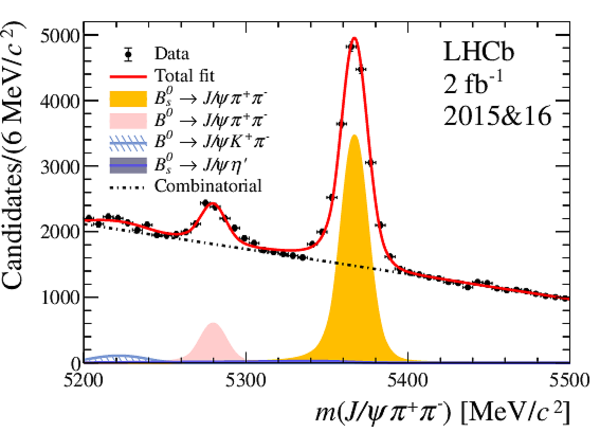
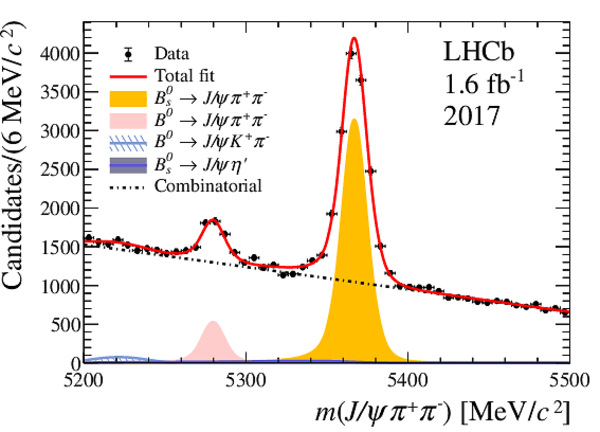
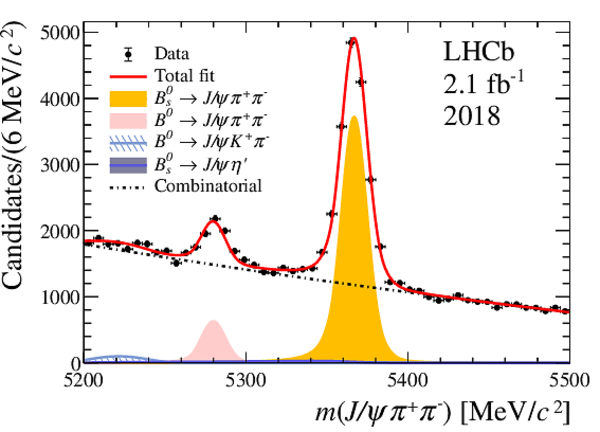
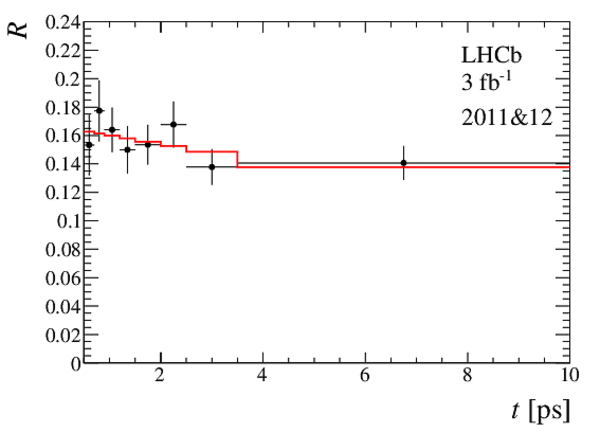
Using a dataset corresponding to $9 \mathrm{fb}^{-1}$ of integrated luminosity collected with the LHCb detector between 2011 and 2018 in proton-proton collisions, the decay-time distributions of the decay modes $B_s^0 \rightarrow J/\psi \eta'$ and $B_s^0 \rightarrow J/\psi \pi^{+} \pi^{-}$ are studied. The decay-width difference between the light and heavy mass eigenstates of the $B_s^0$ meson is measured to be $\Delta \Gamma_s = 0.087 \pm 0.012 \pm 0.009 \mathrm{ps}^{-1}$, where the first uncertainty is statistical and the second systematic.
Figures and captions


![HiDef png [345 KiB]](Directory_LHCb-PAPER-2023-025/hidef_fig1a.png)
![HiDef png [335 KiB]](Directory_LHCb-PAPER-2023-025/hidef_fig1b.png)
![HiDef png [329 KiB]](Directory_LHCb-PAPER-2023-025/hidef_fig1c.png)
![HiDef png [343 KiB]](Directory_LHCb-PAPER-2023-025/hidef_fig1d.png)
![HiDef png [301 KiB]](Directory_LHCb-PAPER-2023-025/hidef_fig2a.png)
![HiDef png [287 KiB]](Directory_LHCb-PAPER-2023-025/hidef_fig2b.png)
![HiDef png [301 KiB]](Directory_LHCb-PAPER-2023-025/hidef_fig2c.png)
![HiDef png [289 KiB]](Directory_LHCb-PAPER-2023-025/hidef_fig2d.png)
![HiDef png [104 KiB]](Directory_LHCb-PAPER-2023-025/hidef_fig3a.png)
![HiDef png [105 KiB]](Directory_LHCb-PAPER-2023-025/hidef_fig3b.png)
![HiDef png [100 KiB]](Directory_LHCb-PAPER-2023-025/hidef_fig3c.png)
![HiDef png [103 KiB]](Directory_LHCb-PAPER-2023-025/hidef_fig3d.png)
![HiDef png [72 KiB]](Directory_LHCb-PAPER-2023-025/hidef_fig4a.png)
Tables and captions
|
Decay-time binning scheme. |
Table_1.pdf [31 KiB] HiDef png [116 KiB] Thumbnail [48 KiB] tex code |

|
|
Values of $\Delta \Gamma_s$ and the $\chi^2$ probability obtained from the fits to $R$ for the four datasets. The uncertainties are statistical. |
Table_2.pdf [65 KiB] HiDef png [89 KiB] Thumbnail [38 KiB] tex code |

|
|
Systematic uncertainties on the measurement of $\Delta \Gamma_s$. |
Table_3.pdf [63 KiB] HiDef png [86 KiB] Thumbnail [39 KiB] tex code |

|
![HiDef png [116 KiB]](Directory_LHCb-PAPER-2023-025/hidef_Table_1.png)
![HiDef png [89 KiB]](Directory_LHCb-PAPER-2023-025/hidef_Table_2.png)
![HiDef png [86 KiB]](Directory_LHCb-PAPER-2023-025/hidef_Table_3.png)
Created on 27 April 2024.