A model-independent measurement of the CKM angle $\gamma$ in partially reconstructed $B^{\pm} \to D^{*} h^{\pm}$ decays with $D \to K_{S}^{0} h^{+}h^{-}$$(h=\pi, K)$
[to restricted-access page]Information
LHCb-PAPER-2023-029
CERN-EP-2023-241
arXiv:2311.10434 [PDF]
(Submitted on 17 Nov 2023)
JHEP 02 (2024) 118
Inspire 2724083
Tools
Abstract
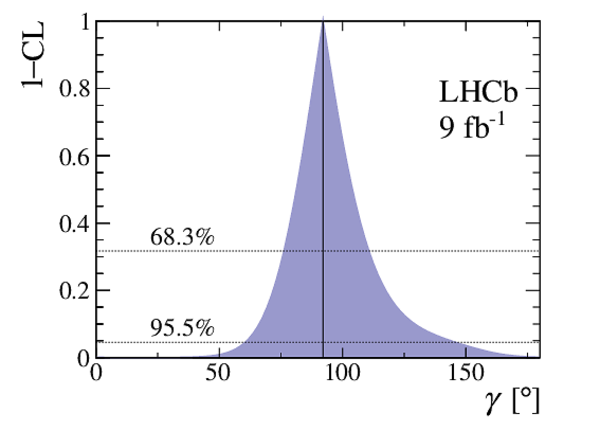
A measurement of $C P$-violating observables in $B^{\pm} \to D^{*} K^{\pm}$ and $B^{\pm} \to D^{*} \pi^{\pm}$ decays is made where the photon or neutral pion from the $D^{*} \to D\gamma$ or $D^{*} \to D\pi^{0}$ decay is not reconstructed. The $D$ meson is reconstructed in the self-conjugate decay modes, $D \to K_{S}^{0} \pi^{+} \pi^{-}$ or $D \to K_{S}^{0} K^{+} K^{-}$. The distribution of signal yields in the $D$ decay phase space is analysed in a model-independent way. The measurement uses a data sample collected in proton-proton collisions at centre-of-mass energies of 7, 8, and 13 TeV, corresponding to a total integrated luminosity of approximately 9 fb$^{-1}$. The $B^{\pm} \to D^{*} K^{\pm}$ and $B^{\pm} \to D^{*} \pi^{\pm}$ $C P$-violating observables are interpreted in terms of hadronic parameters and the CKM angle $\gamma$, resulting in a measurement of $\gamma = (92^{+21}_{-17})^{\circ}$. The total uncertainty includes the statistical and systematic uncertainties, and the uncertainty due to external strong-phase inputs.
Figures and captions
|
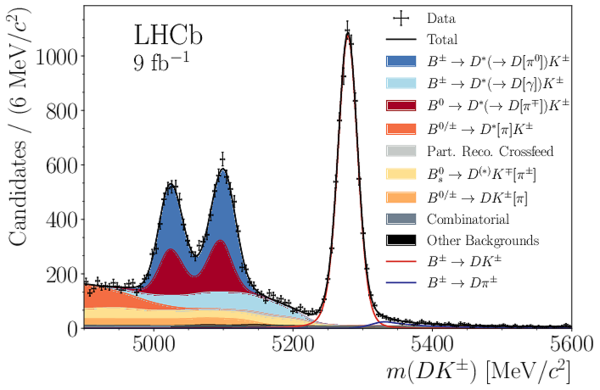
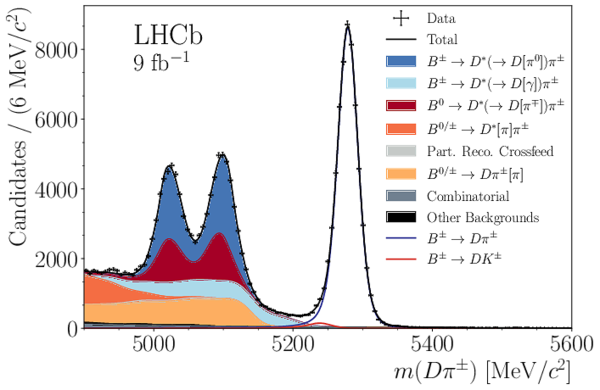
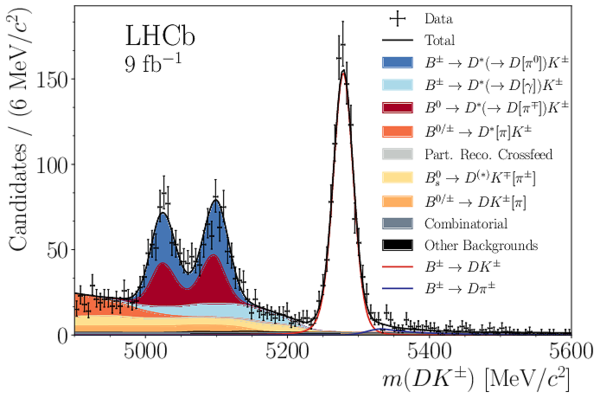
Mass distributions for (left) $ D K $ samples and (right) $ D \pi$ samples, with $ D \rightarrow K ^0_{\mathrm{S}} \pi ^+ \pi ^- $ decays reconstructed with a (top) downstream $ K ^0_{\mathrm{S}}$ candidate and a (bottom) long $ K ^0_{\mathrm{S}}$ candidate. The projections of the fit results are overlaid. In the legend, particles in square brackets are not reconstructed. |
Fig1a.pdf [196 KiB] HiDef png [360 KiB] Thumbnail [214 KiB] *.C file |
|
|
Fig1b.pdf [194 KiB] HiDef png [321 KiB] Thumbnail [190 KiB] *.C file |

|
|
|
Fig1c.pdf [195 KiB] HiDef png [382 KiB] Thumbnail [221 KiB] *.C file |

|
|
|
Fig1d.pdf [194 KiB] HiDef png [330 KiB] Thumbnail [196 KiB] *.C file |
|
|
|
Mass distributions for (left) $ D K $ samples and (right) $ D \pi$ samples, with $ D \rightarrow K ^0_{\mathrm{S}} K ^+ K ^- $ decays reconstructed with a (top) downstream $ K ^0_{\mathrm{S}}$ candidate and a (bottom) long $ K ^0_{\mathrm{S}}$ candidate. The projections of the fit results are overlaid. In the legend, particles in square brackets are not reconstructed. |
Fig2a.pdf [194 KiB] HiDef png [370 KiB] Thumbnail [218 KiB] *.C file |
|
|
Fig2b.pdf [194 KiB] HiDef png [336 KiB] Thumbnail [200 KiB] *.C file |

|
|
|
Fig2c.pdf [193 KiB] HiDef png [386 KiB] Thumbnail [231 KiB] *.C file |

|
|
|
Fig2d.pdf [193 KiB] HiDef png [340 KiB] Thumbnail [202 KiB] *.C file |

|
|
|
Contours at 68.3% and 95.5% confidence levels indicated by the darker and lighter regions, respectively, for (left, red) $(x_{-}^{ D ^* K }, y_{-}^{ D ^* K })$ which is labelled $ B ^- $ and (left, purple) $(x_{+}^{ D ^* K }, y_{+}^{ D ^* K })$ which is labelled $ B ^+ $, and (right) $(\Re(\xi^{ D ^* \pi}), \Im(\xi^{ D ^* \pi}))$, including only statistical uncertainty. The black points indicate the central values. |
Fig3.pdf [196 KiB] HiDef png [227 KiB] Thumbnail [117 KiB] *.C file |

|
|
Confidence intervals at 68.3% and 95.5% for the CKM angle $\gamma $ . |
Fig4.pdf [14 KiB] HiDef png [149 KiB] Thumbnail [115 KiB] *.C file |
|
|
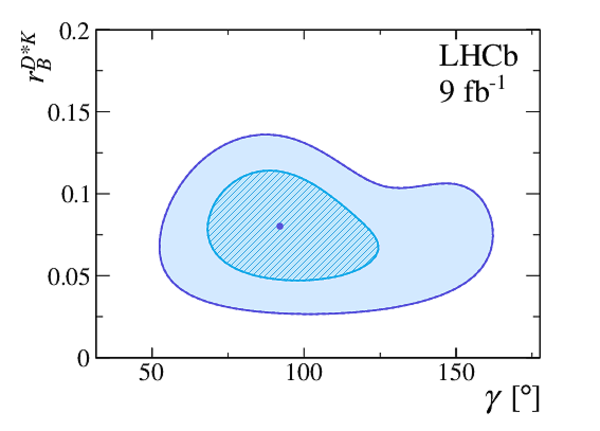
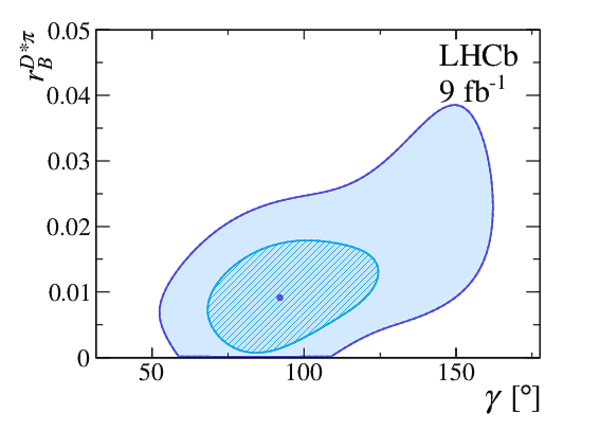
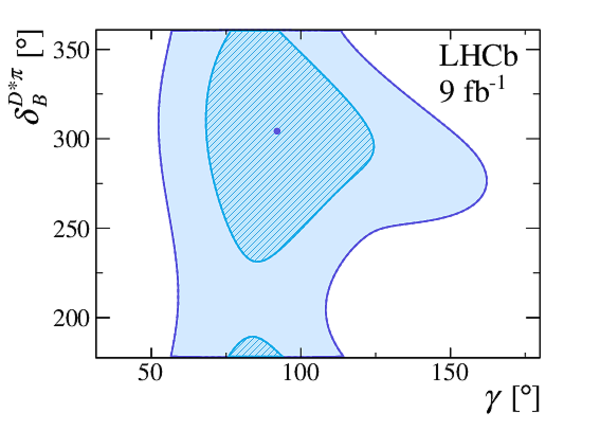
Confidence regions at 68.3% and 95.5% indicated by the lighter and darker shades respectively, for (top, left) $\gamma $ vs. $r_{B}^{ D ^* K }$, (top, right) $\gamma $ vs. $\delta_{B}^{ D ^* K }$, (bottom left) $\gamma $ vs. $r_{B}^{ D ^* \pi}$, and (bottom, right) $\gamma $ vs. $\delta_{B}^{ D ^* \pi}$. |
Fig5a.pdf [14 KiB] HiDef png [307 KiB] Thumbnail [184 KiB] *.C file |
|
|
Fig5b.pdf [14 KiB] HiDef png [294 KiB] Thumbnail [177 KiB] *.C file |

|
|
|
Fig5c.pdf [17 KiB] HiDef png [315 KiB] Thumbnail [194 KiB] *.C file |
|
|
|
Fig5d.pdf [19 KiB] HiDef png [469 KiB] Thumbnail [280 KiB] *.C file |
|
|
|
Animated gif made out of all figures. |
PAPER-2023-029.gif Thumbnail |

|
![HiDef png [360 KiB]](Directory_LHCb-PAPER-2023-029/hidef_Fig1a.png)
![HiDef png [321 KiB]](Directory_LHCb-PAPER-2023-029/hidef_Fig1b.png)
![HiDef png [382 KiB]](Directory_LHCb-PAPER-2023-029/hidef_Fig1c.png)
![HiDef png [330 KiB]](Directory_LHCb-PAPER-2023-029/hidef_Fig1d.png)
![HiDef png [370 KiB]](Directory_LHCb-PAPER-2023-029/hidef_Fig2a.png)
![HiDef png [336 KiB]](Directory_LHCb-PAPER-2023-029/hidef_Fig2b.png)
![HiDef png [386 KiB]](Directory_LHCb-PAPER-2023-029/hidef_Fig2c.png)
![HiDef png [340 KiB]](Directory_LHCb-PAPER-2023-029/hidef_Fig2d.png)
![HiDef png [227 KiB]](Directory_LHCb-PAPER-2023-029/hidef_Fig3.png)
![HiDef png [149 KiB]](Directory_LHCb-PAPER-2023-029/hidef_Fig4.png)
![HiDef png [307 KiB]](Directory_LHCb-PAPER-2023-029/hidef_Fig5a.png)
![HiDef png [294 KiB]](Directory_LHCb-PAPER-2023-029/hidef_Fig5b.png)
![HiDef png [315 KiB]](Directory_LHCb-PAPER-2023-029/hidef_Fig5c.png)
![HiDef png [469 KiB]](Directory_LHCb-PAPER-2023-029/hidef_Fig5d.png)
Tables and captions
|
Signal and background yields from the global fit over the full mass range, ${4900\textendash5600\text{ Me V /}c^2 }$. All yields and uncertainties are rounded to the nearest integer and uncertainties of 1 mean one or fewer. Backgrounds that are not written explicitly in this table are included in the `Other Backgrounds' component. |
Table_1.pdf [62 KiB] HiDef png [84 KiB] Thumbnail [36 KiB] tex code |

|
|
Summary of the systematic uncertainties. Values are expressed in units of $10 ^{-2}$. |
Table_2.pdf [80 KiB] HiDef png [124 KiB] Thumbnail [55 KiB] tex code |

|
|
Statistical correlation matrix for the $ C P$ -violating observables. |
Table_3.pdf [72 KiB] HiDef png [51 KiB] Thumbnail [24 KiB] tex code |

|
|
Correlation matrix associated with LHCb-related systematic uncertainties. |
Table_4.pdf [72 KiB] HiDef png [51 KiB] Thumbnail [23 KiB] tex code |

|
|
Correlation matrix associated with the strong-phase inputs. |
Table_5.pdf [72 KiB] HiDef png [51 KiB] Thumbnail [23 KiB] tex code |

|
![HiDef png [84 KiB]](Directory_LHCb-PAPER-2023-029/hidef_Table_1.png)
![HiDef png [124 KiB]](Directory_LHCb-PAPER-2023-029/hidef_Table_2.png)
![HiDef png [51 KiB]](Directory_LHCb-PAPER-2023-029/hidef_Table_3.png)
![HiDef png [51 KiB]](Directory_LHCb-PAPER-2023-029/hidef_Table_4.png)
![HiDef png [51 KiB]](Directory_LHCb-PAPER-2023-029/hidef_Table_5.png)
Created on 26 April 2024.