Information
LHCb-PAPER-2023-030
CERN-EP-2023-228
arXiv:2310.17326 [PDF]
(Submitted on 26 Oct 2023)
Phys. Rev. C 109 (2024) 024907
Inspire 2714583
Tools
Abstract
The production of $\eta$ and $\eta'$ mesons is studied in proton-proton and proton-lead collisions collected with the LHCb detector. Proton-proton collisions are studied at center-of-mass energies of $5.02$ and $13 {\rm TeV}$, and proton-lead collisions are studied at a center-of-mass energy per nucleon of $8.16 {\rm TeV}$. The studies are performed in center-of-mass rapidity regions $2.5<y_{\rm c.m.}<3.5$ (forward rapidity) and $-4.0<y_{\rm c.m.}<-3.0$ (backward rapidity) defined relative to the proton beam direction. The $\eta$ and $\eta'$ production cross sections are measured differentially as a function of transverse momentum for $1.5<p_{\rm T}<10 {\rm GeV}$ and $3<p_{\rm T}<10 {\rm GeV}$, respectively. The differential cross sections are used to calculate nuclear modification factors. The nuclear modification factors for $\eta$ and $\eta'$ mesons agree at both forward and backward rapidity, showing no significant evidence of mass dependence. The differential cross sections of $\eta$ mesons are also used to calculate $\eta/\pi^0$ cross section ratios, which show evidence of a deviation from the world average. These studies offer new constraints on mass-dependent nuclear effects in heavy-ion collisions, as well as $\eta$ and $\eta'$ meson fragmentation.
Figures and captions
|
Example reconstructed $M(\gamma\gamma)$ distributions in forward $p{\rm Pb}$ collisions at $\sqrt{s_{\rm NN}}=8.16 {\rm TeV}$ with $2.5<y_{\rm c.m.}<3.5$. Distributions are shown for (left) $1.5<p_{\rm T}<1.6\text{ Ge V} {}$ and (right) $3.0<p_{\rm T}<3.2\text{ Ge V} {}$. Fit results are overlaid, including the mixed event and correlated combinatorial background templates. The lower panels show the background-subtracted mass distributions with the fit results overlaid. |
Fig1a.pdf [103 KiB] HiDef png [236 KiB] Thumbnail [178 KiB] *.C file |

|
|
Fig1b.pdf [103 KiB] HiDef png [236 KiB] Thumbnail [179 KiB] *.C file |

|
|
|
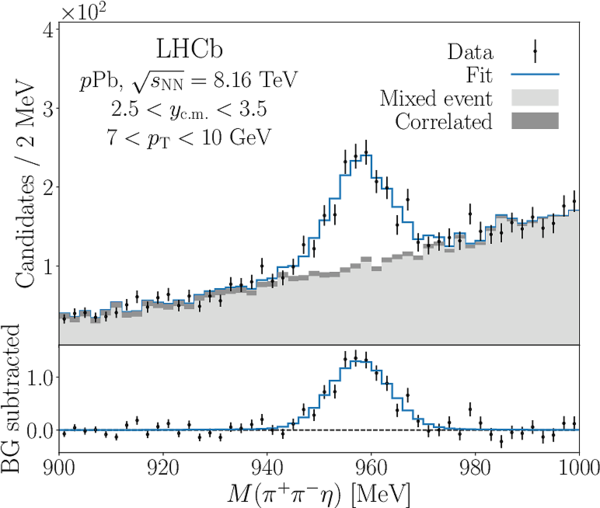
Example reconstructed $M(\pi^+\pi^-\eta)$ distributions in forward $p{\rm Pb}$ collisions at $\sqrt{s_{\rm NN}}=8.16 {\rm TeV}$ with $2.5<y_{\rm c.m.}<3.5$. Distributions are shown for (left) $3<p_{\rm T}<4\text{ Ge V} {}$ and (right) $7<p_{\rm T}<10\text{ Ge V} {}$. Fit results are overlaid, including the mixed event and correlated combinatorial background templates. The lower panels show the background-subtracted mass distributions with the fit results overlaid. |
Fig2a.pdf [103 KiB] HiDef png [236 KiB] Thumbnail [187 KiB] *.C file |

|
|
Fig2b.pdf [103 KiB] HiDef png [260 KiB] Thumbnail [209 KiB] *.C file |
|
|
|
Measured $\eta$ and $\eta'$ differential cross sections in the (left) backward and (right) forward regions. The $pp$ cross sections are scaled by the atomic mass of the lead ion, $A=208$. The $\eta'$ cross sections are scaled down by a factor of $10$ for visual clarity. Statistical uncertainties are shown as error bars, while systematic uncertainties are shown as error boxes. |
Fig3a.pdf [135 KiB] HiDef png [278 KiB] Thumbnail [222 KiB] *.C file |

|
|
Fig3b.pdf [135 KiB] HiDef png [272 KiB] Thumbnail [218 KiB] *.C file |

|
|
|
Measured $\eta$ and $\eta'$ nuclear modification factors in the (top) backward and (bottom) forward regions. Error bars show the statistical uncertainties, while the boxes show the systematic uncertainties except for the uncertainty associated with the luminosity, which is fully correlated between measurements. The luminosity uncertainty is shown as a dark gray shaded box. The $\eta$ and $\eta'$ results are compared to the $\pi^0$ data from Ref. [19]. |
Fig4a.pdf [132 KiB] HiDef png [205 KiB] Thumbnail [145 KiB] *.C file |

|
|
Fig4b.pdf [132 KiB] HiDef png [186 KiB] Thumbnail [132 KiB] *.C file |

|
|
|
Measured $R^{\eta'}_{p{\rm Pb}}/R^{\eta}_{p{\rm Pb}}$ in the (left) backward and (right) forward regions. Error bars show the statistical uncertainties, while the boxes show the systematic uncertainties. The systematic uncertainties are approximately fully correlated in $p_{\rm T}$. The results are compared to predictions from EPOS4 with and without QGP-like effects. The shaded and hatched regions show the statistical 68% confidence-level regions of the predictions. |
Fig5a.pdf [98 KiB] HiDef png [282 KiB] Thumbnail [202 KiB] *.C file |

|
|
Fig5b.pdf [98 KiB] HiDef png [266 KiB] Thumbnail [195 KiB] *.C file |

|
|
|
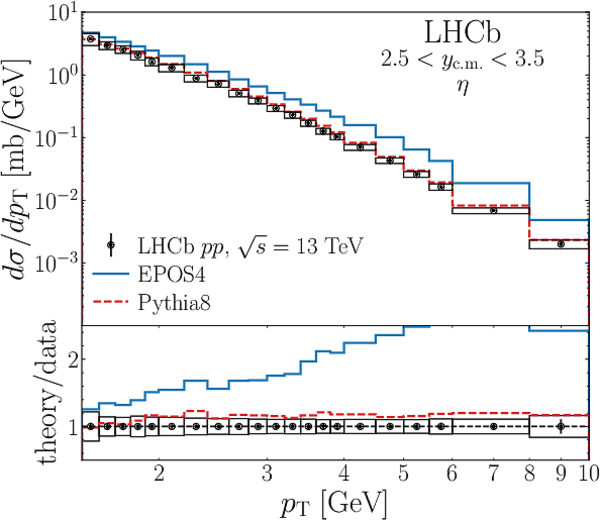
Measured $\eta$ differential cross sections in the (left) backward and (right) forward regions. Results are shown for $pp$ collisions at (top) $\sqrt{s}=5.02$ and (middle) $13 {\rm TeV}$ and (bottom) for $p{\rm Pb}$ collisions at $\sqrt{s_{\rm NN}}=8.16 {\rm TeV}$. Results are compared to predictions from EPOS4 and Pythia {}8. The lower panels show the ratios of the predictions to the measured results. The statistical uncertainties are shown by error bars, while systematic uncertainties are shown by boxes. |
Fig6a.pdf [133 KiB] HiDef png [256 KiB] Thumbnail [215 KiB] *.C file |

|
|
Fig6b.pdf [133 KiB] HiDef png [257 KiB] Thumbnail [209 KiB] *.C file |

|
|
|
Fig6c.pdf [133 KiB] HiDef png [253 KiB] Thumbnail [220 KiB] *.C file |

|
|
|
Fig6d.pdf [133 KiB] HiDef png [252 KiB] Thumbnail [213 KiB] *.C file |
|
|
|
Fig6e.pdf [133 KiB] HiDef png [262 KiB] Thumbnail [215 KiB] *.C file |

|
|
|
Fig6f.pdf [133 KiB] HiDef png [272 KiB] Thumbnail [218 KiB] *.C file |

|
|
|
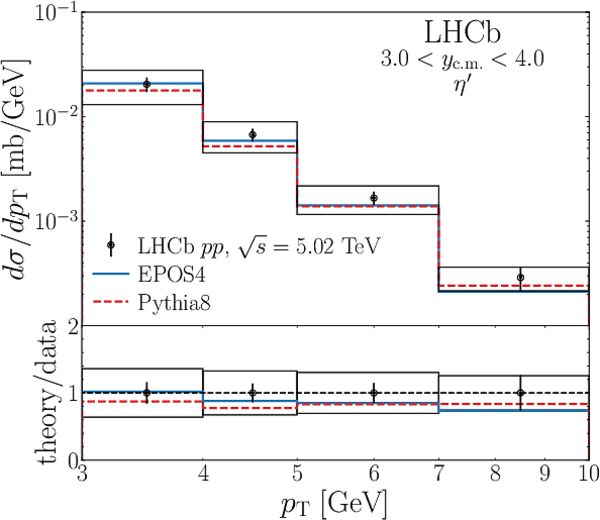
Measured $\eta'$ differential cross sections in the (left) backward and (right) forward regions. Results are shown for $pp$ collisions at (top) $\sqrt{s}=5.02$ and (middle) $13 {\rm TeV}$ and (bottom) for $p{\rm Pb}$ collisions at $\sqrt{s_{\rm NN}}=8.16 {\rm TeV}$. Results are compared to predictions from EPOS4 and Pythia {}8. The lower panels show the ratios of the predictions to the measured results. The statistical uncertainties are shown by error bars, while systematic uncertainties are shown by boxes. |
Fig7a.pdf [130 KiB] HiDef png [199 KiB] Thumbnail [173 KiB] *.C file |
|
|
Fig7b.pdf [130 KiB] HiDef png [200 KiB] Thumbnail [173 KiB] *.C file |

|
|
|
Fig7c.pdf [130 KiB] HiDef png [200 KiB] Thumbnail [165 KiB] *.C file |

|
|
|
Fig7d.pdf [130 KiB] HiDef png [197 KiB] Thumbnail [166 KiB] *.C file |

|
|
|
Fig7e.pdf [130 KiB] HiDef png [199 KiB] Thumbnail [169 KiB] *.C file |

|
|
|
Fig7f.pdf [130 KiB] HiDef png [200 KiB] Thumbnail [169 KiB] *.C file |

|
|
|
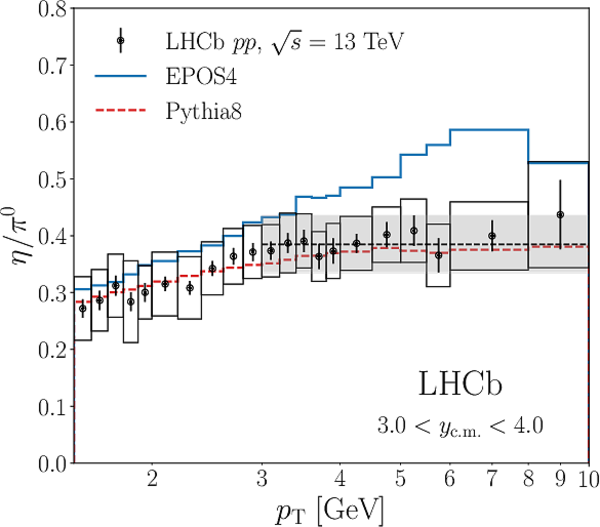
Measured $\eta/\pi^0$ cross section ratios in the (left) backward and (right) forward regions. Results are shown for $pp$ collisions at (top) $\sqrt{s}=5.02$ and (middle) $13 {\rm TeV}$ and (bottom) for $p{\rm Pb}$ collisions at $\sqrt{s_{\rm NN}}=8.16 {\rm TeV}$. Results are compared to predictions from EPOS4 and Pythia {}8. The statistical uncertainties are shown by error bars, while systematic uncertainties are shown by boxes. The systematic uncertainties are approximately fully correlated between $p_{\rm T}$ regions. The black dashed line and the gray shaded region show the central value of $C^{\eta/\pi^0}$ and its uncertainty, respectively, where $C^{\eta/\pi^0}$ is calculated for $p_{\rm T}>3\text{ Ge V} {}$. |
Fig8a.pdf [131 KiB] HiDef png [196 KiB] Thumbnail [174 KiB] *.C file |

|
|
Fig8b.pdf [131 KiB] HiDef png [200 KiB] Thumbnail [172 KiB] *.C file |

|
|
|
Fig8c.pdf [131 KiB] HiDef png [201 KiB] Thumbnail [173 KiB] *.C file |
|
|
|
Fig8d.pdf [131 KiB] HiDef png [199 KiB] Thumbnail [173 KiB] *.C file |

|
|
|
Fig8e.pdf [131 KiB] HiDef png [195 KiB] Thumbnail [174 KiB] *.C file |

|
|
|
Fig8f.pdf [131 KiB] HiDef png [197 KiB] Thumbnail [174 KiB] *.C file |

|
|
|
Animated gif made out of all figures. |
PAPER-2023-030.gif Thumbnail |

|
![HiDef png [236 KiB]](Directory_LHCb-PAPER-2023-030/hidef_Fig1a.png)
![HiDef png [236 KiB]](Directory_LHCb-PAPER-2023-030/hidef_Fig1b.png)
![HiDef png [236 KiB]](Directory_LHCb-PAPER-2023-030/hidef_Fig2a.png)
![HiDef png [260 KiB]](Directory_LHCb-PAPER-2023-030/hidef_Fig2b.png)
![HiDef png [278 KiB]](Directory_LHCb-PAPER-2023-030/hidef_Fig3a.png)
![HiDef png [272 KiB]](Directory_LHCb-PAPER-2023-030/hidef_Fig3b.png)
![HiDef png [205 KiB]](Directory_LHCb-PAPER-2023-030/hidef_Fig4a.png)
![HiDef png [186 KiB]](Directory_LHCb-PAPER-2023-030/hidef_Fig4b.png)
![HiDef png [282 KiB]](Directory_LHCb-PAPER-2023-030/hidef_Fig5a.png)
![HiDef png [266 KiB]](Directory_LHCb-PAPER-2023-030/hidef_Fig5b.png)
![HiDef png [256 KiB]](Directory_LHCb-PAPER-2023-030/hidef_Fig6a.png)
![HiDef png [257 KiB]](Directory_LHCb-PAPER-2023-030/hidef_Fig6b.png)
![HiDef png [253 KiB]](Directory_LHCb-PAPER-2023-030/hidef_Fig6c.png)
![HiDef png [252 KiB]](Directory_LHCb-PAPER-2023-030/hidef_Fig6d.png)
![HiDef png [262 KiB]](Directory_LHCb-PAPER-2023-030/hidef_Fig6e.png)
![HiDef png [272 KiB]](Directory_LHCb-PAPER-2023-030/hidef_Fig6f.png)
![HiDef png [199 KiB]](Directory_LHCb-PAPER-2023-030/hidef_Fig7a.png)
![HiDef png [200 KiB]](Directory_LHCb-PAPER-2023-030/hidef_Fig7b.png)
![HiDef png [200 KiB]](Directory_LHCb-PAPER-2023-030/hidef_Fig7c.png)
![HiDef png [197 KiB]](Directory_LHCb-PAPER-2023-030/hidef_Fig7d.png)
![HiDef png [199 KiB]](Directory_LHCb-PAPER-2023-030/hidef_Fig7e.png)
![HiDef png [200 KiB]](Directory_LHCb-PAPER-2023-030/hidef_Fig7f.png)
![HiDef png [196 KiB]](Directory_LHCb-PAPER-2023-030/hidef_Fig8a.png)
![HiDef png [200 KiB]](Directory_LHCb-PAPER-2023-030/hidef_Fig8b.png)
![HiDef png [201 KiB]](Directory_LHCb-PAPER-2023-030/hidef_Fig8c.png)
![HiDef png [199 KiB]](Directory_LHCb-PAPER-2023-030/hidef_Fig8d.png)
![HiDef png [195 KiB]](Directory_LHCb-PAPER-2023-030/hidef_Fig8e.png)
![HiDef png [197 KiB]](Directory_LHCb-PAPER-2023-030/hidef_Fig8f.png)
Tables and captions
|
Relative systematic and statistical uncertainties in $d\sigma^{\eta}/dp_{\rm T}$, $R^{\eta}_{p{\rm Pb}}$, $d\sigma^{\eta'}/dp_{\rm T}$, and $R^{\eta'}_{p{\rm Pb}}$, where the superscript denotes the hadron species. The uncertainties are reported in percent, and the ranges correspond to the minimum and maximum values of the associated uncertainties across all $p_{\rm T}$ intervals, $y_{\rm c.m.}$ regions, and data sets. All sources of systematic uncertainty are approximately fully correlated across $p_{\rm T}$ intervals. |
Table_1.pdf [64 KiB] HiDef png [100 KiB] Thumbnail [49 KiB] tex code |

|
|
Measured $C^{\eta/\pi^0}$ for each data set and rapidity region. The first uncertainty is statistical and the second is systematic. The systematic uncertainties are approximately 90% positively correlated between data sets. |
Table_2.pdf [55 KiB] HiDef png [50 KiB] Thumbnail [26 KiB] tex code |

|
|
Measured $d\sigma/dp_{\rm T}$ of $\eta$ production in $pp$ collisions at $\sqrt{s}=5.02 {\rm TeV}$. Results and uncertainties are given in ${\rm mb/GeV}$. The first uncertainty is statistical and the second is systematic. The statistical uncertainty is uncorrelated between $p_{\rm T}$ intervals, while the systematic uncertainty is approximately fully correlated. |
Table_3.pdf [64 KiB] HiDef png [241 KiB] Thumbnail [100 KiB] tex code |

|
|
Measured $d\sigma/dp_{\rm T}$ of $\eta$ production in $pp$ collisions at $\sqrt{s}=13 {\rm TeV}$. Results and uncertainties are given in ${\rm mb/GeV}$. The first uncertainty is statistical and the second is systematic. The statistical uncertainty is uncorrelated between $p_{\rm T}$ intervals, while the systematic uncertainty is approximately fully correlated. |
Table_4.pdf [64 KiB] HiDef png [230 KiB] Thumbnail [93 KiB] tex code |

|
|
Measured $d\sigma/dp_{\rm T}$ of $\eta$ production in $p{\rm Pb}$ collisions at $\sqrt{s_{\rm NN}}=8.16 {\rm TeV}$. Results and uncertainties are given in ${\rm mb/GeV}$. The first uncertainty is statistical and the second is systematic. The statistical uncertainty is uncorrelated between $p_{\rm T}$ intervals, while the systematic uncertainty is approximately fully correlated. |
Table_5.pdf [57 KiB] HiDef png [201 KiB] Thumbnail [118 KiB] tex code |

|
|
Measured $d\sigma/dp_{\rm T}$ of $\eta'$ production in $pp$ collisions at $\sqrt{s}=5.02 {\rm TeV}$. Results and uncertainties are given in ${\rm mb/GeV}$. The first uncertainty is statistical and the second is systematic. The statistical uncertainty is uncorrelated between $p_{\rm T}$ bins, while the systematic uncertainty is approximately fully correlated. |
Table_6.pdf [63 KiB] HiDef png [54 KiB] Thumbnail [28 KiB] tex code |

|
|
Measured $d\sigma/dp_{\rm T}$ of $\eta'$ production in $pp$ collisions at $\sqrt{s}=13 {\rm TeV}$. Results and uncertainties are given in ${\rm mb/GeV}$. The first uncertainty is statistical and the second is systematic. The statistical uncertainty is uncorrelated between $p_{\rm T}$ bins, while the systematic uncertainty is approximately fully correlated. |
Table_7.pdf [63 KiB] HiDef png [50 KiB] Thumbnail [26 KiB] tex code |

|
|
Measured $d\sigma/dp_{\rm T}$ of $\eta'$ production in $p{\rm Pb}$ collisions at $\sqrt{s_{\rm NN}}=8.16 {\rm TeV}$. Results and uncertainties are given in ${\rm mb/GeV}$. The first uncertainty is statistical and the second is systematic. The statistical uncertainty is uncorrelated between $p_{\rm T}$ bins, while the systematic uncertainty is approximately fully correlated. |
Table_8.pdf [56 KiB] HiDef png [52 KiB] Thumbnail [28 KiB] tex code |

|
|
Measured $\eta/\pi^0$ cross section ratio for $2.5<y_{\rm c.m.}<3.5$. The first uncertainty is statistical and the second is systematic. The statistical uncertainty is uncorrelated between $p_{\rm T}$ bins, while the systematic uncertainty is approximately fully correlated. |
Table_9.pdf [49 KiB] HiDef png [249 KiB] Thumbnail [121 KiB] tex code |

|
|
Measured $\eta/\pi^0$ cross section ratio for $-4.0<y_{\rm c.m.}<-3.0$. The first uncertainty is statistical and the second is systematic. The statistical uncertainty is uncorrelated between $p_{\rm T}$ bins, while the systematic uncertainty is approximately fully correlated. |
Table_10.pdf [49 KiB] HiDef png [249 KiB] Thumbnail [122 KiB] tex code |

|
|
Measured $\eta$ nuclear modification factor $R_{p{\rm Pb}}$ as a function of $p_{\rm T}$. The first uncertainty is statistical and the second is systematic. The statistical uncertainty is uncorrelated between $p_{\rm T}$ bins, while the systematic uncertainty is approximately fully correlated. |
Table_11.pdf [56 KiB] HiDef png [273 KiB] Thumbnail [152 KiB] tex code |

|
|
Measured $\eta'$ nuclear modification factor $R_{p{\rm Pb}}$ as a function of $p_{\rm T}$. The first uncertainty is statistical and the second is systematic. The statistical uncertainty is uncorrelated between $p_{\rm T}$ bins, while the systematic uncertainty is approximately fully correlated. |
Table_12.pdf [56 KiB] HiDef png [59 KiB] Thumbnail [32 KiB] tex code |

|
![HiDef png [100 KiB]](Directory_LHCb-PAPER-2023-030/hidef_Table_1.png)
![HiDef png [50 KiB]](Directory_LHCb-PAPER-2023-030/hidef_Table_2.png)
![HiDef png [241 KiB]](Directory_LHCb-PAPER-2023-030/hidef_Table_3.png)
![HiDef png [230 KiB]](Directory_LHCb-PAPER-2023-030/hidef_Table_4.png)
![HiDef png [201 KiB]](Directory_LHCb-PAPER-2023-030/hidef_Table_5.png)
![HiDef png [54 KiB]](Directory_LHCb-PAPER-2023-030/hidef_Table_6.png)
![HiDef png [50 KiB]](Directory_LHCb-PAPER-2023-030/hidef_Table_7.png)
![HiDef png [52 KiB]](Directory_LHCb-PAPER-2023-030/hidef_Table_8.png)
![HiDef png [249 KiB]](Directory_LHCb-PAPER-2023-030/hidef_Table_9.png)
![HiDef png [249 KiB]](Directory_LHCb-PAPER-2023-030/hidef_Table_10.png)
![HiDef png [273 KiB]](Directory_LHCb-PAPER-2023-030/hidef_Table_11.png)
![HiDef png [59 KiB]](Directory_LHCb-PAPER-2023-030/hidef_Table_12.png)
Created on 27 April 2024.