Measurement of forward charged hadron flow harmonics in peripheral PbPb collisions at $\sqrt{s_{NN}}= 5.02$ TeV with the LHCb detector
[to restricted-access page]Information
LHCb-PAPER-2023-031
CERN-EP-2023-240
arXiv:2311.09985 [PDF]
(Submitted on 16 Nov 2023)
Phys. Rev. C
Inspire 2723367
Tools
Abstract
Flow harmonic coefficients, $v_n$, which are the key to studying the hydrodynamics of the quark-gluon plasma (QGP) created in heavy-ion collisions, have been measured in various collision systems, kinematic regions, and using various particle species. The study of flow harmonics in a wide pseudorapidity range is particularly valuable to understand the temperature dependence of the shear viscosity to entropy density ratio of the QGP. This paper presents the first LHCb results of the second- and the third-order flow harmonic coefficients of charged hadrons as a function of transverse momentum in the forward region, corresponding to pseudorapidities between 2.0 and 4.9, using the data collected from PbPb collisions in 2018 at a center-of-mass energy of $5.02$ TeV. The coefficients measured using the two-particle angular correlation analysis method are smaller than the central-pseudorapidity measurements at ALICE and ATLAS from the same collision system but share similar features.
Figures and captions
|
Angular correlation functions in four example intervals of transverse momentum and centrality. The $\Delta\eta$ range is limited to $\pm2.5$. The $z$-axis is cropped to visualize the ridge structures. |
paper_[..].pdf [238 KiB] HiDef png [1 MiB] Thumbnail [913 KiB] *.C file |

|
|
Azimuthal correlation functions in different transverse momentum and centrality ranges. The Fourier series fit and its three terms are overlaid. Only statistical uncertainties are shown. |
paper_[..].pdf [34 KiB] HiDef png [370 KiB] Thumbnail [281 KiB] *.C file |

|
|
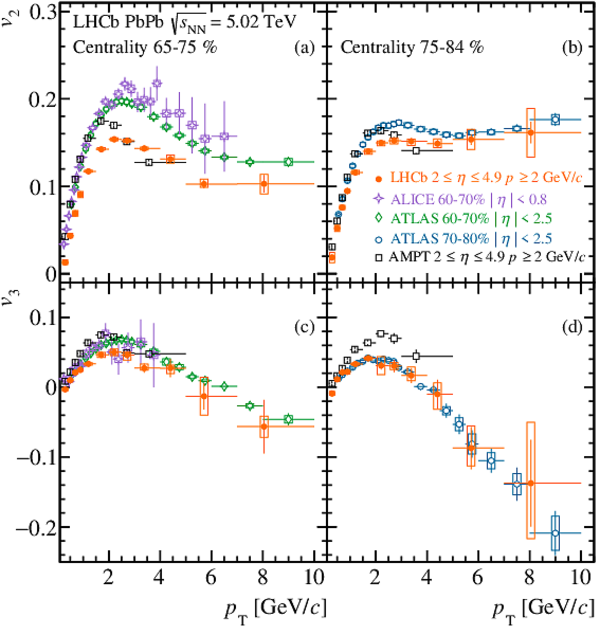
Second- and third-order flow harmonic coefficients as functions of transverse momentum. The statistical and systematic uncertainties are drawn as error bars and boxes, respectively. Only statistical uncertainties are shown for the AMPT predictions. |
vnPtPaper.pdf [31 KiB] HiDef png [471 KiB] Thumbnail [311 KiB] *.C file |
|
|
Animated gif made out of all figures. |
PAPER-2023-031.gif Thumbnail |

|
![HiDef png [1 MiB]](Directory_LHCb-PAPER-2023-031/hidef_paper_corr2D.png)
![HiDef png [370 KiB]](Directory_LHCb-PAPER-2023-031/hidef_paper_corr_pt.png)
![HiDef png [471 KiB]](Directory_LHCb-PAPER-2023-031/hidef_vnPtPaper.png)
Tables and captions
|
Summary of relative systematic uncertainties. |
Table_1.pdf [55 KiB] HiDef png [159 KiB] Thumbnail [75 KiB] tex code |

|
|
Numerical values of the harmonic coefficient $v_2(p_T)$. The lower and upper uncertainties are denoted as $\sigma^-$ and $\sigma^+$, respectively. |
Table_2.pdf [60 KiB] HiDef png [134 KiB] Thumbnail [60 KiB] tex code |

|
|
Numerical values of the harmonic coefficient $v_3(p_T)$. The lower and upper uncertainties are denoted as $\sigma^-$ and $\sigma^+$, respectively. |
Table_3.pdf [61 KiB] HiDef png [119 KiB] Thumbnail [55 KiB] tex code |

|
![HiDef png [159 KiB]](Directory_LHCb-PAPER-2023-031/hidef_Table_1.png)
![HiDef png [134 KiB]](Directory_LHCb-PAPER-2023-031/hidef_Table_2.png)
![HiDef png [119 KiB]](Directory_LHCb-PAPER-2023-031/hidef_Table_3.png)
Created on 27 April 2024.