Information
LHCb-PAPER-2023-033
CERN-EP-2023-273
arXiv:2312.09115 [PDF]
(Submitted on 14 Dec 2023)
Phys. Rev. Lett. 132 (2024) 131801
Inspire 2737292
Tools
Abstract
An amplitude analysis of the $B^{0}\to K^{*0}\mu^+\mu^-$ decay is presented using a dataset corresponding to an integrated luminosity of $4.7$ fb$^{-1}$ of $pp$ collision data collected with the LHCb experiment. For the first time, the coefficients associated to short-distance physics effects, sensitive to processes beyond the Standard Model, are extracted directly from the data through a $q^2$-unbinned amplitude analysis, where $q^2$ is the $\mu^+\mu^-$ invariant mass squared. Long-distance contributions, which originate from non-factorisable QCD processes, are systematically investigated and the most accurate assessment to date of their impact on the physical observables is obtained. The pattern of measured corrections to the short-distance couplings is found to be consistent with previous analyses of $b$- to $s$-quark transitions, with the largest discrepancy from the Standard Model predictions found to be at the level of 1.8 standard deviations. The global significance of the observed differences in the decay is 1.4 standard deviations.
Figures and captions
|
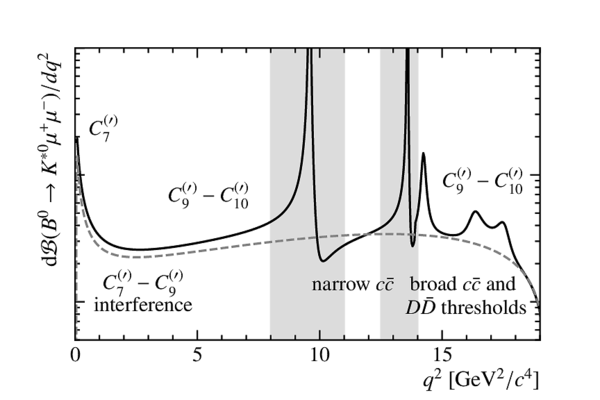
Illustration of the $q^2$ spectrum in $B^0\rightarrow K^{*0}\mu ^+\mu ^- $ decays. The dashed line corresponds to the pure rare semileptonic decay, while the solid line includes the impact of different charmonium resonances. The gray bands correspond to the regions dominated by $B^0\rightarrow { J \mskip -3mu/\mskip -2mu\psi } K^{*0}$ and $B^0\rightarrow \psi {(2S)} K^{*0}$ tree-level decays. Magnitudes and phases of $c\bar{c}$ resonant components have been arbitrarily chosen for illustrative purposes. The dominant Wilson coefficients in each region of the spectrum are also highlighted for reference. |
Fig1.pdf [16 KiB] HiDef png [136 KiB] Thumbnail [68 KiB] *.C file |
|
|
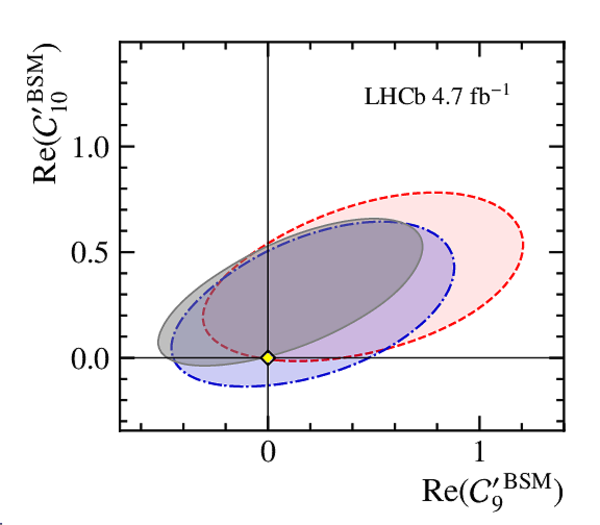
Two-dimensional profile-likelihood contours of the (left) $\mathcal{C}_9^{\mathrm{BSM}}$--$\mathcal{C}_{10}^{\mathrm{BSM}}$ and (right) $\mathcal{C}_9^{\prime \mathrm{BSM}}$--$\mathcal{C}_{10}^{\prime \mathrm{BSM}}$ pairs of Wilson coefficients at $68\%$ confidence level with (blue) and without (red) SM constraints at $q^{2}<0$. The fit is also repeated considering local FFs to be fixed to their SM predictions (grey) [16,25,31]. |
Fig2a.pdf [133 KiB] HiDef png [253 KiB] Thumbnail [181 KiB] *.C file |

|
|
Fig2b.pdf [86 KiB] HiDef png [243 KiB] Thumbnail [152 KiB] *.C file |
|
|
|
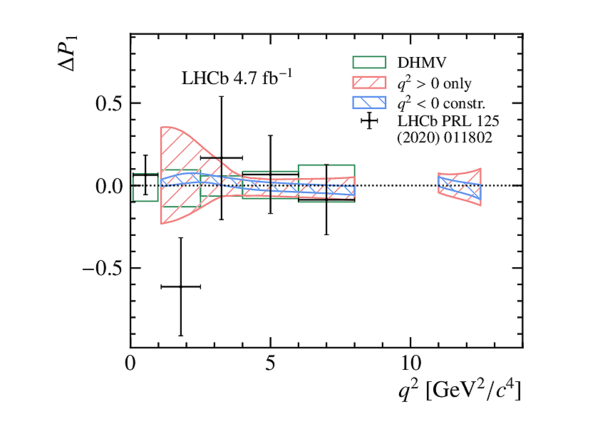
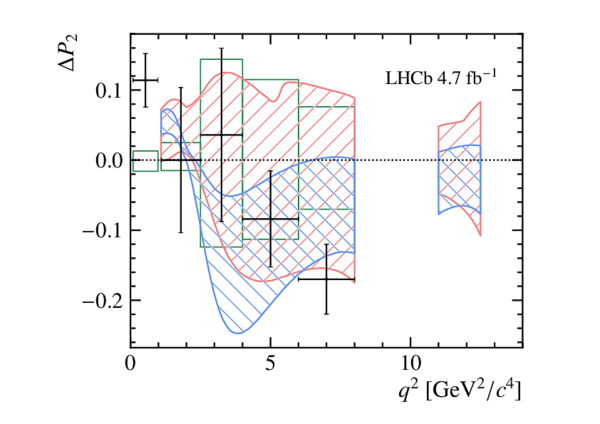
Determination of the (top) $P^{\prime}_{5}$ and (bottom) $S_7$ angular observables obtained from the amplitude fit. Results are shown for fits with (blue) and without (red) constraints from $q^{2} < 0$, at 68% confidence level. The LHCb binned angular analysis [10] (black dots) and SM predictions from DHMV [33,68] (green) and GRvDV [16,25,31] (yellow) are overlaid for reference. The center panel shows the non-local contributions to $P^{\prime}_{5}$ determined from the amplitude fit. Here the difference between the LHCb binned angular analysis [10] and SM central value from DHMV is overlaid for reference (black dots), together with the uncertainty on the DHMV SM prediction (green) and difference between the SM predictions from GRvDV and DHMV (yellow). Theoretical predictions are shown only for $q^2 < 8\text{ Ge V} ^2 /c^4 $. |
Fig3.pdf [154 KiB] HiDef png [692 KiB] Thumbnail [411 KiB] *.C file |

|
|
Non-local contributions to the angular observables (P-basis) obtained from data fits with (blue) and without (red) constraints from $q^{2} < 0$. The shaded regions are shown at 68% confidence level. When available, the difference between the LHCb binned angular analysis [10] and SM central-value from Refs. [33,68] is overlaid for reference (black dots), together with the uncertainty on the SM prediction (green). |
Fig4a.pdf [141 KiB] HiDef png [201 KiB] Thumbnail [127 KiB] *.C file |
|
|
Fig4b.pdf [141 KiB] HiDef png [363 KiB] Thumbnail [199 KiB] *.C file |
|
|
|
Fig4c.pdf [140 KiB] HiDef png [165 KiB] Thumbnail [95 KiB] *.C file |
|
|
|
Fig4d.pdf [141 KiB] HiDef png [197 KiB] Thumbnail [120 KiB] *.C file |
|
|
|
Fig4e.pdf [141 KiB] HiDef png [239 KiB] Thumbnail [142 KiB] *.C file |
|
|
|
Fig4f.pdf [140 KiB] HiDef png [159 KiB] Thumbnail [97 KiB] *.C file |

|
|
|
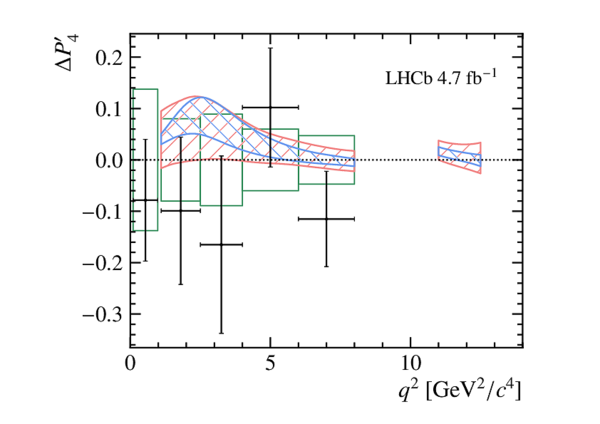
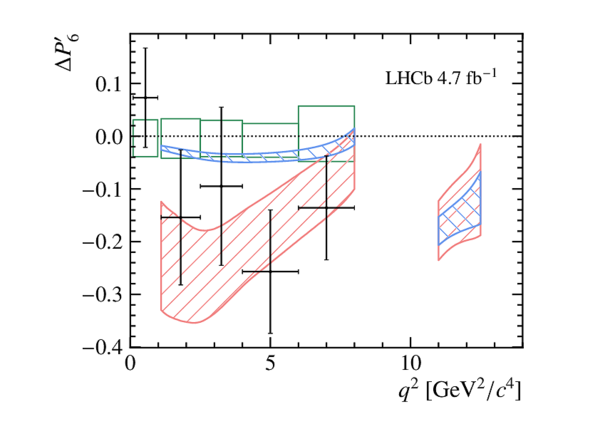
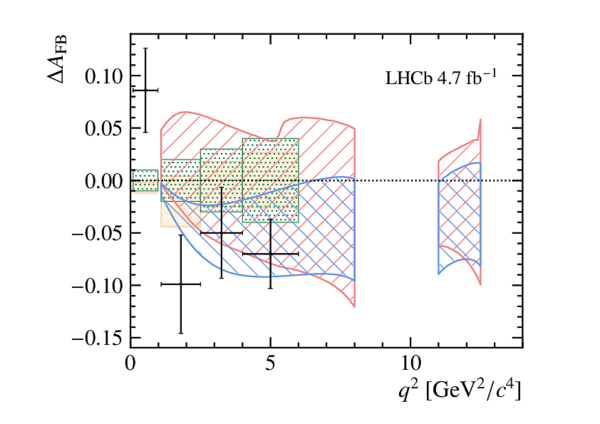
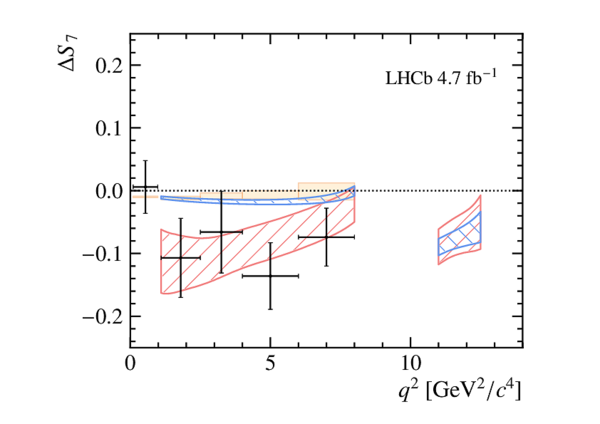
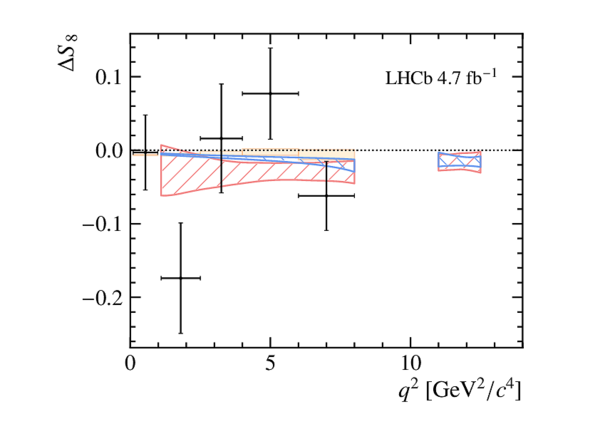
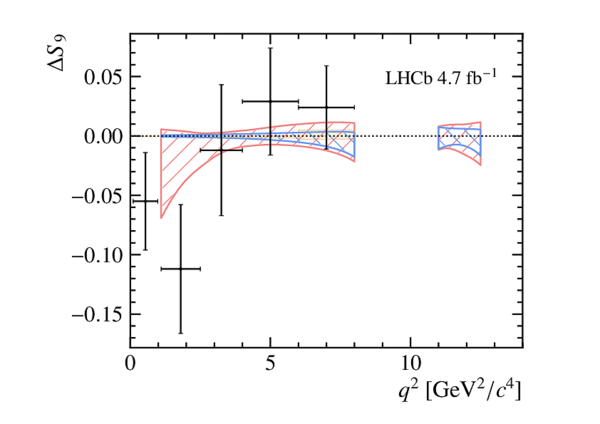
Non-local contributions to the angular observables (S-basis) obtained from data fits with (blue) and without (red) constraints from $q^{2} < 0$. The shaded regions are shown at 68% confidence level. When available, the difference between the LHCb binned angular analysis [10] and SM central-value from Refs. [23,70] is overlaid for reference (black dots), together with the uncertainty on the SM prediction (green) and difference between the SM predictions from Refs. [16,25,31] with respect to Refs. [23,70] (yellow). |
Fig5a.pdf [157 KiB] HiDef png [339 KiB] Thumbnail [184 KiB] *.C file |

|
|
Fig5b.pdf [157 KiB] HiDef png [211 KiB] Thumbnail [122 KiB] *.C file |

|
|
|
Fig5c.pdf [157 KiB] HiDef png [251 KiB] Thumbnail [138 KiB] *.C file |

|
|
|
Fig5d.pdf [157 KiB] HiDef png [454 KiB] Thumbnail [235 KiB] *.C file |

|
|
|
Fig5e.pdf [157 KiB] HiDef png [428 KiB] Thumbnail [223 KiB] *.C file |
|
|
|
Fig5f.pdf [141 KiB] HiDef png [191 KiB] Thumbnail [113 KiB] *.C file |
|
|
|
Fig5g.pdf [141 KiB] HiDef png [162 KiB] Thumbnail [95 KiB] *.C file |
|
|
|
Fig5h.pdf [141 KiB] HiDef png [179 KiB] Thumbnail [106 KiB] *.C file |
|
|
|
Animated gif made out of all figures. |
PAPER-2023-033.gif Thumbnail |

|
![HiDef png [136 KiB]](Directory_LHCb-PAPER-2023-033/hidef_Fig1.png)
![HiDef png [253 KiB]](Directory_LHCb-PAPER-2023-033/hidef_Fig2a.png)
![HiDef png [243 KiB]](Directory_LHCb-PAPER-2023-033/hidef_Fig2b.png)
![HiDef png [692 KiB]](Directory_LHCb-PAPER-2023-033/hidef_Fig3.png)
![HiDef png [201 KiB]](Directory_LHCb-PAPER-2023-033/hidef_Fig4a.png)
![HiDef png [363 KiB]](Directory_LHCb-PAPER-2023-033/hidef_Fig4b.png)
![HiDef png [165 KiB]](Directory_LHCb-PAPER-2023-033/hidef_Fig4c.png)
![HiDef png [197 KiB]](Directory_LHCb-PAPER-2023-033/hidef_Fig4d.png)
![HiDef png [239 KiB]](Directory_LHCb-PAPER-2023-033/hidef_Fig4e.png)
![HiDef png [159 KiB]](Directory_LHCb-PAPER-2023-033/hidef_Fig4f.png)
![HiDef png [339 KiB]](Directory_LHCb-PAPER-2023-033/hidef_Fig5a.png)
![HiDef png [211 KiB]](Directory_LHCb-PAPER-2023-033/hidef_Fig5b.png)
![HiDef png [251 KiB]](Directory_LHCb-PAPER-2023-033/hidef_Fig5c.png)
![HiDef png [454 KiB]](Directory_LHCb-PAPER-2023-033/hidef_Fig5d.png)
![HiDef png [428 KiB]](Directory_LHCb-PAPER-2023-033/hidef_Fig5e.png)
![HiDef png [191 KiB]](Directory_LHCb-PAPER-2023-033/hidef_Fig5f.png)
![HiDef png [162 KiB]](Directory_LHCb-PAPER-2023-033/hidef_Fig5g.png)
![HiDef png [179 KiB]](Directory_LHCb-PAPER-2023-033/hidef_Fig5h.png)
Created on 18 May 2024.