Search for $B_c^+\to\pi^+\mu^+\mu^-$ decays and measurement of the branching fraction ratio ${\cal B}(B_c^+\to\psi(2S)\pi^+)/{\cal B}(B_c^+\to J/\psi \pi^+)$
[to restricted-access page]Information
LHCb-PAPER-2023-037
CERN-EP-2023-280
arXiv:2312.12228 [PDF]
(Submitted on 19 Dec 2023)
EPJC
Inspire 2738554
Tools
Abstract
The first search for nonresonant $B_c^+\to\pi^+\mu^+\mu^-$ decays is reported. The analysis uses proton-proton collision data collected with the LHCb detector between 2011 and 2018, corresponding to an integrated luminosity of 9 fb$^{-1}$. No evidence for an excess of signal events over background is observed and an upper limit is set on the branching fraction ratio ${\cal B}(B_c^+\to\pi^+\mu^+\mu^-)/{\cal B}(B_c^+\to J/\psi \pi^+) < 2.1\times 10^{-4}$ at $90\%$ confidence level. Additionally, an updated measurement of the ratio of the $B_c^+\to\psi(2S)\pi^+$ and $B_c^+\to J/\psi \pi^+$ branching fractions is reported. The ratio ${\cal B}(B_c^+\to\psi(2S)\pi^+)/{\cal B}(B_c^+\to J/\psi \pi^+)$ is measured to be $0.254\pm 0.018 \pm 0.003 \pm 0.005$, where the first uncertainty is statistical, the second systematic, and the third is due to the uncertainties on the branching fractions of the leptonic $J/\psi$ and $\psi(2S)$ decays. This measurement is the most precise to date and is consistent with previous LHCb results.
Figures and captions
|
Reconstructed $\pi ^+ \mu ^+\mu ^- $ invariant-mass distributions for the selected $ B _ c ^+ \rightarrow \pi ^+ \mu ^+\mu ^- $ candidates for each $q^2$ interval and for all intervals combined, with results of the fit described in the text overlaid. |
Fig1a.pdf [14 KiB] HiDef png [185 KiB] Thumbnail [155 KiB] *.C file |

|
|
Fig1b.pdf [15 KiB] HiDef png [191 KiB] Thumbnail [161 KiB] *.C file |

|
|
|
Fig1c.pdf [14 KiB] HiDef png [190 KiB] Thumbnail [157 KiB] *.C file |

|
|
|
Fig1d.pdf [17 KiB] HiDef png [221 KiB] Thumbnail [194 KiB] *.C file |

|
|
|
Fig1e.pdf [17 KiB] HiDef png [230 KiB] Thumbnail [201 KiB] *.C file |

|
|
|
Reconstructed $\pi ^+ \mu ^+\mu ^- $ invariant-mass distributions for the selected $ B _ c ^+ \rightarrow { J \mskip -3mu/\mskip -2mu\psi } \pi ^+ $ candidates at the (left) $\pi ^+ \mu ^+\mu ^- $ and (right) $\psi {(2S)} \pi ^+ $ working points, with the results of the fits overlaid. For the right figure, the $\pi ^+ \mu ^+\mu ^- $ invariant mass is calculated after constraining the dimuon mass to the known $ { J \mskip -3mu/\mskip -2mu\psi }$ mass, thereby improving the signal resolution. |
Fig2a.pdf [20 KiB] HiDef png [251 KiB] Thumbnail [191 KiB] *.C file |

|
|
Fig2b.pdf [20 KiB] HiDef png [273 KiB] Thumbnail [204 KiB] *.C file |

|
|
|
Reconstructed $\pi ^+ \mu ^+\mu ^- $ invariant-mass distribution, calculated after constraining the dimuon mass to the known $\psi {(2S)}$ mass, for the selected $ B _ c ^+ \rightarrow \psi {(2S)} \pi ^+ $ candidates, with results of the fit described in the text overlaid. |
Fig3.pdf [20 KiB] HiDef png [270 KiB] Thumbnail [199 KiB] *.C file |

|
|
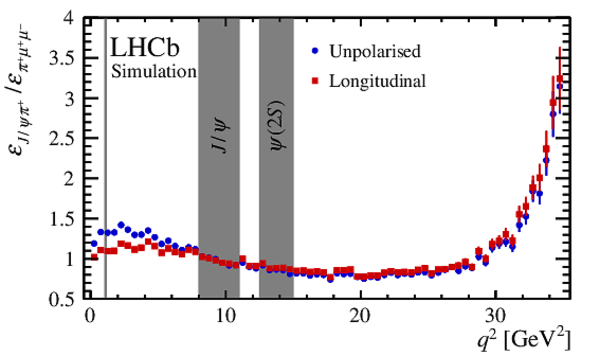
Efficiency ratio between the $ B _ c ^+ \rightarrow { J \mskip -3mu/\mskip -2mu\psi } \pi ^+ $ and nonresonant $ B _ c ^+ \rightarrow \pi ^+ \mu ^+\mu ^- $ decay modes as a function of $q^2$, evaluated for the two extreme possibilities of the dimuon system forming a scalar state, which is unpolarised, and a vector state that is longitudinally polarised. The shaded $q^2$ intervals, which contain the contributions from the $ { J \mskip -3mu/\mskip -2mu\psi }$ and $\psi {(2S)}$ resonances, are not used in the analysis of nonresonant decays. |
Fig4.pdf [16 KiB] HiDef png [173 KiB] Thumbnail [145 KiB] *.C file |
|
|
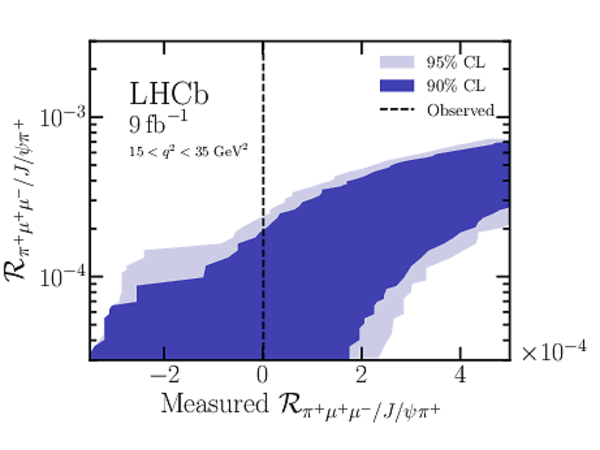
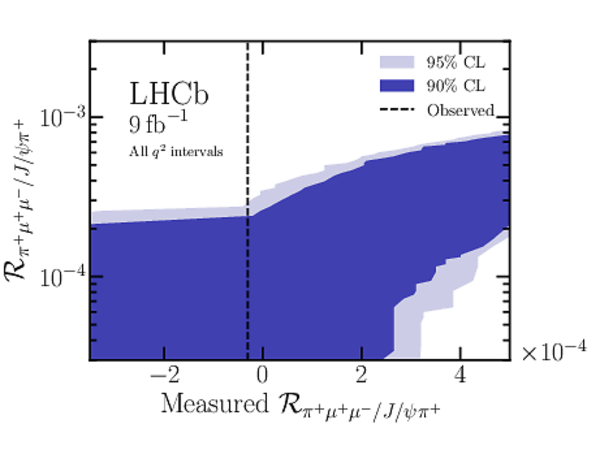
Confidence belts generated using pseudoexperiments according to the Feldman--Cousins prescription [55] for each $q^2$ interval and for all intervals combined. The vertical dashed line shows the central value from the fit to data. |
Fig5a.pdf [18 KiB] HiDef png [174 KiB] Thumbnail [158 KiB] *.C file |

|
|
Fig5b.pdf [18 KiB] HiDef png [183 KiB] Thumbnail [166 KiB] *.C file |

|
|
|
Fig5c.pdf [18 KiB] HiDef png [181 KiB] Thumbnail [160 KiB] *.C file |

|
|
|
Fig5d.pdf [18 KiB] HiDef png [178 KiB] Thumbnail [163 KiB] *.C file |
|
|
|
Fig5e.pdf [18 KiB] HiDef png [169 KiB] Thumbnail [154 KiB] *.C file |
|
|
|
Upper limits on the normalised differential branching fraction for nonresonant $ B _ c ^+ \rightarrow \pi ^+ \mu ^+\mu ^- $ decays as a function of $q^2$. The solid lines show the results for each $q^2$ bin, while the dashed lines show the results for all bins combined. |
Fig6.pdf [15 KiB] HiDef png [158 KiB] Thumbnail [172 KiB] *.C file |

|
|
Animated gif made out of all figures. |
PAPER-2023-037.gif Thumbnail |

|
![HiDef png [185 KiB]](Directory_LHCb-PAPER-2023-037/hidef_Fig1a.png)
![HiDef png [191 KiB]](Directory_LHCb-PAPER-2023-037/hidef_Fig1b.png)
![HiDef png [190 KiB]](Directory_LHCb-PAPER-2023-037/hidef_Fig1c.png)
![HiDef png [221 KiB]](Directory_LHCb-PAPER-2023-037/hidef_Fig1d.png)
![HiDef png [230 KiB]](Directory_LHCb-PAPER-2023-037/hidef_Fig1e.png)
![HiDef png [251 KiB]](Directory_LHCb-PAPER-2023-037/hidef_Fig2a.png)
![HiDef png [273 KiB]](Directory_LHCb-PAPER-2023-037/hidef_Fig2b.png)
![HiDef png [270 KiB]](Directory_LHCb-PAPER-2023-037/hidef_Fig3.png)
![HiDef png [173 KiB]](Directory_LHCb-PAPER-2023-037/hidef_Fig4.png)
![HiDef png [174 KiB]](Directory_LHCb-PAPER-2023-037/hidef_Fig5a.png)
![HiDef png [183 KiB]](Directory_LHCb-PAPER-2023-037/hidef_Fig5b.png)
![HiDef png [181 KiB]](Directory_LHCb-PAPER-2023-037/hidef_Fig5c.png)
![HiDef png [178 KiB]](Directory_LHCb-PAPER-2023-037/hidef_Fig5d.png)
![HiDef png [169 KiB]](Directory_LHCb-PAPER-2023-037/hidef_Fig5e.png)
![HiDef png [158 KiB]](Directory_LHCb-PAPER-2023-037/hidef_Fig6.png)
Tables and captions
|
Ranges of dimuon invariant mass or mass squared ($q^2$) used in the analysis. |
Table_1.pdf [69 KiB] HiDef png [58 KiB] Thumbnail [27 KiB] tex code |

|
|
Yields for the signal nonresonant $ B _ c ^+ \rightarrow \pi ^+ \mu ^+\mu ^- $ decay ($N_{\pi ^+ \mu ^+\mu ^- }$) and combinatorial background ($N_{\rm comb}$) obtained from the fits to data described in the text, with statistical uncertainties only. |
Table_2.pdf [81 KiB] HiDef png [74 KiB] Thumbnail [36 KiB] tex code |

|
|
Yields obtained from the $ B _ c ^+ \rightarrow { J \mskip -3mu/\mskip -2mu\psi } \pi ^+ $ fits to data at the two working points as described in the text, with statistical uncertainties only. |
Table_3.pdf [66 KiB] HiDef png [64 KiB] Thumbnail [31 KiB] tex code |

|
|
Yields obtained from the $ B _ c ^+ \rightarrow \psi {(2S)} \pi ^+ $ fit to data described in the text, with statistical uncertainties only. |
Table_4.pdf [59 KiB] HiDef png [97 KiB] Thumbnail [41 KiB] tex code |

|
|
Efficiency ratios between signal and normalisation modes. The values of $\varepsilon_{ { J \mskip -3mu/\mskip -2mu\psi } \pi ^+ }/\varepsilon_{\pi ^+ \mu ^+\mu ^- }$ are provided for each $q^2$ interval and for all intervals combined. The uncertainty on the ratio combines statistical and systematic effects. |
Table_5.pdf [81 KiB] HiDef png [55 KiB] Thumbnail [27 KiB] tex code |

|
|
Results for $R_{\pi ^+ \mu ^+\mu ^- / { J \mskip -3mu/\mskip -2mu\psi } \pi ^+ }$, where the first uncertainties are statistical and the second are systematic, together with upper limits (ULs) at $90\%$ and $95\%$ CL. |
Table_6.pdf [82 KiB] HiDef png [59 KiB] Thumbnail [28 KiB] tex code |

|
![HiDef png [58 KiB]](Directory_LHCb-PAPER-2023-037/hidef_Table_1.png)
![HiDef png [74 KiB]](Directory_LHCb-PAPER-2023-037/hidef_Table_2.png)
![HiDef png [64 KiB]](Directory_LHCb-PAPER-2023-037/hidef_Table_3.png)
![HiDef png [97 KiB]](Directory_LHCb-PAPER-2023-037/hidef_Table_4.png)
![HiDef png [55 KiB]](Directory_LHCb-PAPER-2023-037/hidef_Table_5.png)
![HiDef png [59 KiB]](Directory_LHCb-PAPER-2023-037/hidef_Table_6.png)
Created on 18 May 2024.