

Compact Muon Solenoid
LHC, CERN
| CMS-B2G-12-009 ; CERN-PH-EP/2015-231 | ||
| Search for W' $\to$ tb in proton-proton collisions at $\sqrt{s} = $ 8 TeV | ||
| CMS Collaboration | ||
| 20 September 2015 | ||
| J. High Energy Phys. 02 (2016) 122 | ||
| Abstract: A search is performed for the production of a massive W' boson decaying to a top and a bottom quark. The data analysed correspond to an integrated luminosity of 19.7 fb$^{-1}$ collected with the CMS detector at the LHC in proton-proton collisions at $ \sqrt{s} = $ 8 TeV. The hadronic decay products of the top quark with high Lorentz boost from the W' boson decay are detected as a single top flavoured jet. The use of jet substructure algorithms allows the top quark jet to be distinguished from standard model QCD background. Limits on the production cross section of a right-handed W' boson are obtained, together with constraints on the left-handed and right-handed couplings of the W' boson to quarks. The production of a right-handed W' boson with a mass below 2.02 TeV decaying to a hadronic final state is excluded at 95\% confidence level. This mass limit increases to 2.15 TeV when both hadronic and leptonic decays are considered, and is the most stringent lower mass limit to date in the tb decay mode. | ||
| Links: e-print arXiv:1509.06051 [hep-ex] (PDF) ; CDS record ; inSPIRE record ; CADI line (restricted) ; | ||
| Figures | |

png pdf |
Figure 1-a:
The average b-tagging rate for QCD jets parameterized as a function of the $ {p_{\mathrm {T}}} $ of the b-jet candidate from the low (a), transition (b), and high (c) $|\eta |$ regions. The measured average b-tagging rate is represented by the data points, the polynomial fit is shown as a solid line, and the propagated uncertainties from the fit are shown as the dashed lines. The horizontal lines on the data points indicate the bin widths. |

png pdf |
Figure 1-b:
The average b-tagging rate for QCD jets parameterized as a function of the $ {p_{\mathrm {T}}} $ of the b-jet candidate from the low (a), transition (b), and high (c) $|\eta |$ regions. The measured average b-tagging rate is represented by the data points, the polynomial fit is shown as a solid line, and the propagated uncertainties from the fit are shown as the dashed lines. The horizontal lines on the data points indicate the bin widths. |

png pdf |
Figure 1-c:
The average b-tagging rate for QCD jets parameterized as a function of the $ {p_{\mathrm {T}}} $ of the b-jet candidate from the low (a), transition (b), and high (c) $|\eta |$ regions. The measured average b-tagging rate is represented by the data points, the polynomial fit is shown as a solid line, and the propagated uncertainties from the fit are shown as the dashed lines. The horizontal lines on the data points indicate the bin widths. |

png pdf |
Figure 2:
Distribution of the mass of the b-jet candidate after the template fit to constrain the QCD multijet and $ {\mathrm {t}\overline {\mathrm {t}}} $ backgrounds has been applied. A control region with inverted selection criteria on the mass of the b-jet candidate is used. The hatched region represents the QCD multijet uncertainty and the uncertainty on the $ {\mathrm {t}\overline {\mathrm {t}}} $ normalization from the output of the fit. The bottom plot shows the pull ((data-background)/$\sigma $) between the data and the background estimate distributions. |

png pdf |
Figure 3-a:
Distributions of $ {M_{ {\mathrm {t}} {\mathrm {b}} }} $ shown for data, $ {\mathrm {t}\overline {\mathrm {t}}} $, and QCD in the control regions CR1 (top) and CR2 (bottom) as defined in the text. The hatched region represents the full QCD multijet and $ {\mathrm {t}\overline {\mathrm {t}}} $ background uncertainty. The bottom plots show the pull ((data-background)/$\sigma $) between the data and the background estimate distributions. |
png pdf |
Figure 3-b:
Distributions of $ {M_{ {\mathrm {t}} {\mathrm {b}} }} $ shown for data, $ {\mathrm {t}\overline {\mathrm {t}}} $, and QCD in the control regions CR1 (top) and CR2 (bottom) as defined in the text. The hatched region represents the full QCD multijet and $ {\mathrm {t}\overline {\mathrm {t}}} $ background uncertainty. The bottom plots show the pull ((data-background)/$\sigma $) between the data and the background estimate distributions. |

png pdf |
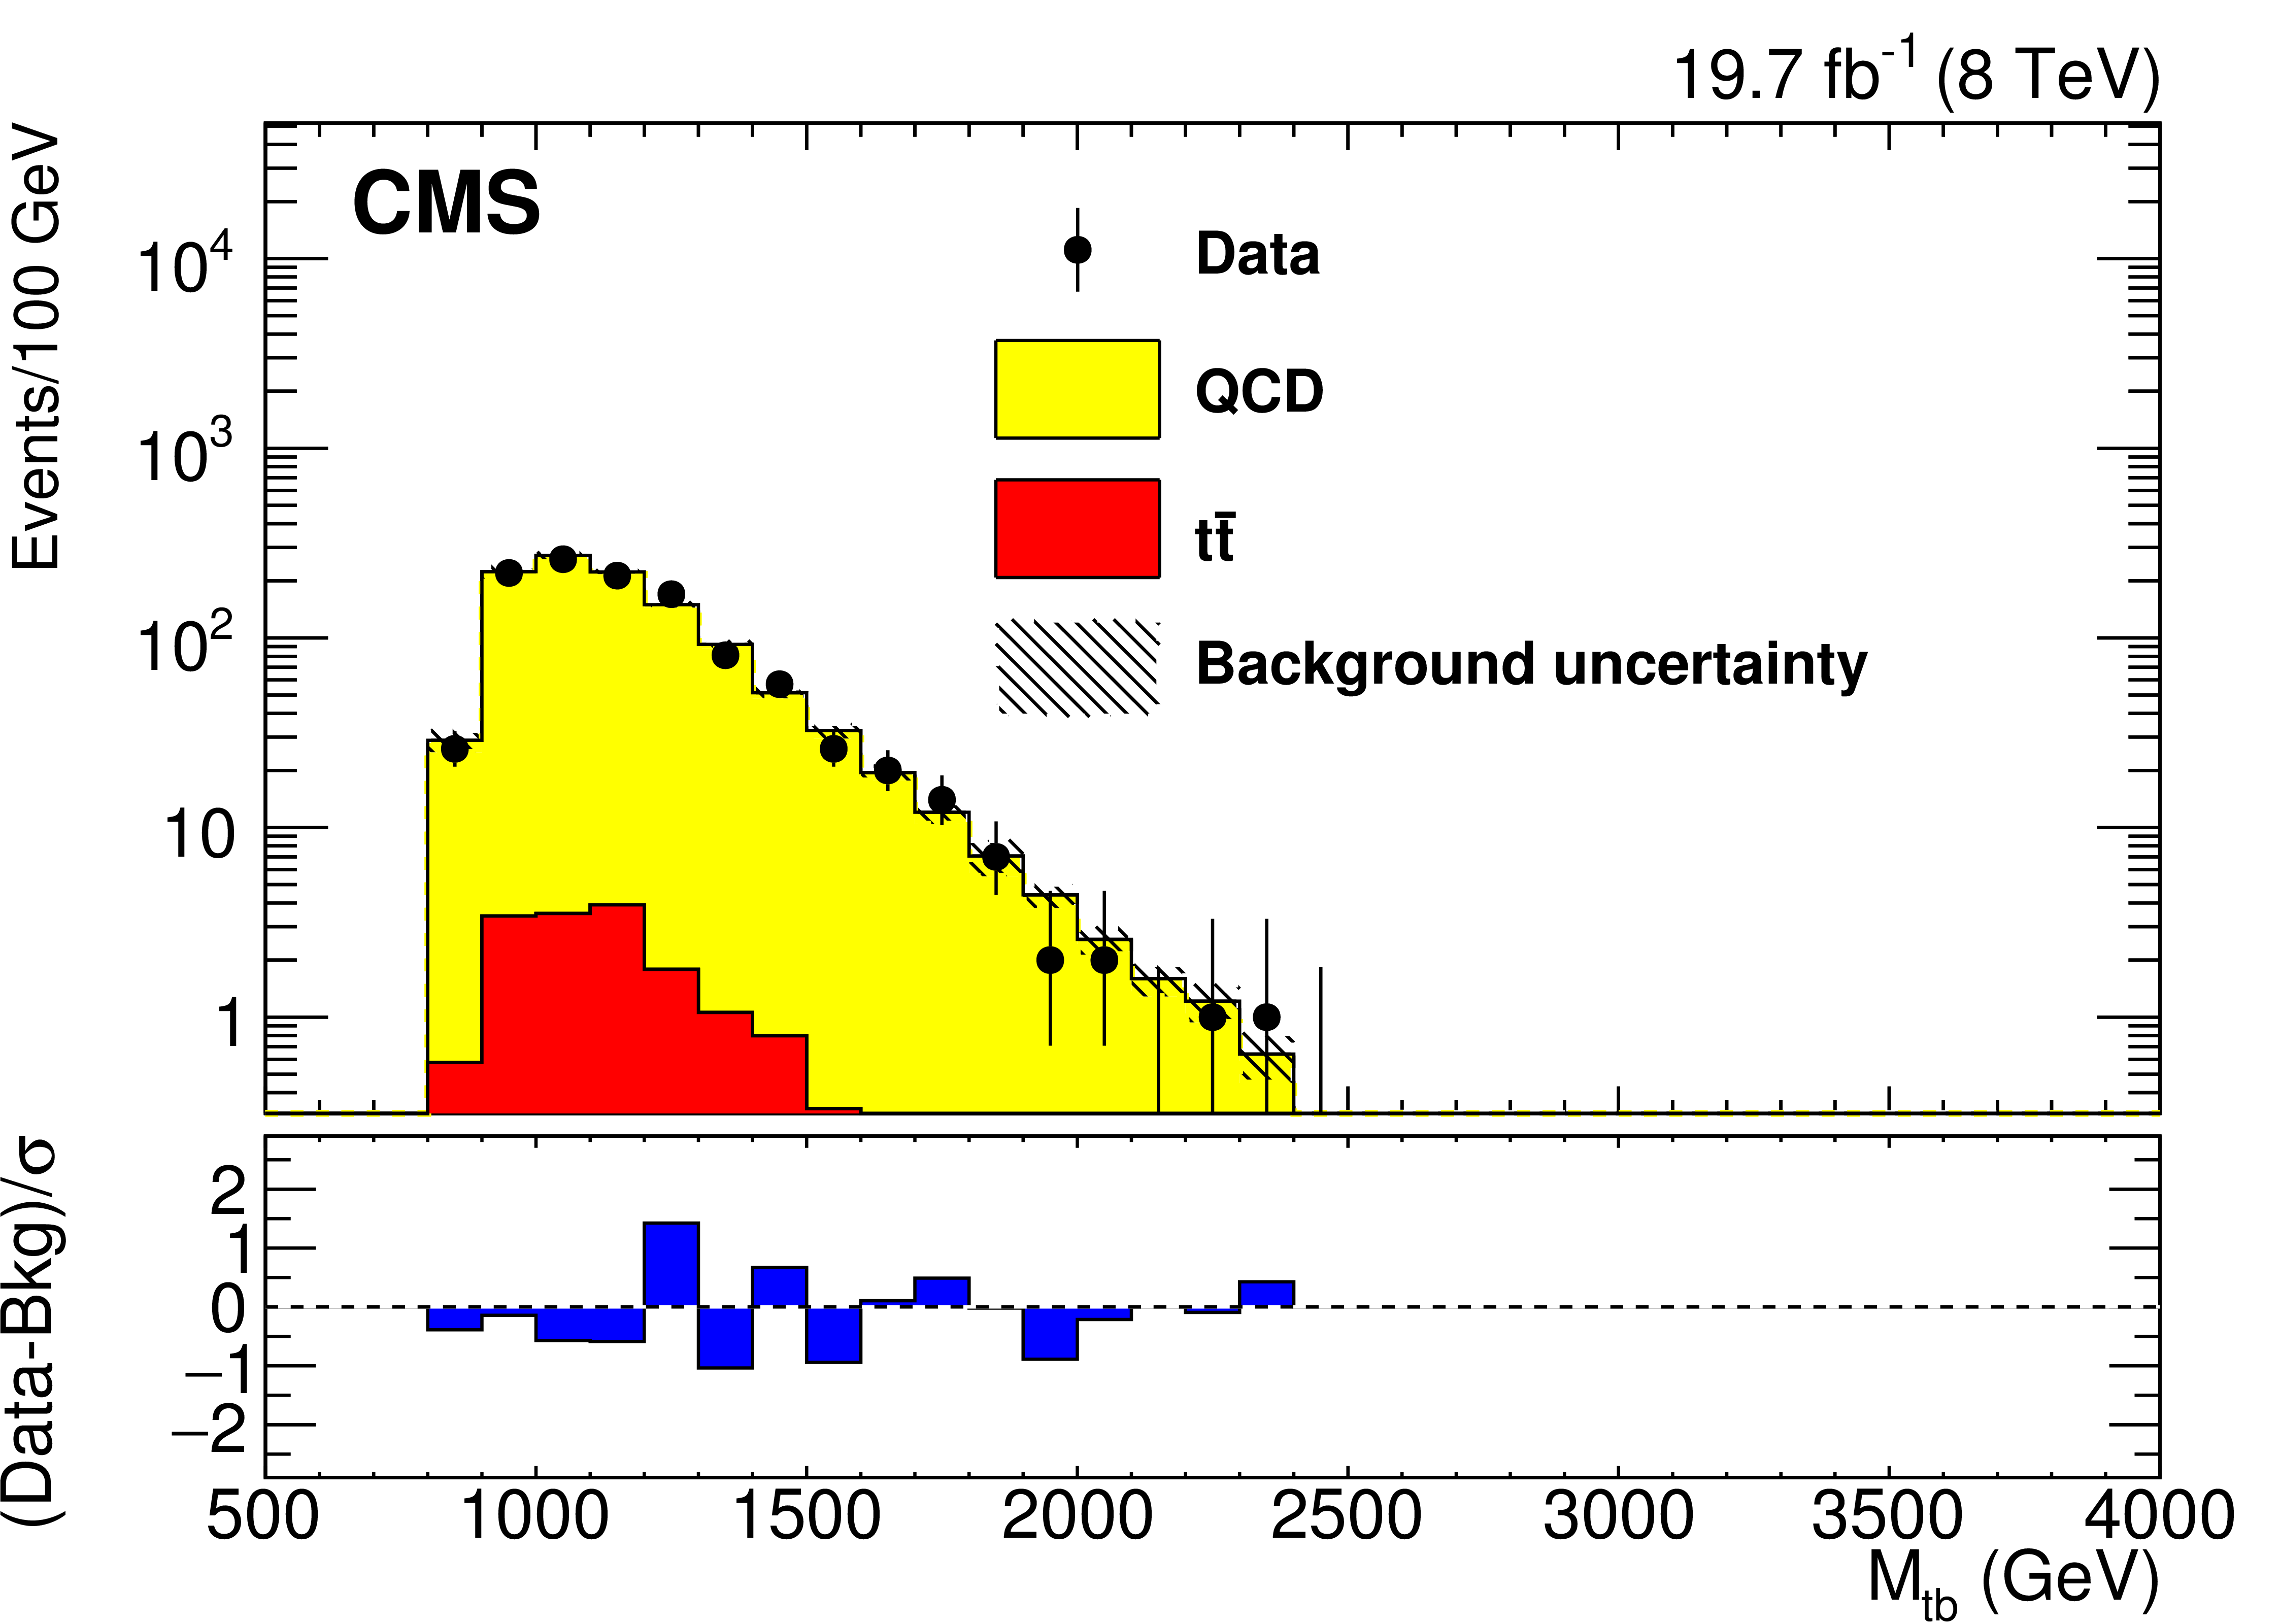
Figure 4:
The distribution of $ {M_{ {\mathrm {t}} {\mathrm {b}} }} $ shown for data, $ {\mathrm {t}\overline {\mathrm {t}}} $, QCD, single top, and several example signal $ { {\mathrm {W}}^\prime } $ boson mass hypotheses. The normalization for the $ { {\mathrm {W}}^\prime } $ signal samples assumes the cross section from theory. The distributions are shown after the application of all selection criteria. The background contribution from single top quark production is not considered when setting limits. The bottom plot shows the pull ((data-background)/$\sigma $) between the data and the background estimate distributions. |

png pdf |
Figure 5:
The $ { {\mathrm {W}}^\prime _{\mathrm {R}}} $ boson 95% CL production cross section times $\mathcal {B}_{\mathrm { { {\mathrm {W}}^\prime _{\mathrm {R}}} \rightarrow tb}}$ limits for the hadronic channel. The observed (solid) and expected (dashed) limits, as well as the $ { {\mathrm {W}}^\prime _{\mathrm {R}}} $ boson theoretical cross section (dot-dashed) are shown. As indicated in the legend, the shaded regions about the expected limits represent 1 and 2$\sigma $ bands. |

png pdf |
Figure 6:
The $ { {\mathrm {W}}^\prime _{\mathrm {R}}} $ boson 95% CL production cross section times $\mathcal {B}_{\mathrm { { {\mathrm {W}}^\prime _{\mathrm {R}}} \rightarrow tb}}$ limits for the combined hadronic and leptonic channels. The observed (solid) and expected (dashed) limits, as well as the $ { {\mathrm {W}}^\prime _{\mathrm {R}}} $ boson theoretical cross section (dash-dotted) are shown. As indicated in the legend, the shaded regions about the expected limits represent 1 and 2$\sigma $ bands. The region to the left of the vertical dashed line shows the limits derived only from the leptonic channel. The right of the vertical dashed line shows limits based on the combined hadronic and leptonic channels. |

png pdf |
Figure 7-a:
Contour plots of $M_{ { {\mathrm {W}}^\prime } }$ in the ($a^{\mathrm {L}},a^{\mathrm {R}}$) plane in the hadronic channel. The a (b) plot shows observed (expected) limits. The contour shading indicates the values of $M_{ { {\mathrm {W}}^\prime } }$ where the theoretical cross section is equal to the observed or expected 95% CL limit. |

png pdf |
Figure 7-b:
Contour plots of $M_{ { {\mathrm {W}}^\prime } }$ in the ($a^{\mathrm {L}},a^{\mathrm {R}}$) plane in the hadronic channel. The a (b) plot shows observed (expected) limits. The contour shading indicates the values of $M_{ { {\mathrm {W}}^\prime } }$ where the theoretical cross section is equal to the observed or expected 95% CL limit. |

png pdf |
Figure 8-a:
Contour plots of $M_{ { {\mathrm {W}}^\prime } }$ in the ($a^{\mathrm {L}},a^{\mathrm {R}}$) plane in the leptonic channel. The a (b) plot shows observed (expected) limits. The contour shading indicates the values of $M_{ { {\mathrm {W}}^\prime } }$ where the theoretical cross section is equal to the observed or expected 95% CL limit. These are updated from Ref.\cite {Chatrchyan:2014koa} to include the effect of the $ { {\mathrm {W}}^\prime } $ width on the cross section of an $a^{\mathrm {L}}$ and $a^{\mathrm {R}}$ combination. |

png pdf |
Figure 8-b:
Contour plots of $M_{ { {\mathrm {W}}^\prime } }$ in the ($a^{\mathrm {L}},a^{\mathrm {R}}$) plane in the leptonic channel. The a (b) plot shows observed (expected) limits. The contour shading indicates the values of $M_{ { {\mathrm {W}}^\prime } }$ where the theoretical cross section is equal to the observed or expected 95% CL limit. These are updated from Ref.\cite {Chatrchyan:2014koa} to include the effect of the $ { {\mathrm {W}}^\prime } $ width on the cross section of an $a^{\mathrm {L}}$ and $a^{\mathrm {R}}$ combination. |

png pdf |
Figure 9-a:
Contour plots of $M_{ { {\mathrm {W}}^\prime } }$ in the ($a^{\mathrm {L}},a^{\mathrm {R}}$) plane using the combined hadronic and leptonic channels. The a (b) plot shows observed (expected) limits. The contour shading indicates the values of $M_{ { {\mathrm {W}}^\prime } }$ where the theoretical cross section intersects the observed or expected limit band. The solid contours represent combined limits, and the dashed contours indicate limits that are obtained purely from the leptonic channel. |

png pdf |
Figure 9-b:
Contour plots of $M_{ { {\mathrm {W}}^\prime } }$ in the ($a^{\mathrm {L}},a^{\mathrm {R}}$) plane using the combined hadronic and leptonic channels. The a (b) plot shows observed (expected) limits. The contour shading indicates the values of $M_{ { {\mathrm {W}}^\prime } }$ where the theoretical cross section intersects the observed or expected limit band. The solid contours represent combined limits, and the dashed contours indicate limits that are obtained purely from the leptonic channel. |
| Tables | |

png pdf |
Table 1:
Numbers of observed and expected events at successive stages of the event selection. The expected numbers are scaled to an integrated luminosity of 19.7 fb$^{-1}$. Statistical uncertainties in the event yields are quoted. The QCD background contribution is only reported for the final selection. The first row implies a 150 GeV $ {p_{\mathrm {T}}} $ selection on the jets, the trigger selection, and the requirement that the two leading jets be in opposite hemispheres. The row labeled ``$ {p_{\mathrm {T}}} $'' represents the transverse momentum requirements placed on the two leading jets. The signal events, shown for several values of the W' boson mass, are normalized to the theoretical cross section. |

png pdf |
Table 2:
Sources of uncertainty that affect the $ {M_{ {\mathrm {t}} {\mathrm {b}} }} $ distribution and the $\pm $1$\sigma $ variations that are used in the fit. |
| Summary |
| A search for a new massive gauge boson W' decaying to a top and a bottom quark with a hadronic signature has been performed using proton-proton collisions recorded by the CMS detector at $\sqrt{s}=$ 8 TeV, corresponding to an integrated luminosity of 19.7 fb$^{-1}$. The search is focused on W' masses above 1.30 TeV, where the main feature of this topology is a top quark whose decay products merge into a single jet.The analysis uses jet substructure algorithms to distinguish the top quark jet from standard model hadronic jet backgrounds. The principal background, from QCD multijet production, is estimated from data using the average b-tagging rate measured in a QCD enhanced control region. The other important source of background, from standard model $\mathrm{ t \bar{t} }$ production, is estimated from simulation, and is corrected by a scale factor derived from control samples in data.Limits are placed on the production cross section of a right-handed W' boson, together with constraints on the left-handed and right-handed couplings of the W' boson to quarks. The production of a right-handed W' boson with a mass below 2.02 TeV decaying to a hadronic final state is excluded at 95% confidence level. The lower limit on the mass of the right-handed W' boson increases to 2.15 TeV at 95% confidence level when both hadronic and leptonic decays are considered, and is the most stringent lower mass limit to date in the tb decay mode. |
|
|
Compact Muon Solenoid LHC, CERN |
|

|

|

|

|

|