

Compact Muon Solenoid
LHC, CERN
| CMS-B2G-14-005 ; CERN-PH-EP-2015-246 | ||
| Search for the production of an excited bottom quark decaying to tW in proton-proton collisions at $\sqrt{s} =$ 8 TeV | ||
| CMS Collaboration | ||
| 27 September 2015 | ||
| J. High Energy Phys. 01 (2016) 166 | ||
| Abstract: A search is presented for a singly produced excited bottom quark ($\mathrm{b}^*$) decaying to a top quark and a W boson in the all-hadronic, lepton+jets, and dilepton final states in proton-proton collisions at $\sqrt{s} =$ 8 TeV recorded by the CMS experiment at the CERN LHC. Data corresponding to an integrated luminosity of 19.7 fb$^{-1}$ are used. No significant excess of events is observed with respect to standard model expectations. We set limits at 95\% confidence on the product of the $\mathrm{b}^*$ quark production cross section and its branching fraction to tW. The cross section limits are interpreted for scenarios including left-handed, right-handed, and vector-like couplings of the $\mathrm{b}^*$ quark and are presented in the two-dimensional coupling plane based on the production and decay coupling constants. The masses of the left-handed, right-handed, and vector-like $\mathrm{b}^*$ quark states are excluded at 95\% confidence below 1390, 1430, and 1530 GeV, respectively, for benchmark couplings. This analysis gives the most stringent limits on the mass of the $\mathrm{b}^*$ quark to date. | ||
| Links: e-print arXiv:1509.08141 [hep-ex] (PDF) ; CDS record ; inSPIRE record ; CADI line (restricted) ; | ||
| Figures | |

png pdf |
Figure 1:
Leading-order Feynman diagram contributing to $ {\mathrm {g}} {\mathrm {b}} \to { {\mathrm {b}} ^*} \to {\mathrm {t}} {\mathrm {W}}$. |

png pdf |
Figure 2:
The invariant mass of the $ {\mathrm {t}} {\mathrm {W}}$ system in the all-hadronic channel after the full selection of data, the estimated background, and the simulated signal with a $ { {\mathrm {b}} ^*} $ mass of 1300 GeV. The combined statistical and systematic uncertainties are indicated by the hatched band. The bottom plot shows the pull ((data-background)/$\sigma _{\mathrm {Data}}\oplus \sigma _{\mathrm {Exp.}}$) between the data and the background estimate distributions. The quantities $\sigma _{\mathrm {Data}}$ and $\sigma _{\mathrm {Exp.}}$ refer to the statistical uncertainty in data, and the systematic uncertainty in the background respectively. |

png pdf |
Figure 3-a:
The invariant mass, $m_{ {\mathrm {t}} {\mathrm {W}}}$, in data compared to the SM background estimation for the electron (a) and muon (b) channels. The combined statistical and systematic uncertainties are indicated by the hatched band. The bottom plots show the pull ((data-background)/$\sigma _{\mathrm {Data}}\oplus \sigma _{\mathrm {Exp.}}$) between the data and the background estimate distributions. The quantities $\sigma _{\mathrm {Data}}$ and $\sigma _{\mathrm {Exp.}}$ refer to the statistical uncertainty in data, and the systematic uncertainty in the background, respectively. |
png pdf |
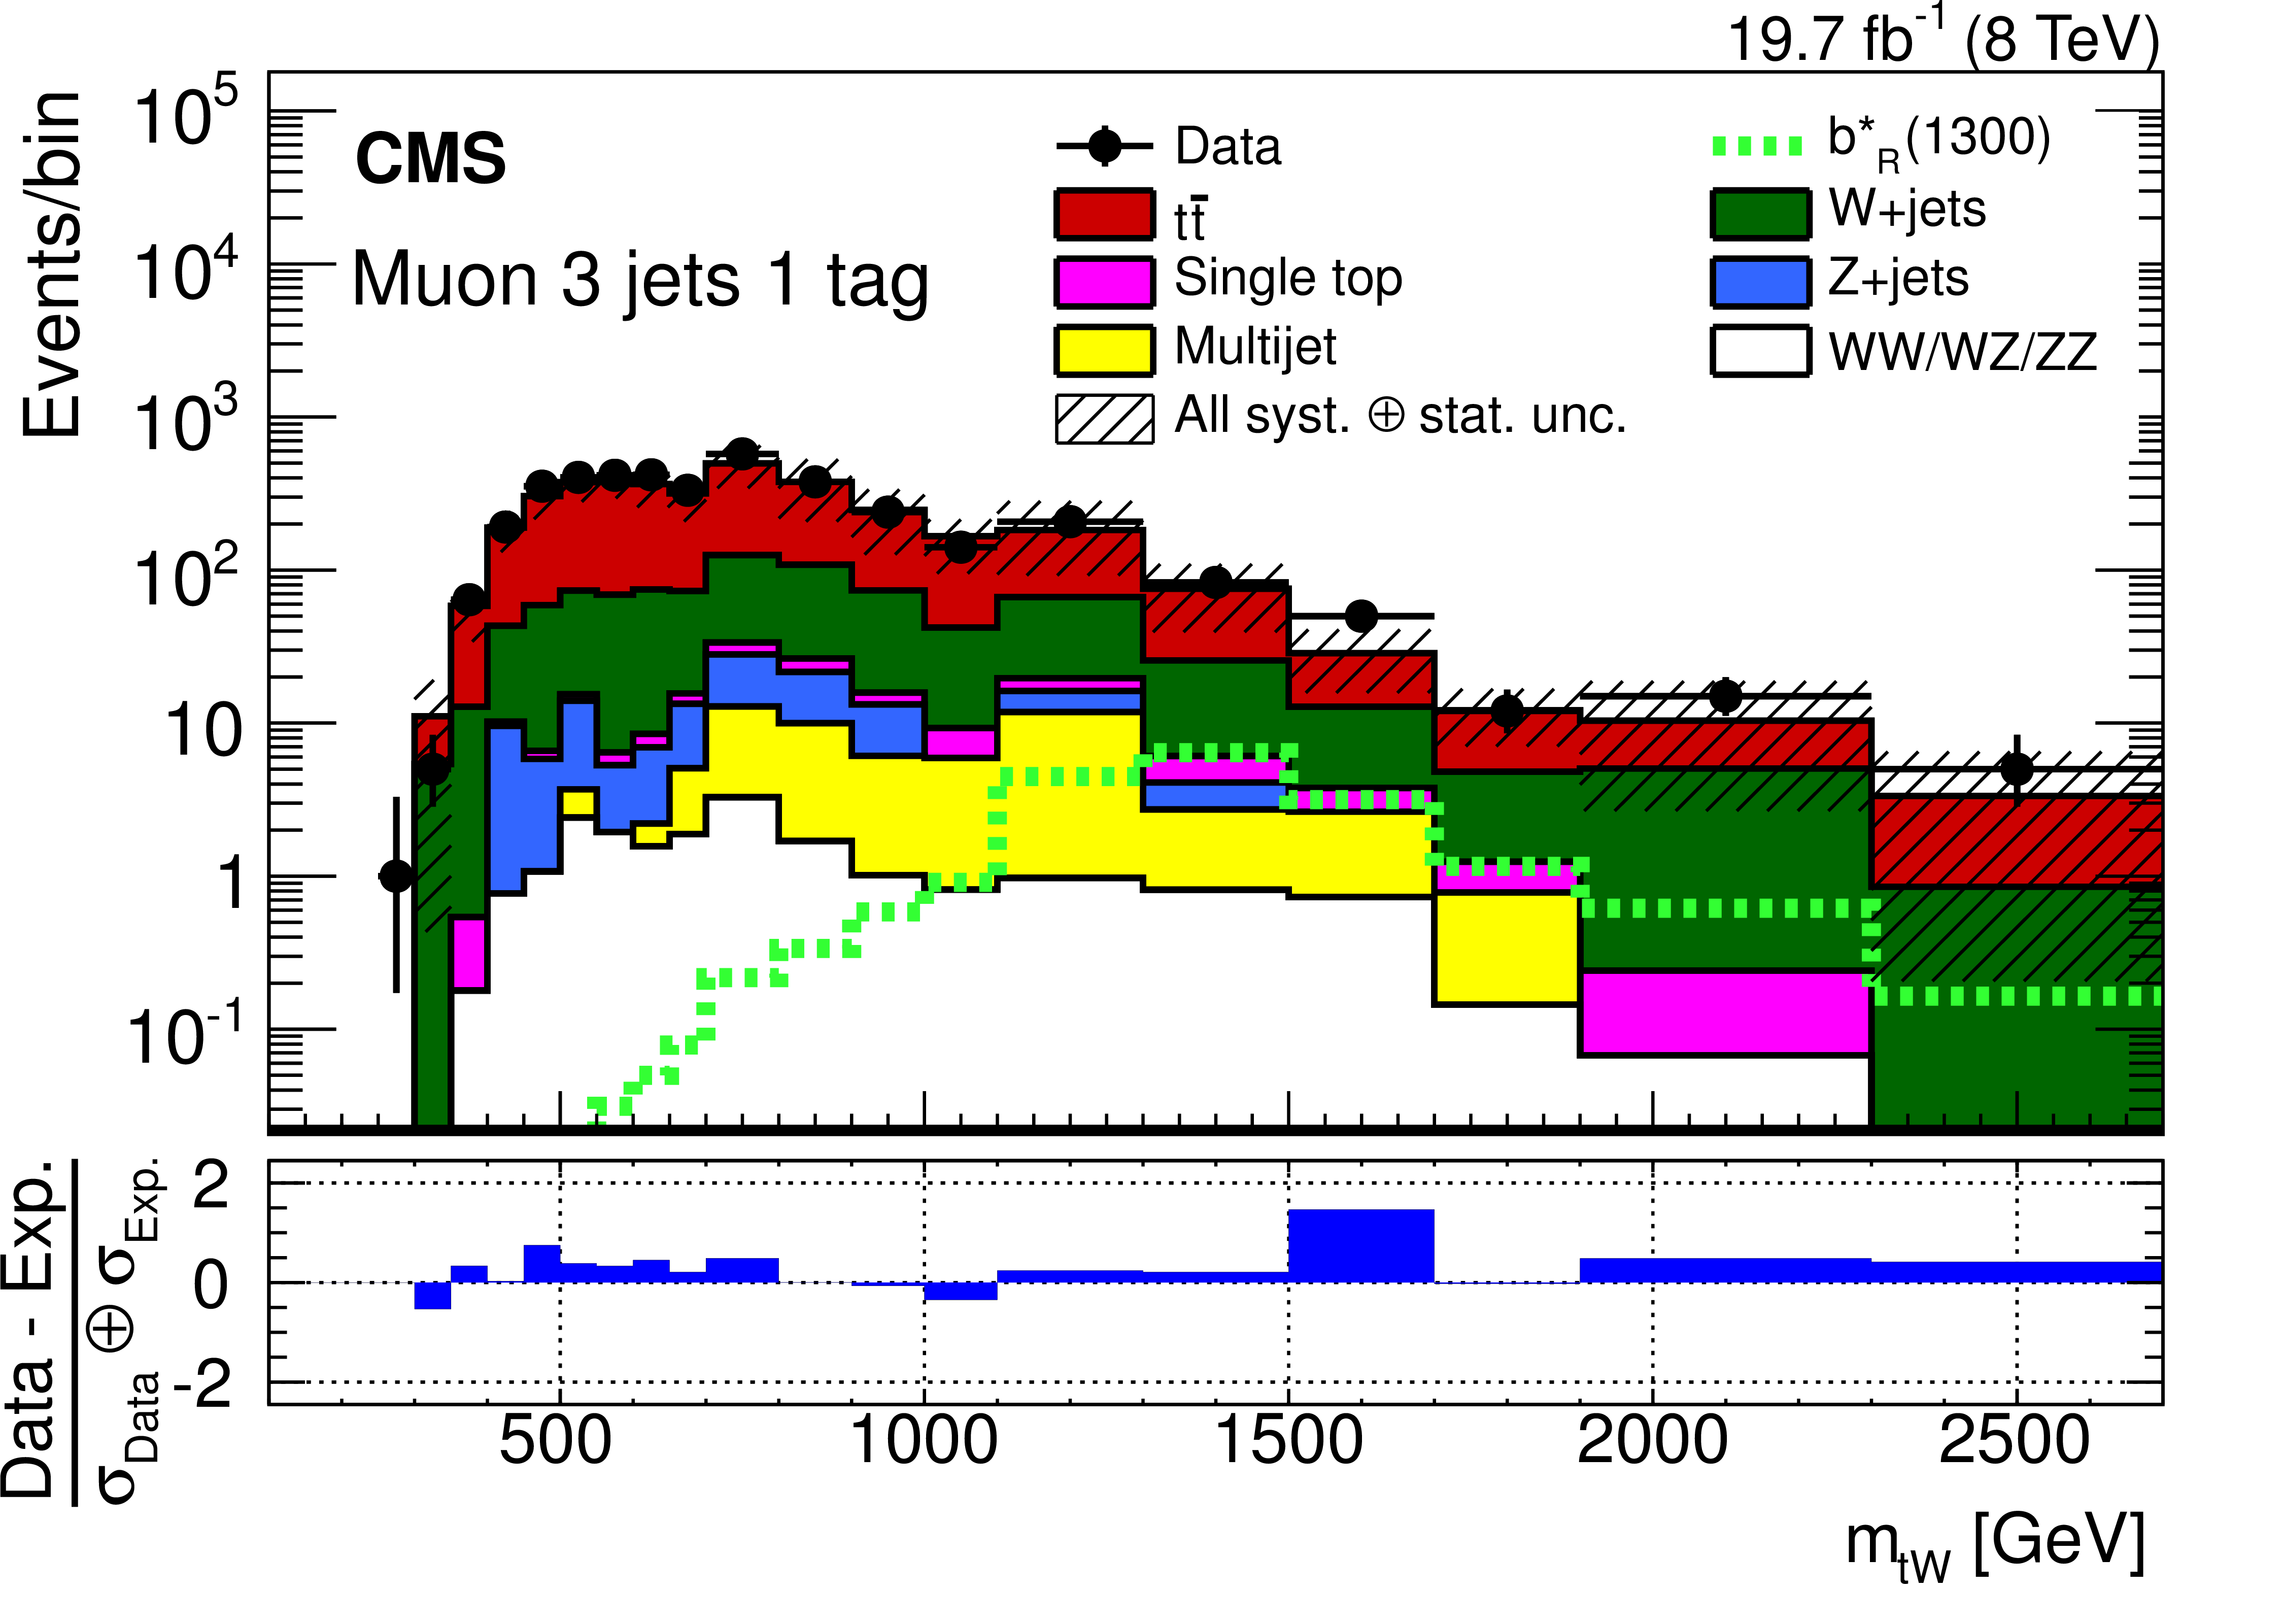
Figure 3-b:
The invariant mass, $m_{ {\mathrm {t}} {\mathrm {W}}}$, in data compared to the SM background estimation for the electron (a) and muon (b) channels. The combined statistical and systematic uncertainties are indicated by the hatched band. The bottom plots show the pull ((data-background)/$\sigma _{\mathrm {Data}}\oplus \sigma _{\mathrm {Exp.}}$) between the data and the background estimate distributions. The quantities $\sigma _{\mathrm {Data}}$ and $\sigma _{\mathrm {Exp.}}$ refer to the statistical uncertainty in data, and the systematic uncertainty in the background, respectively. |
png pdf |
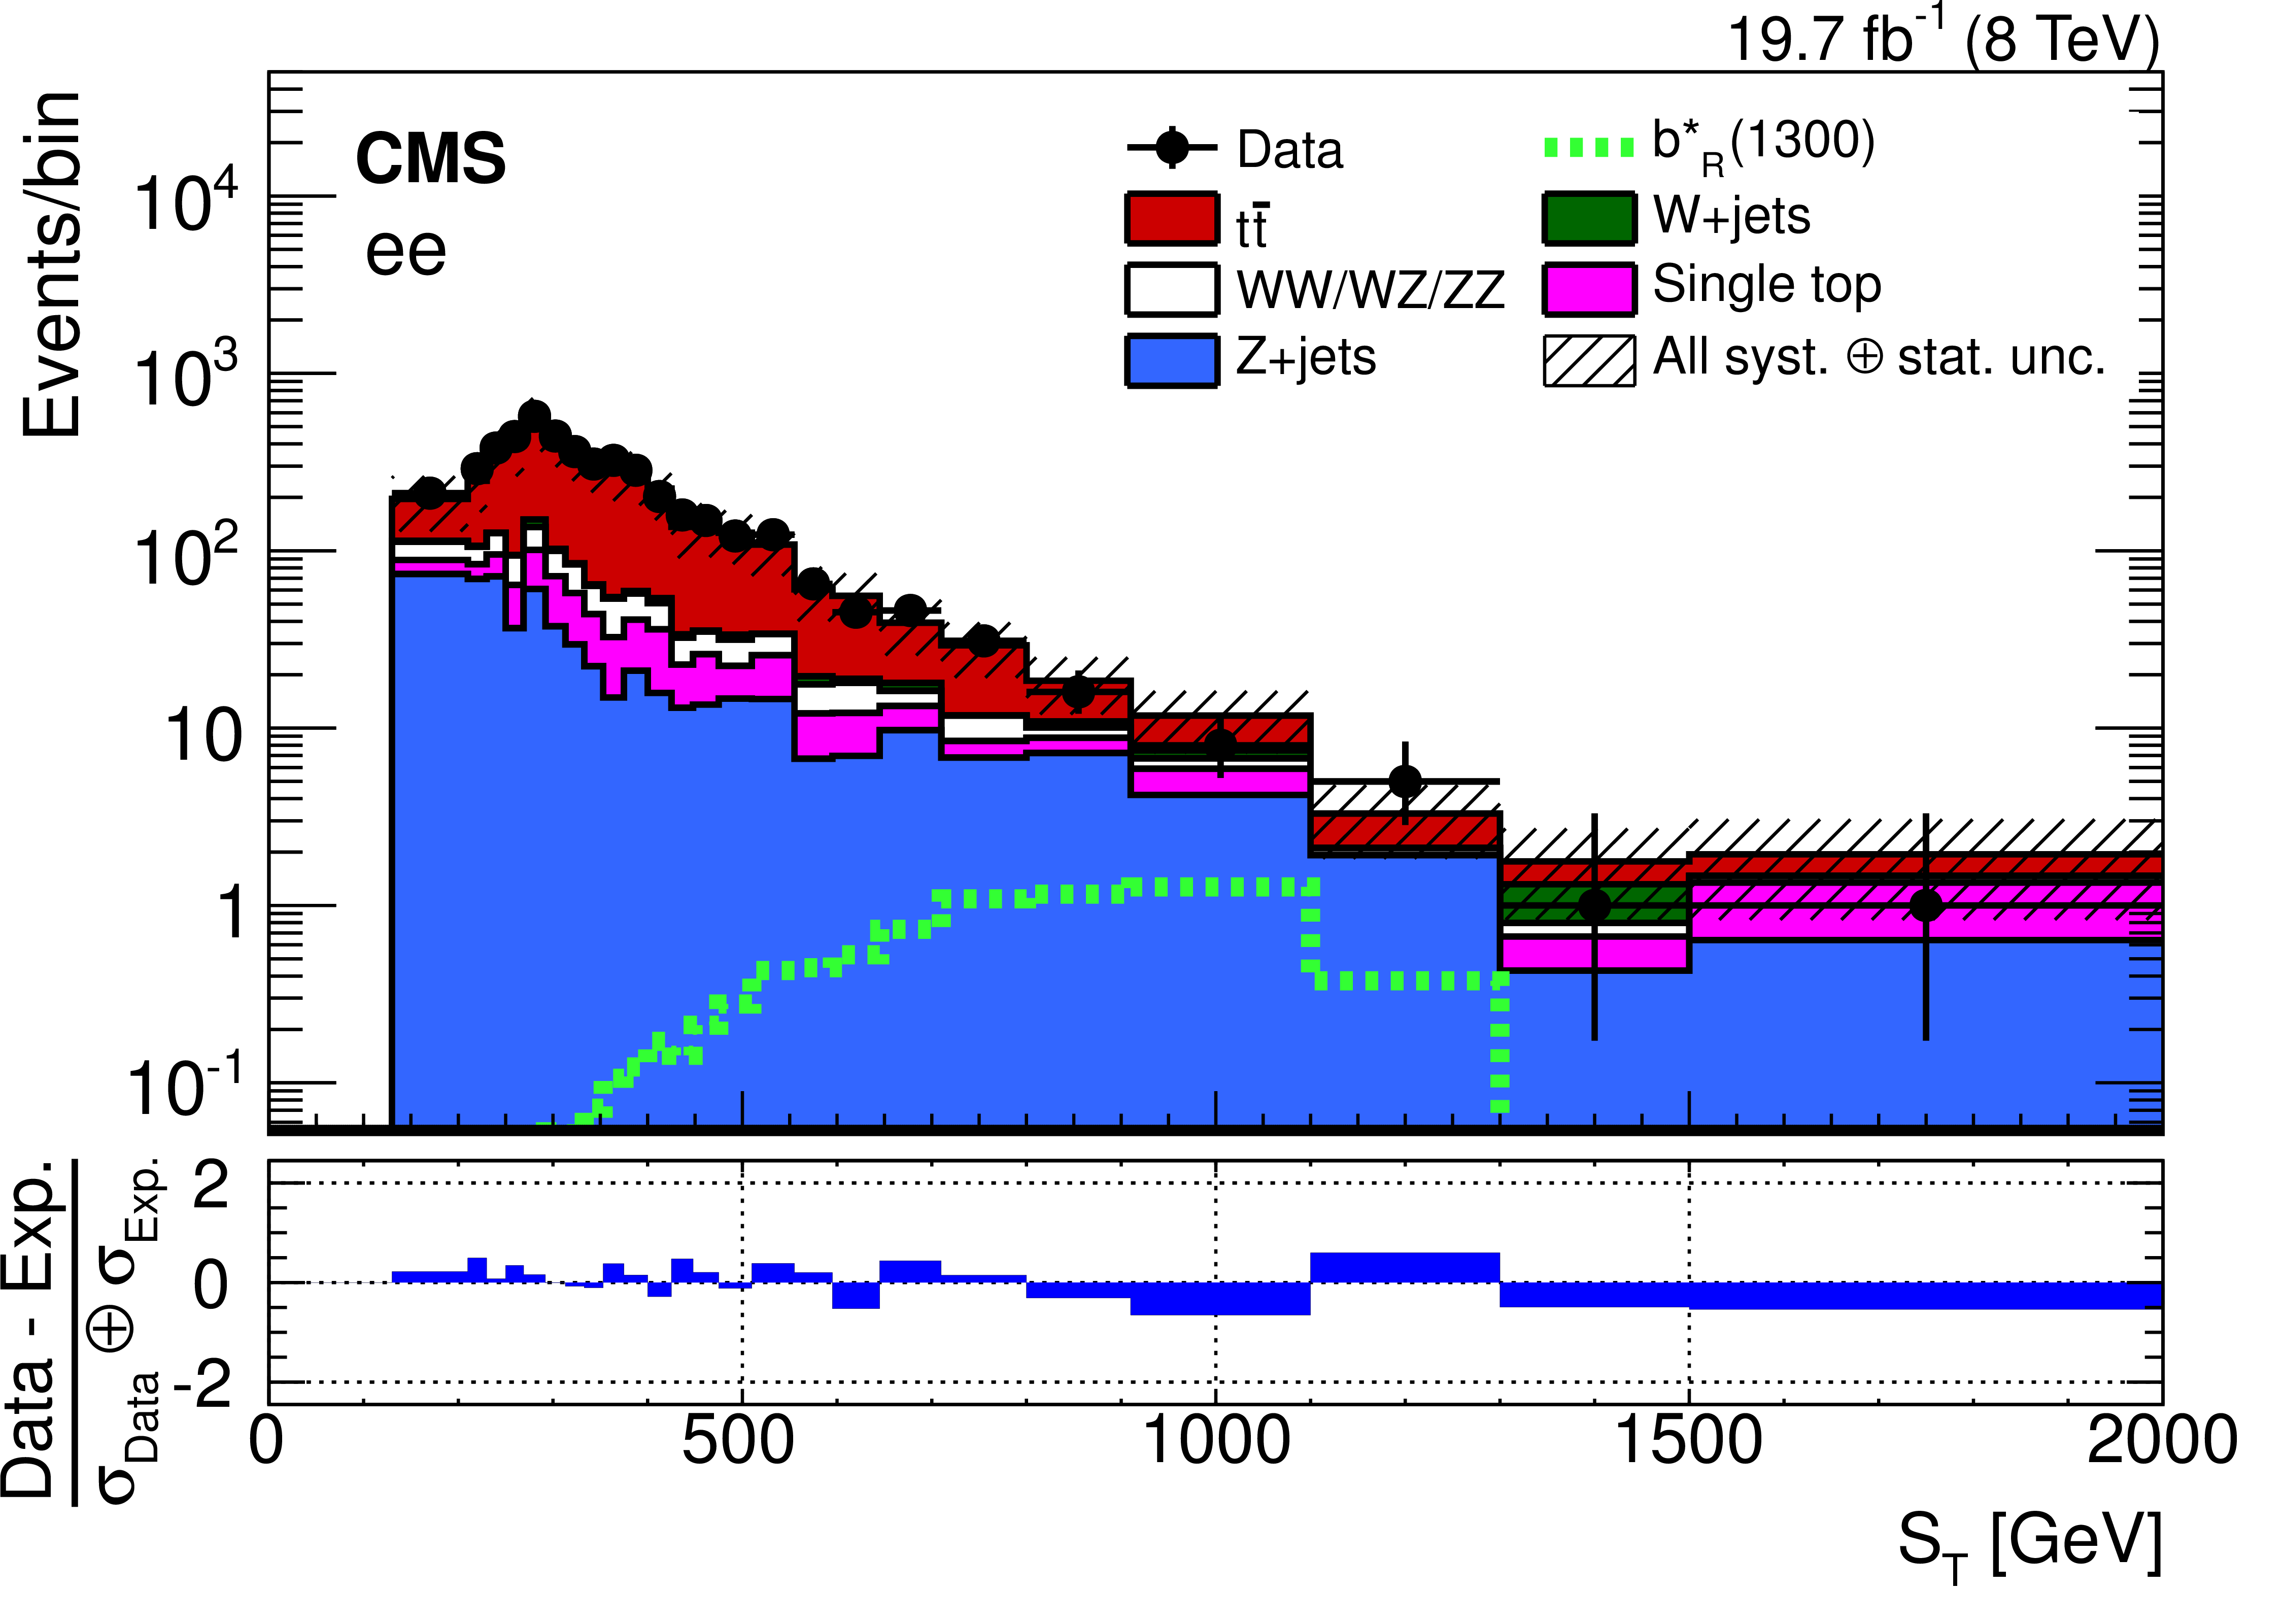
Figure 4-a:
The $S_{\rm T}$ distribution for data and simulated samples after the event selection is applied, for $ {\mathrm {e}} {\mathrm {e}}$ (a), $ {\mathrm {e}} {{\mu }}$ (b), $ {{\mu }} {{\mu }}$ (c), and inclusive dilepton (d) channels. The combined statistical and systematic uncertainties are indicated by the hatched band. The bottom plots show the pull ((data-background)/$\sigma _{\mathrm {Data}}\oplus \sigma _{\mathrm {Exp.}}$) between the data and the background estimate distributions. The symbols $\sigma _{\mathrm {Data}}$ and $\sigma _{\mathrm {Exp.}}$ refer to the statistical uncertainty in data, and the systematic uncertainty in the background, respectively. |
png pdf |
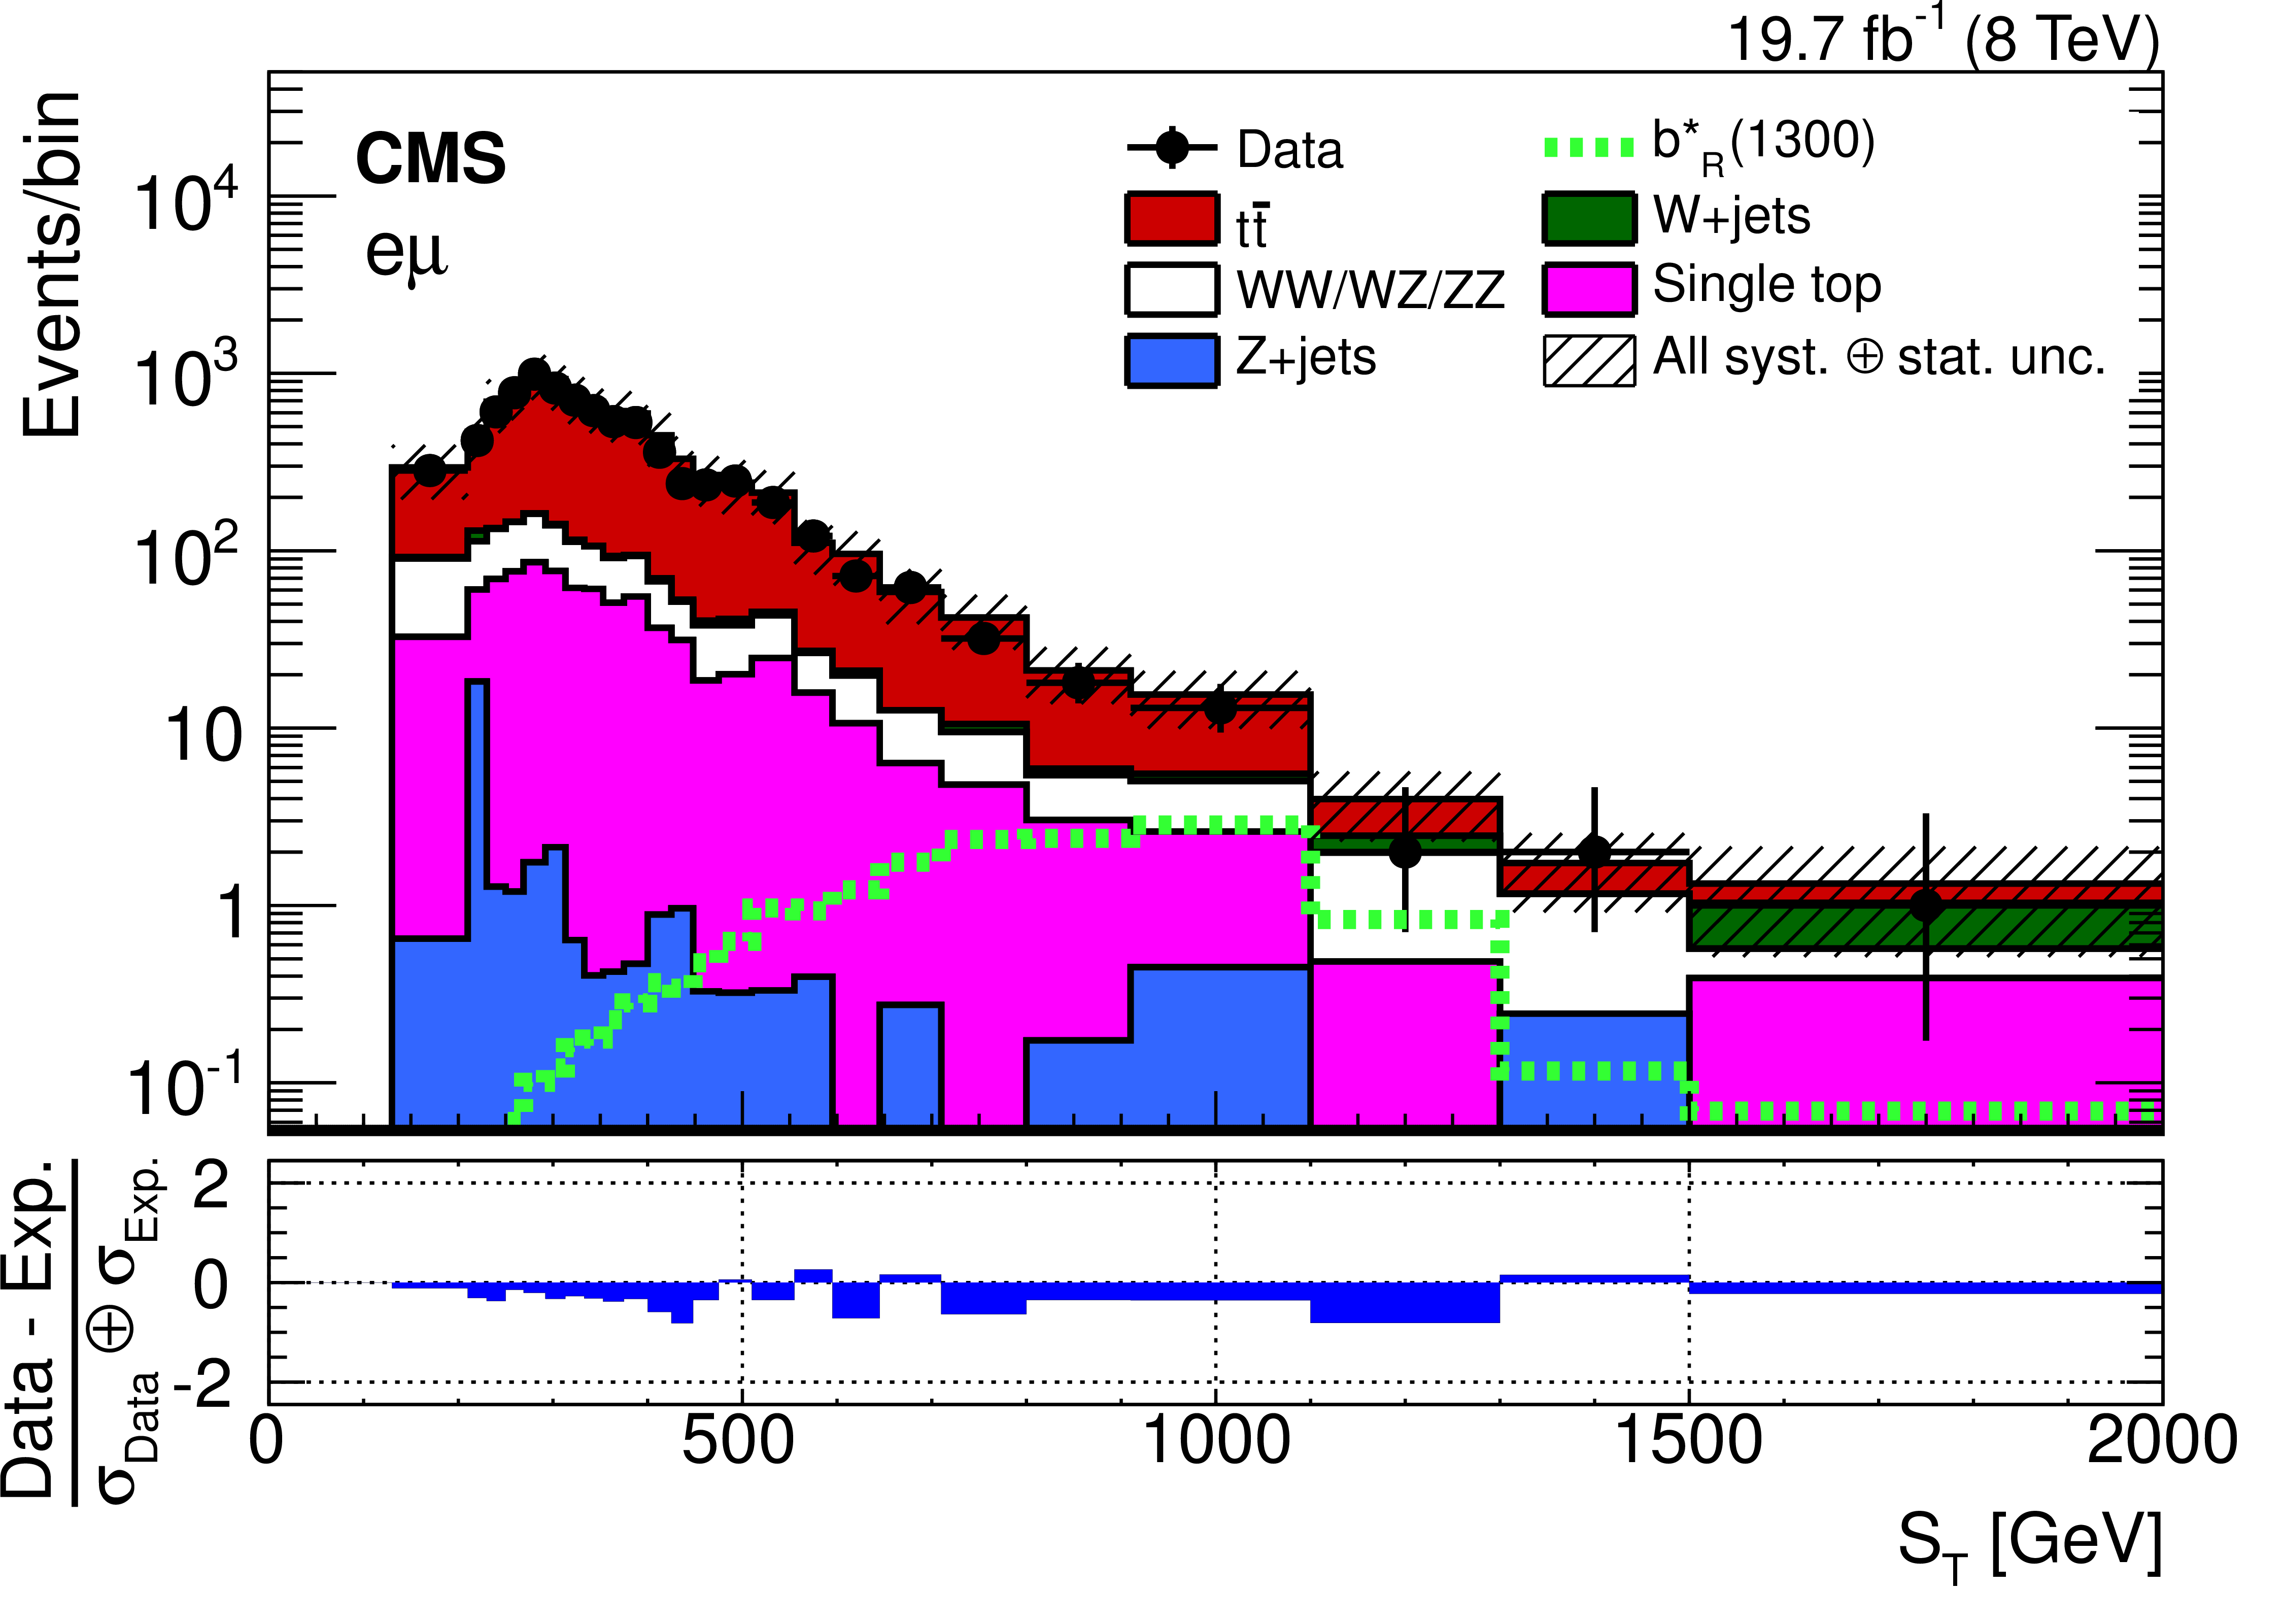
Figure 4-b:
The $S_{\rm T}$ distribution for data and simulated samples after the event selection is applied, for $ {\mathrm {e}} {\mathrm {e}}$ (a), $ {\mathrm {e}} {{\mu }}$ (b), $ {{\mu }} {{\mu }}$ (c), and inclusive dilepton (d) channels. The combined statistical and systematic uncertainties are indicated by the hatched band. The bottom plots show the pull ((data-background)/$\sigma _{\mathrm {Data}}\oplus \sigma _{\mathrm {Exp.}}$) between the data and the background estimate distributions. The symbols $\sigma _{\mathrm {Data}}$ and $\sigma _{\mathrm {Exp.}}$ refer to the statistical uncertainty in data, and the systematic uncertainty in the background, respectively. |
png pdf |
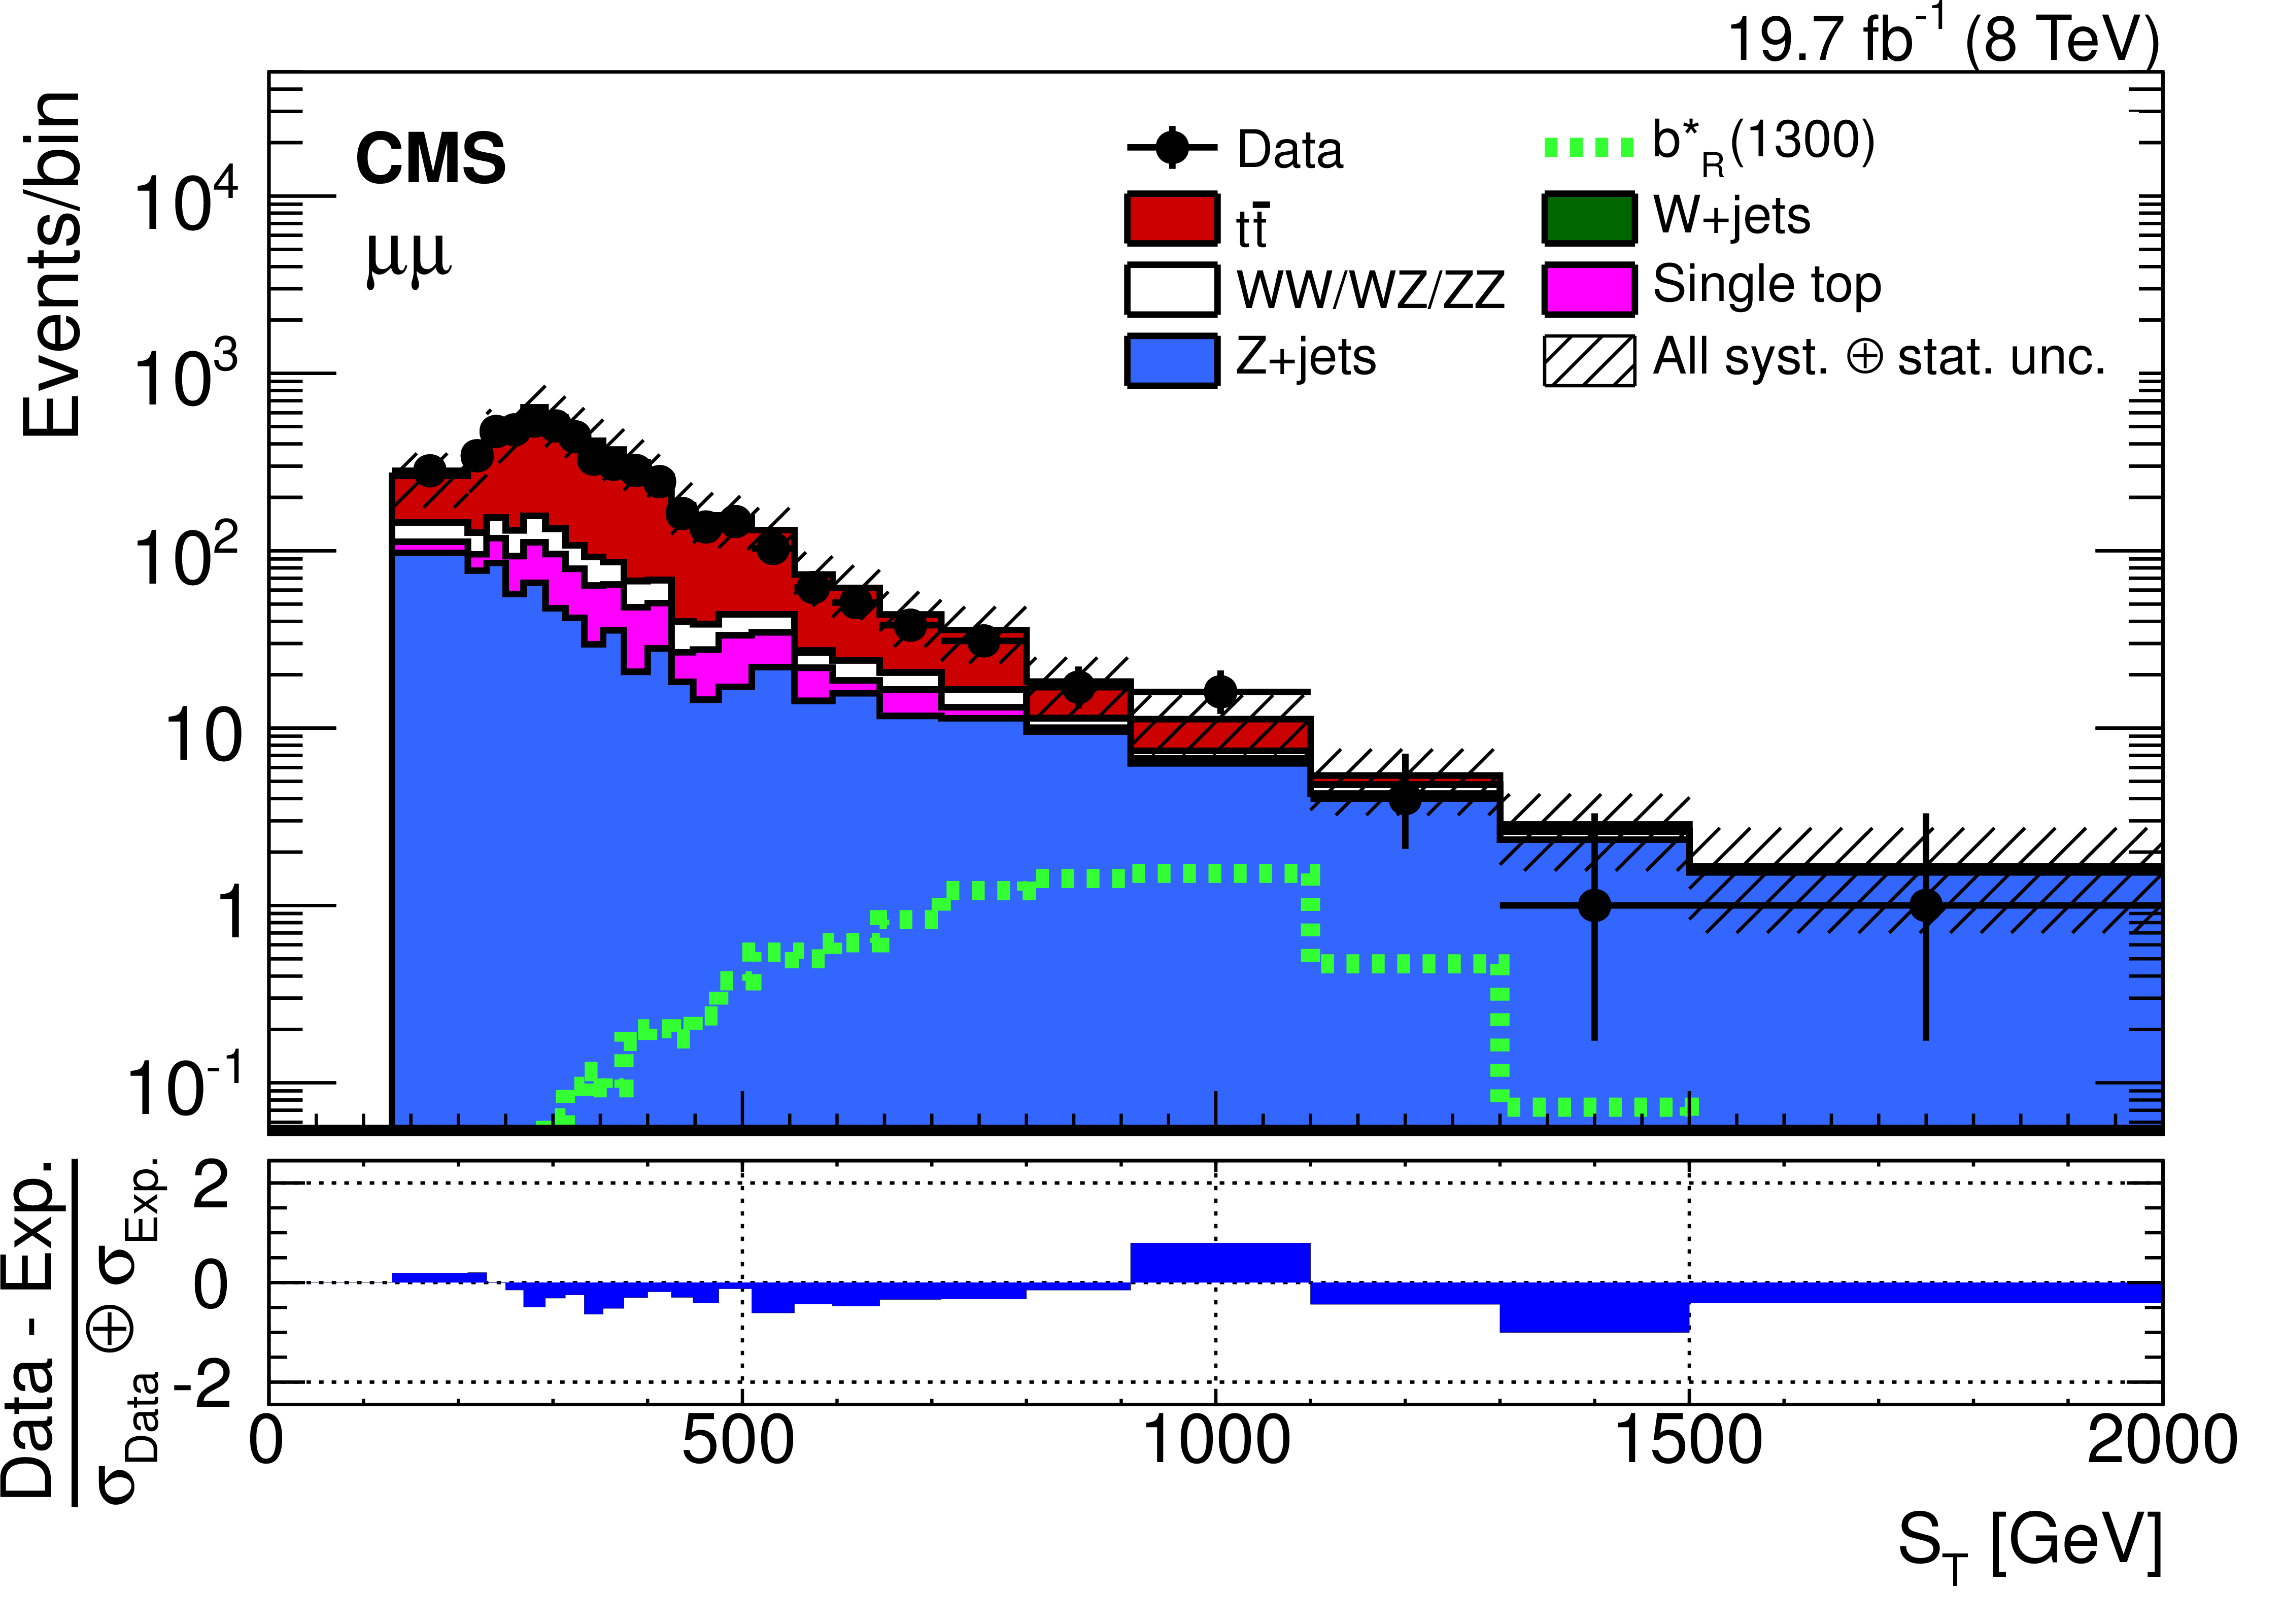
Figure 4-c:
The $S_{\rm T}$ distribution for data and simulated samples after the event selection is applied, for $ {\mathrm {e}} {\mathrm {e}}$ (a), $ {\mathrm {e}} {{\mu }}$ (b), $ {{\mu }} {{\mu }}$ (c), and inclusive dilepton (d) channels. The combined statistical and systematic uncertainties are indicated by the hatched band. The bottom plots show the pull ((data-background)/$\sigma _{\mathrm {Data}}\oplus \sigma _{\mathrm {Exp.}}$) between the data and the background estimate distributions. The symbols $\sigma _{\mathrm {Data}}$ and $\sigma _{\mathrm {Exp.}}$ refer to the statistical uncertainty in data, and the systematic uncertainty in the background, respectively. |
png pdf |
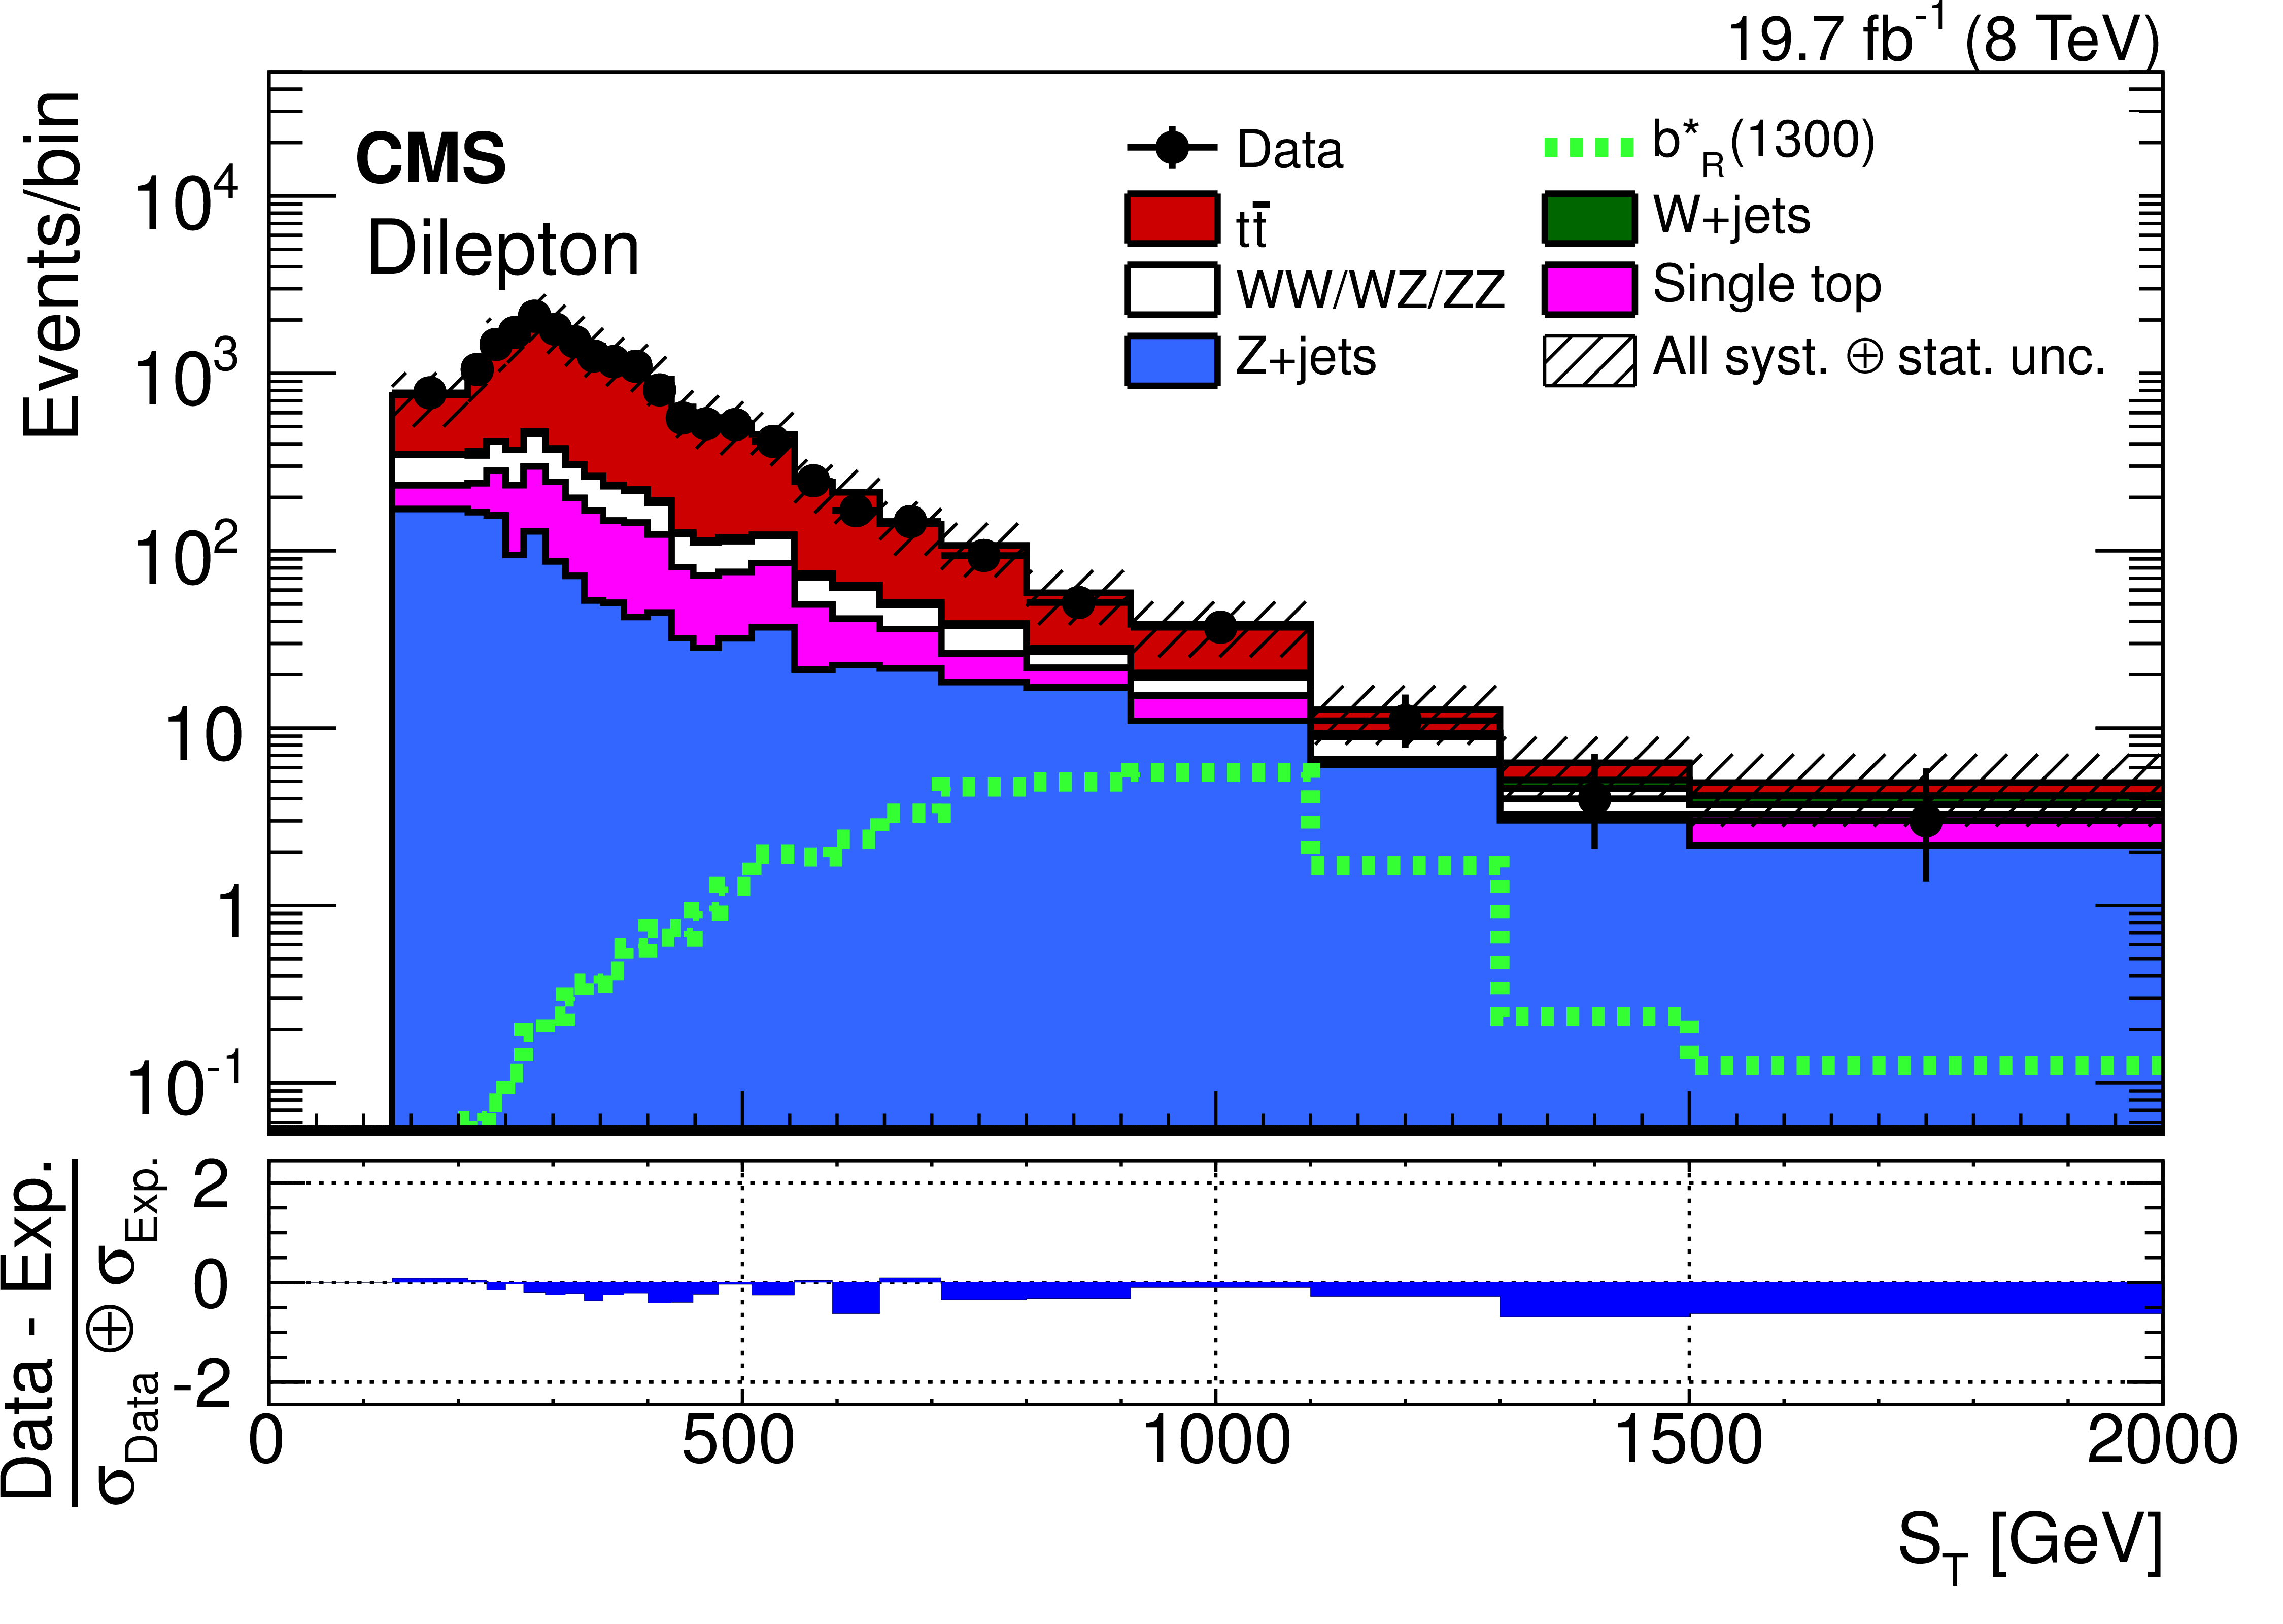
Figure 4-d:
The $S_{\rm T}$ distribution for data and simulated samples after the event selection is applied, for $ {\mathrm {e}} {\mathrm {e}}$ (a), $ {\mathrm {e}} {{\mu }}$ (b), $ {{\mu }} {{\mu }}$ (c), and inclusive dilepton (d) channels. The combined statistical and systematic uncertainties are indicated by the hatched band. The bottom plots show the pull ((data-background)/$\sigma _{\mathrm {Data}}\oplus \sigma _{\mathrm {Exp.}}$) between the data and the background estimate distributions. The symbols $\sigma _{\mathrm {Data}}$ and $\sigma _{\mathrm {Exp.}}$ refer to the statistical uncertainty in data, and the systematic uncertainty in the background, respectively. |
png pdf |
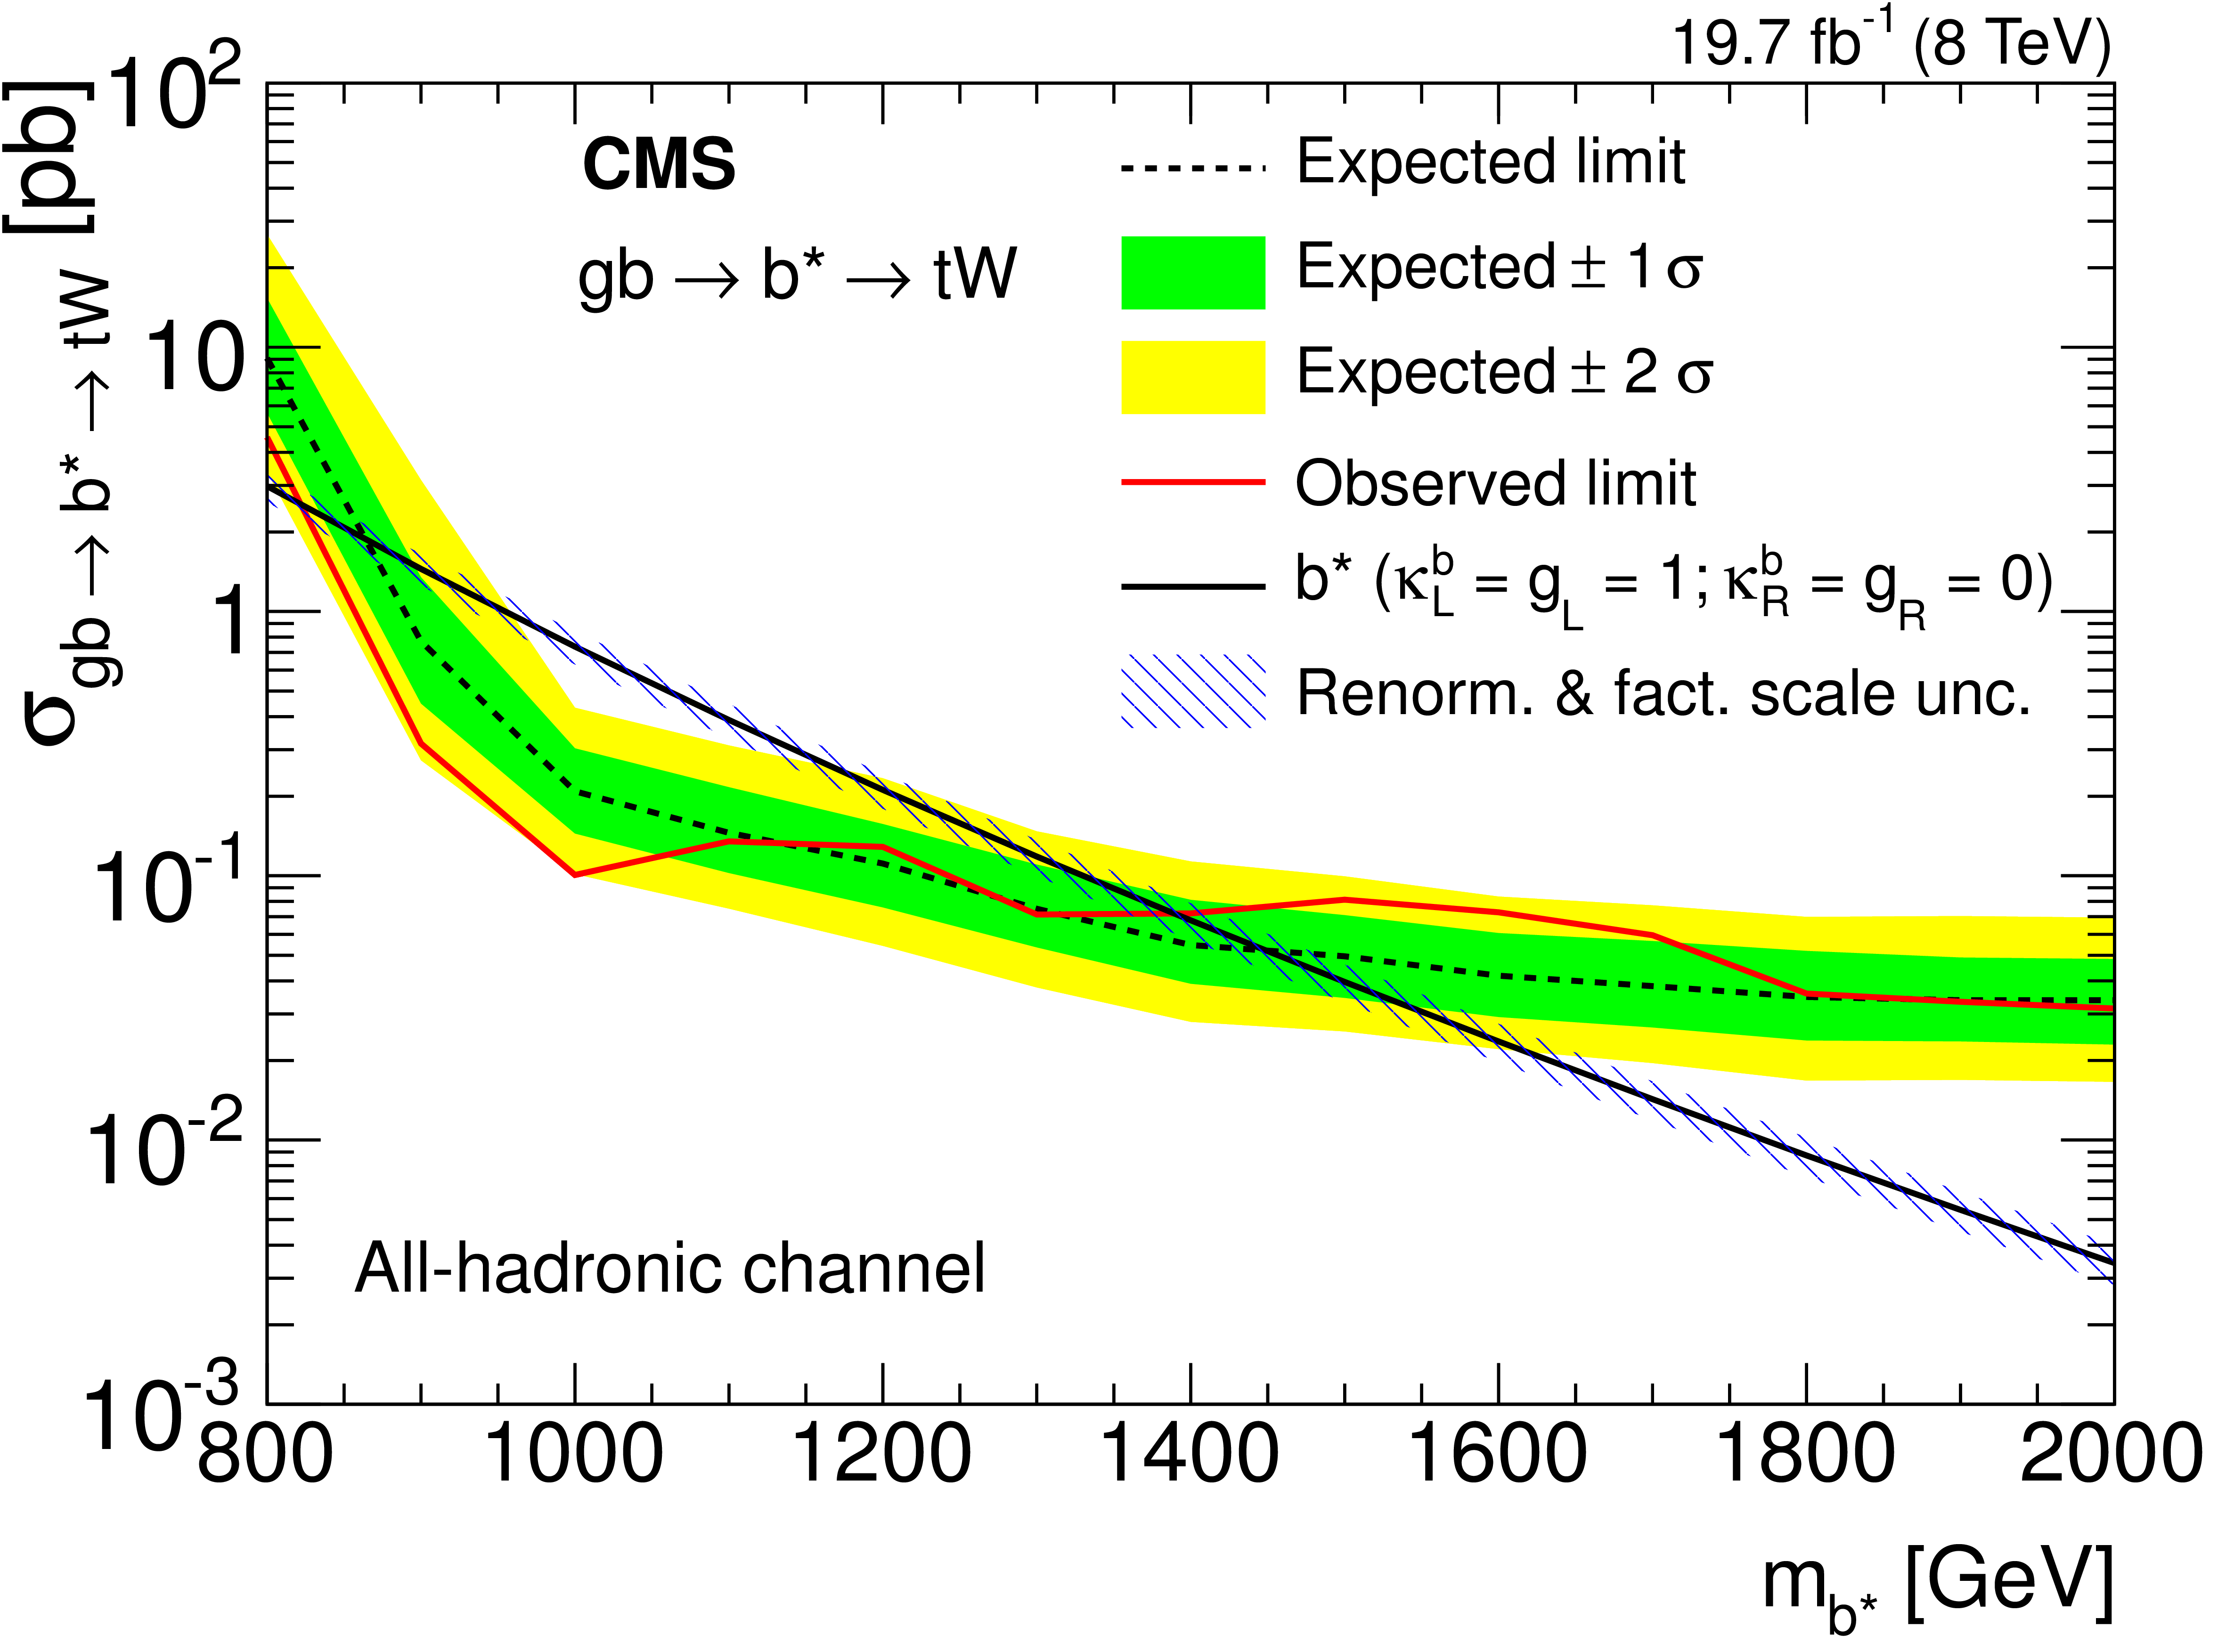
Figure 5-a:
The expected (dashed) and observed (solid) production cross section limits at 95% CL for the all-hadronic channel as a function of $ { {\mathrm {b}} ^*} $ quark mass for $ {\mathrm {g}} {\mathrm {q_b}}\to { {\mathrm {b}} ^*} {\mathrm {t}} {\mathrm {W}}$. The theoretical cross section (solid line with hatched area) is also shown for comparison. The $1\sigma $ and $2\sigma $ uncertainties in the expected limit bands are shown. Limits for the left-handed, right-handed, and vector-like $ { {\mathrm {b}} ^*} $ quark coupling hypotheses are shown in the a, b, and c plots, respectively. |
png pdf |
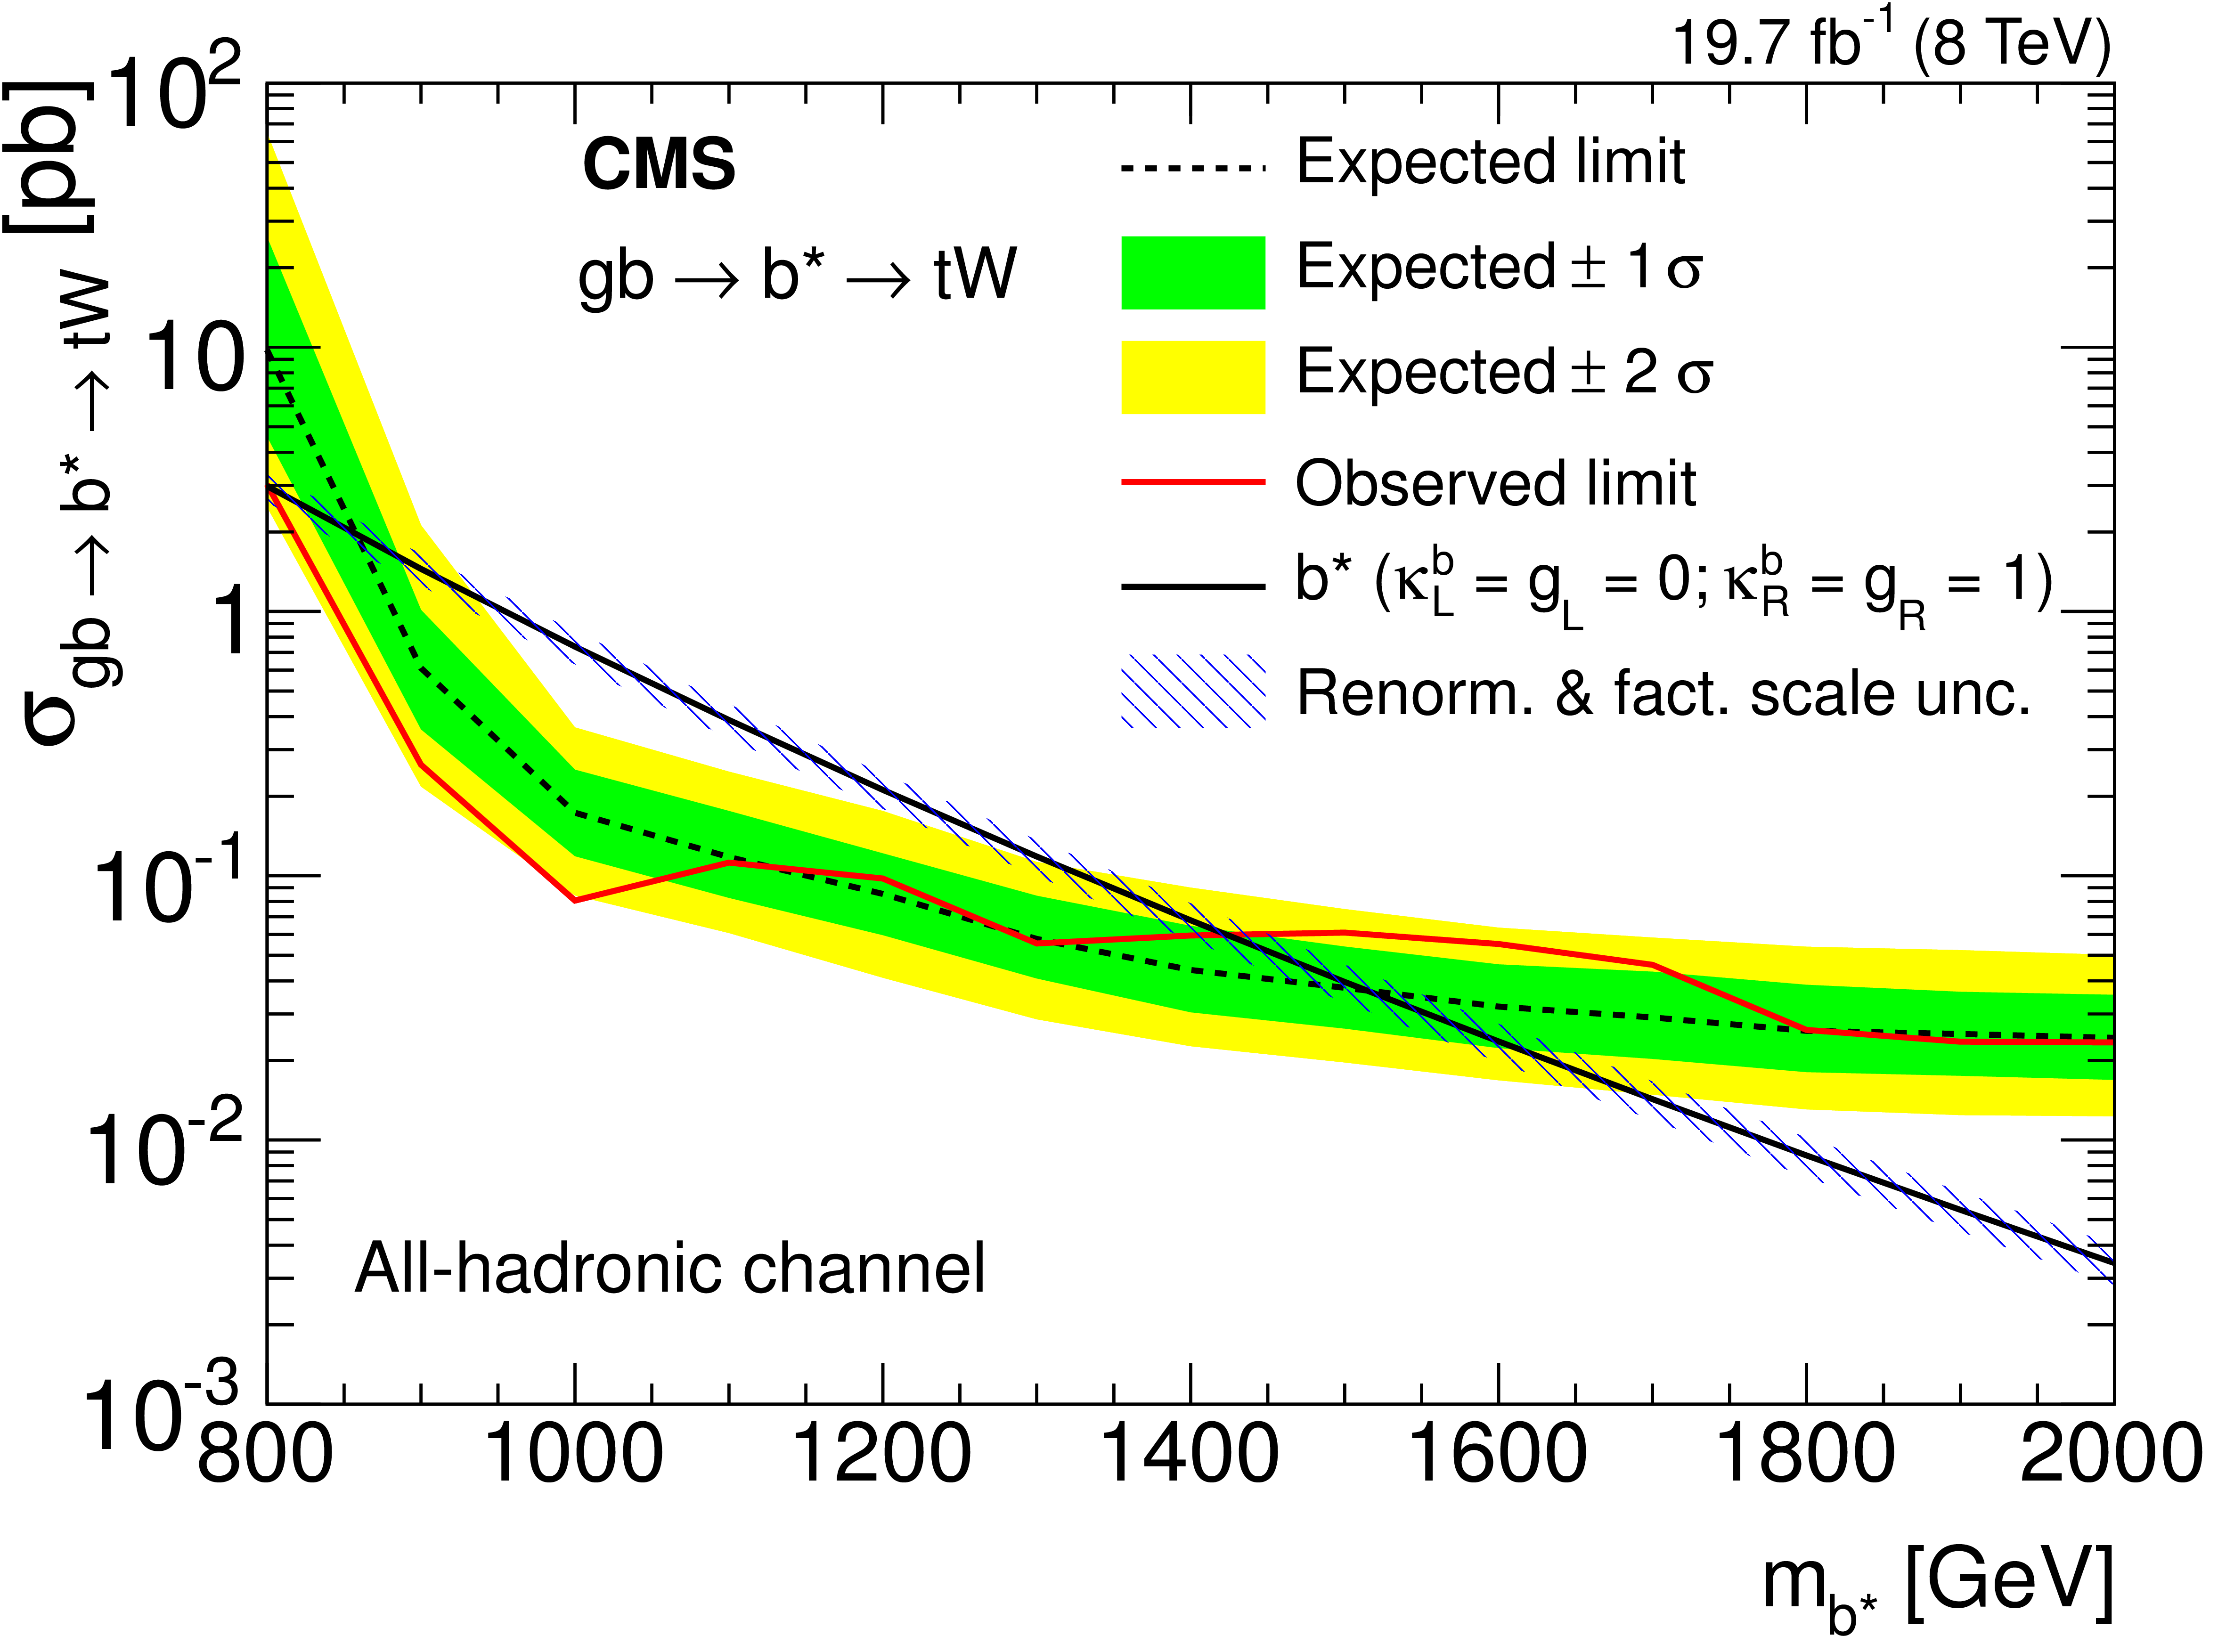
Figure 5-b:
The expected (dashed) and observed (solid) production cross section limits at 95% CL for the all-hadronic channel as a function of $ { {\mathrm {b}} ^*} $ quark mass for $ {\mathrm {g}} {\mathrm {q_b}}\to { {\mathrm {b}} ^*} {\mathrm {t}} {\mathrm {W}}$. The theoretical cross section (solid line with hatched area) is also shown for comparison. The $1\sigma $ and $2\sigma $ uncertainties in the expected limit bands are shown. Limits for the left-handed, right-handed, and vector-like $ { {\mathrm {b}} ^*} $ quark coupling hypotheses are shown in the a, b, and c plots, respectively. |
png pdf |
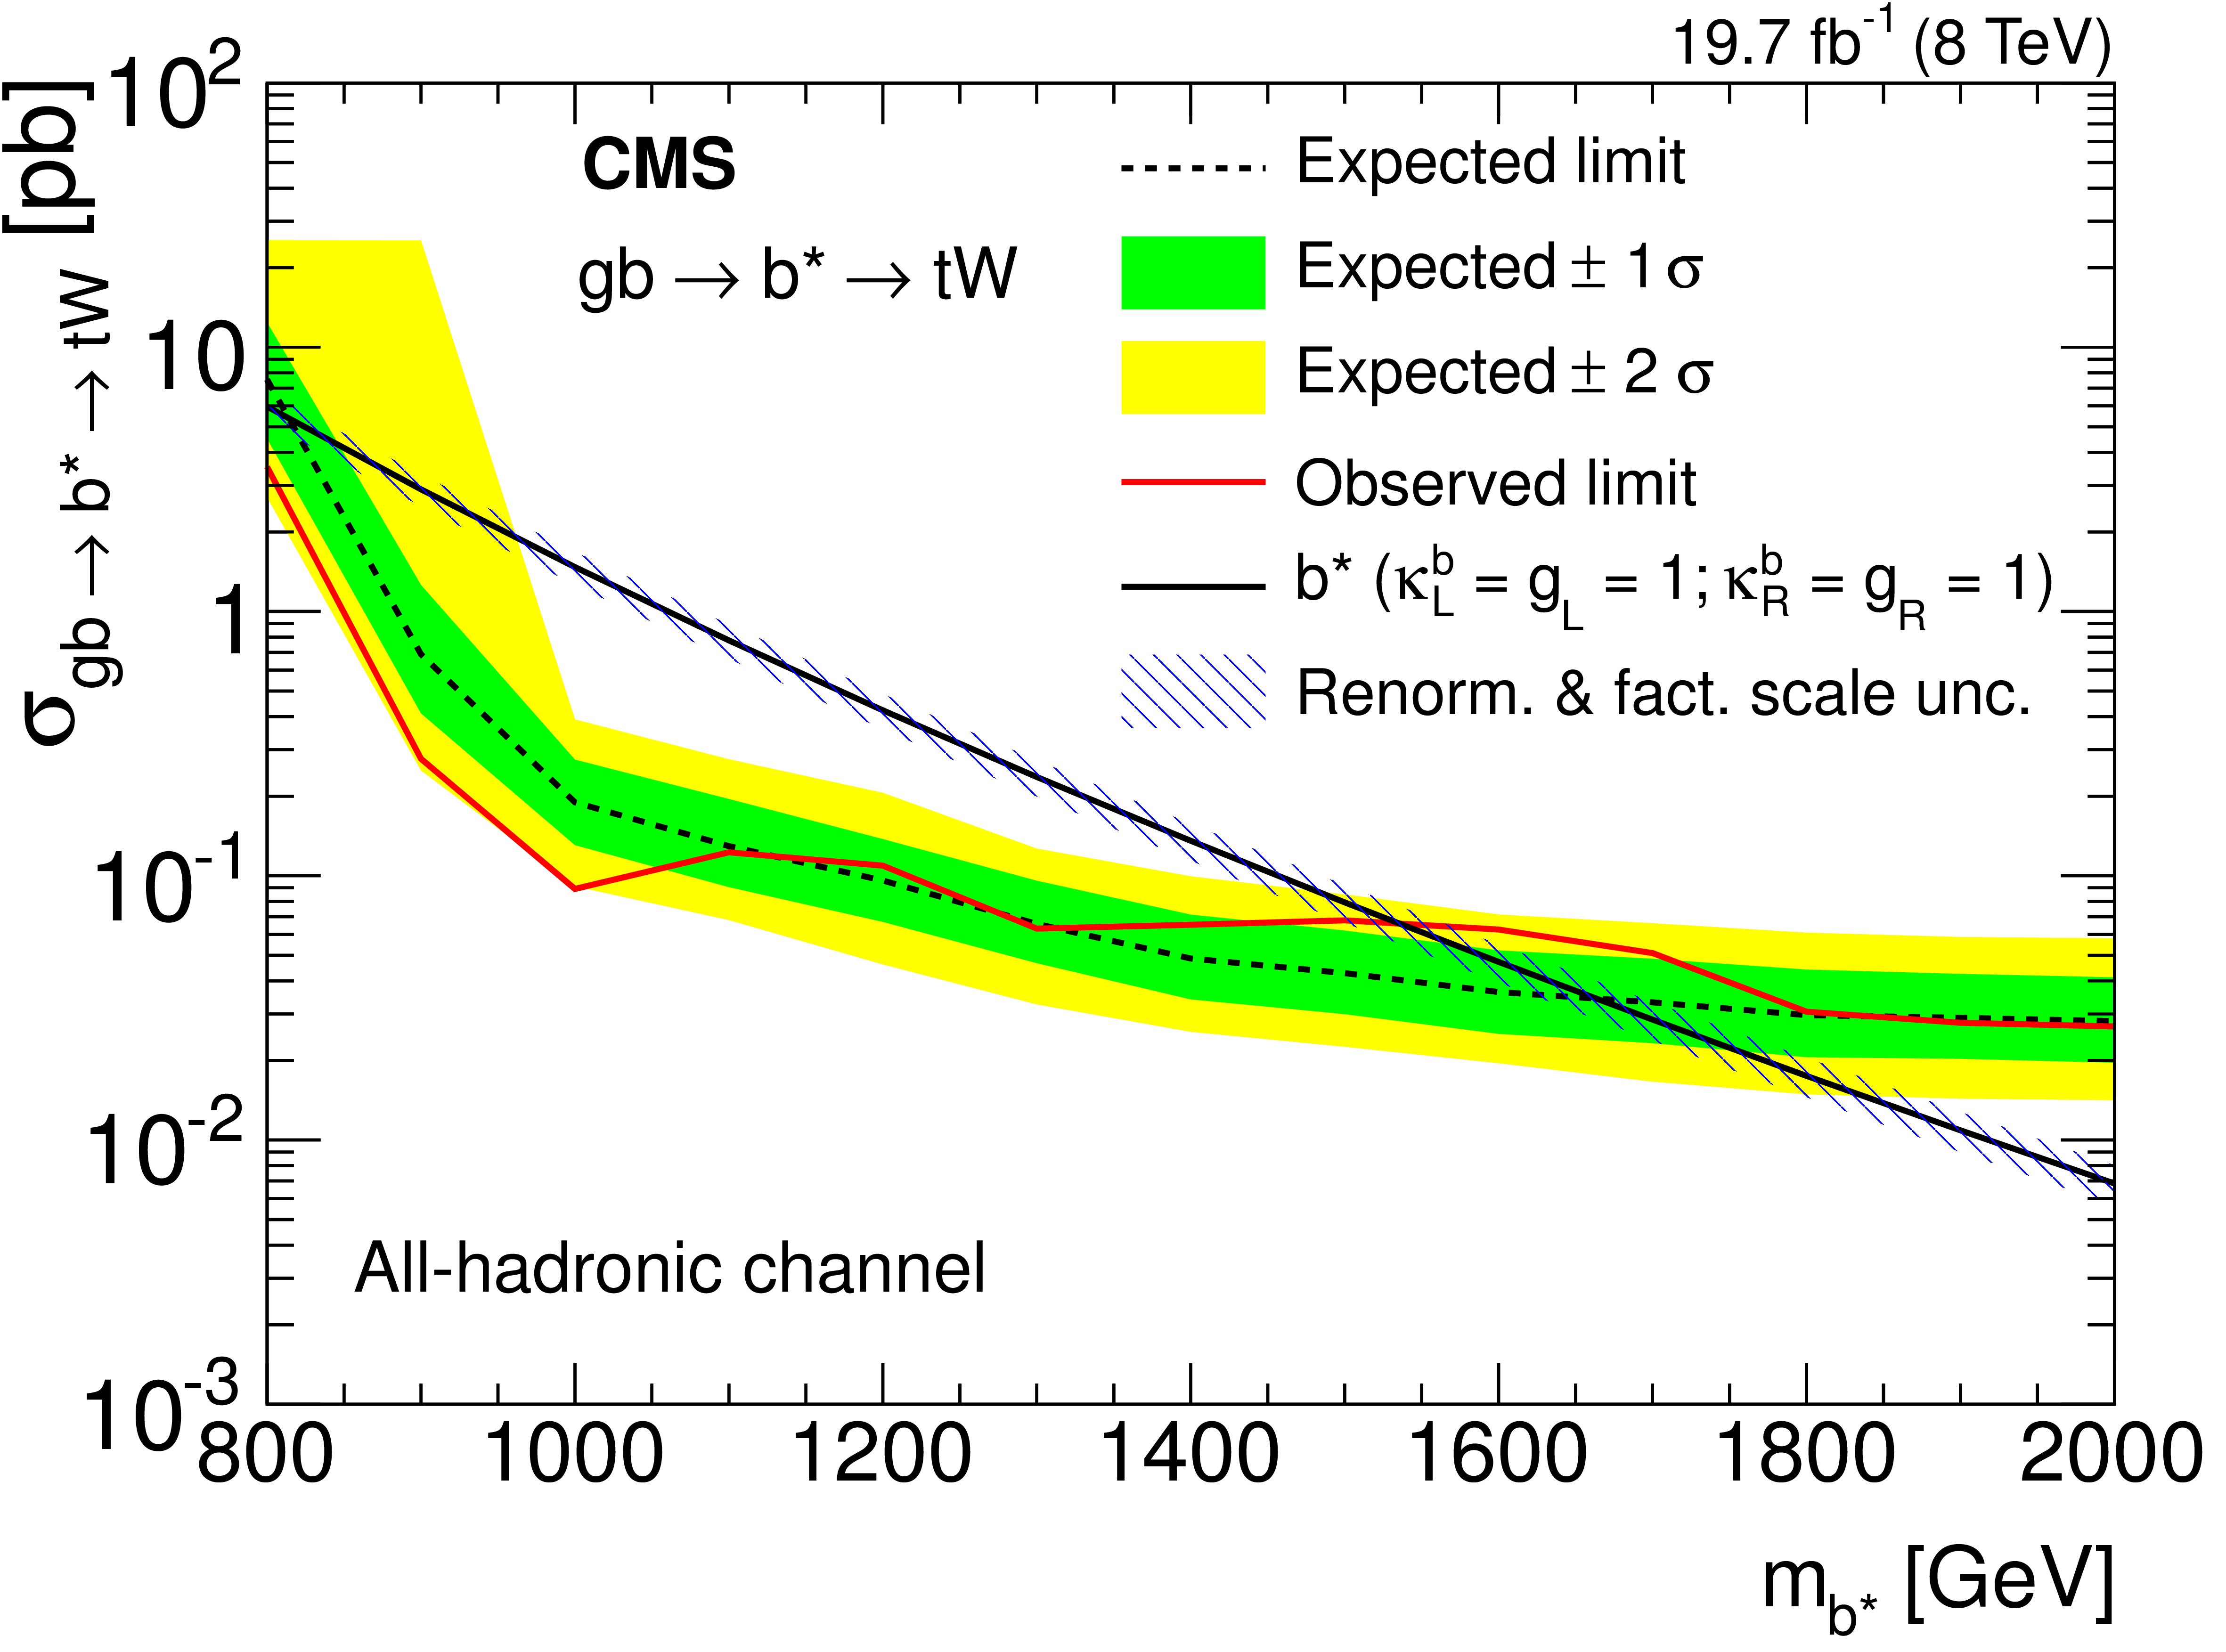
Figure 5-c:
The expected (dashed) and observed (solid) production cross section limits at 95% CL for the all-hadronic channel as a function of $ { {\mathrm {b}} ^*} $ quark mass for $ {\mathrm {g}} {\mathrm {q_b}}\to { {\mathrm {b}} ^*} {\mathrm {t}} {\mathrm {W}}$. The theoretical cross section (solid line with hatched area) is also shown for comparison. The $1\sigma $ and $2\sigma $ uncertainties in the expected limit bands are shown. Limits for the left-handed, right-handed, and vector-like $ { {\mathrm {b}} ^*} $ quark coupling hypotheses are shown in the a, b, and c plots, respectively. |
png pdf |
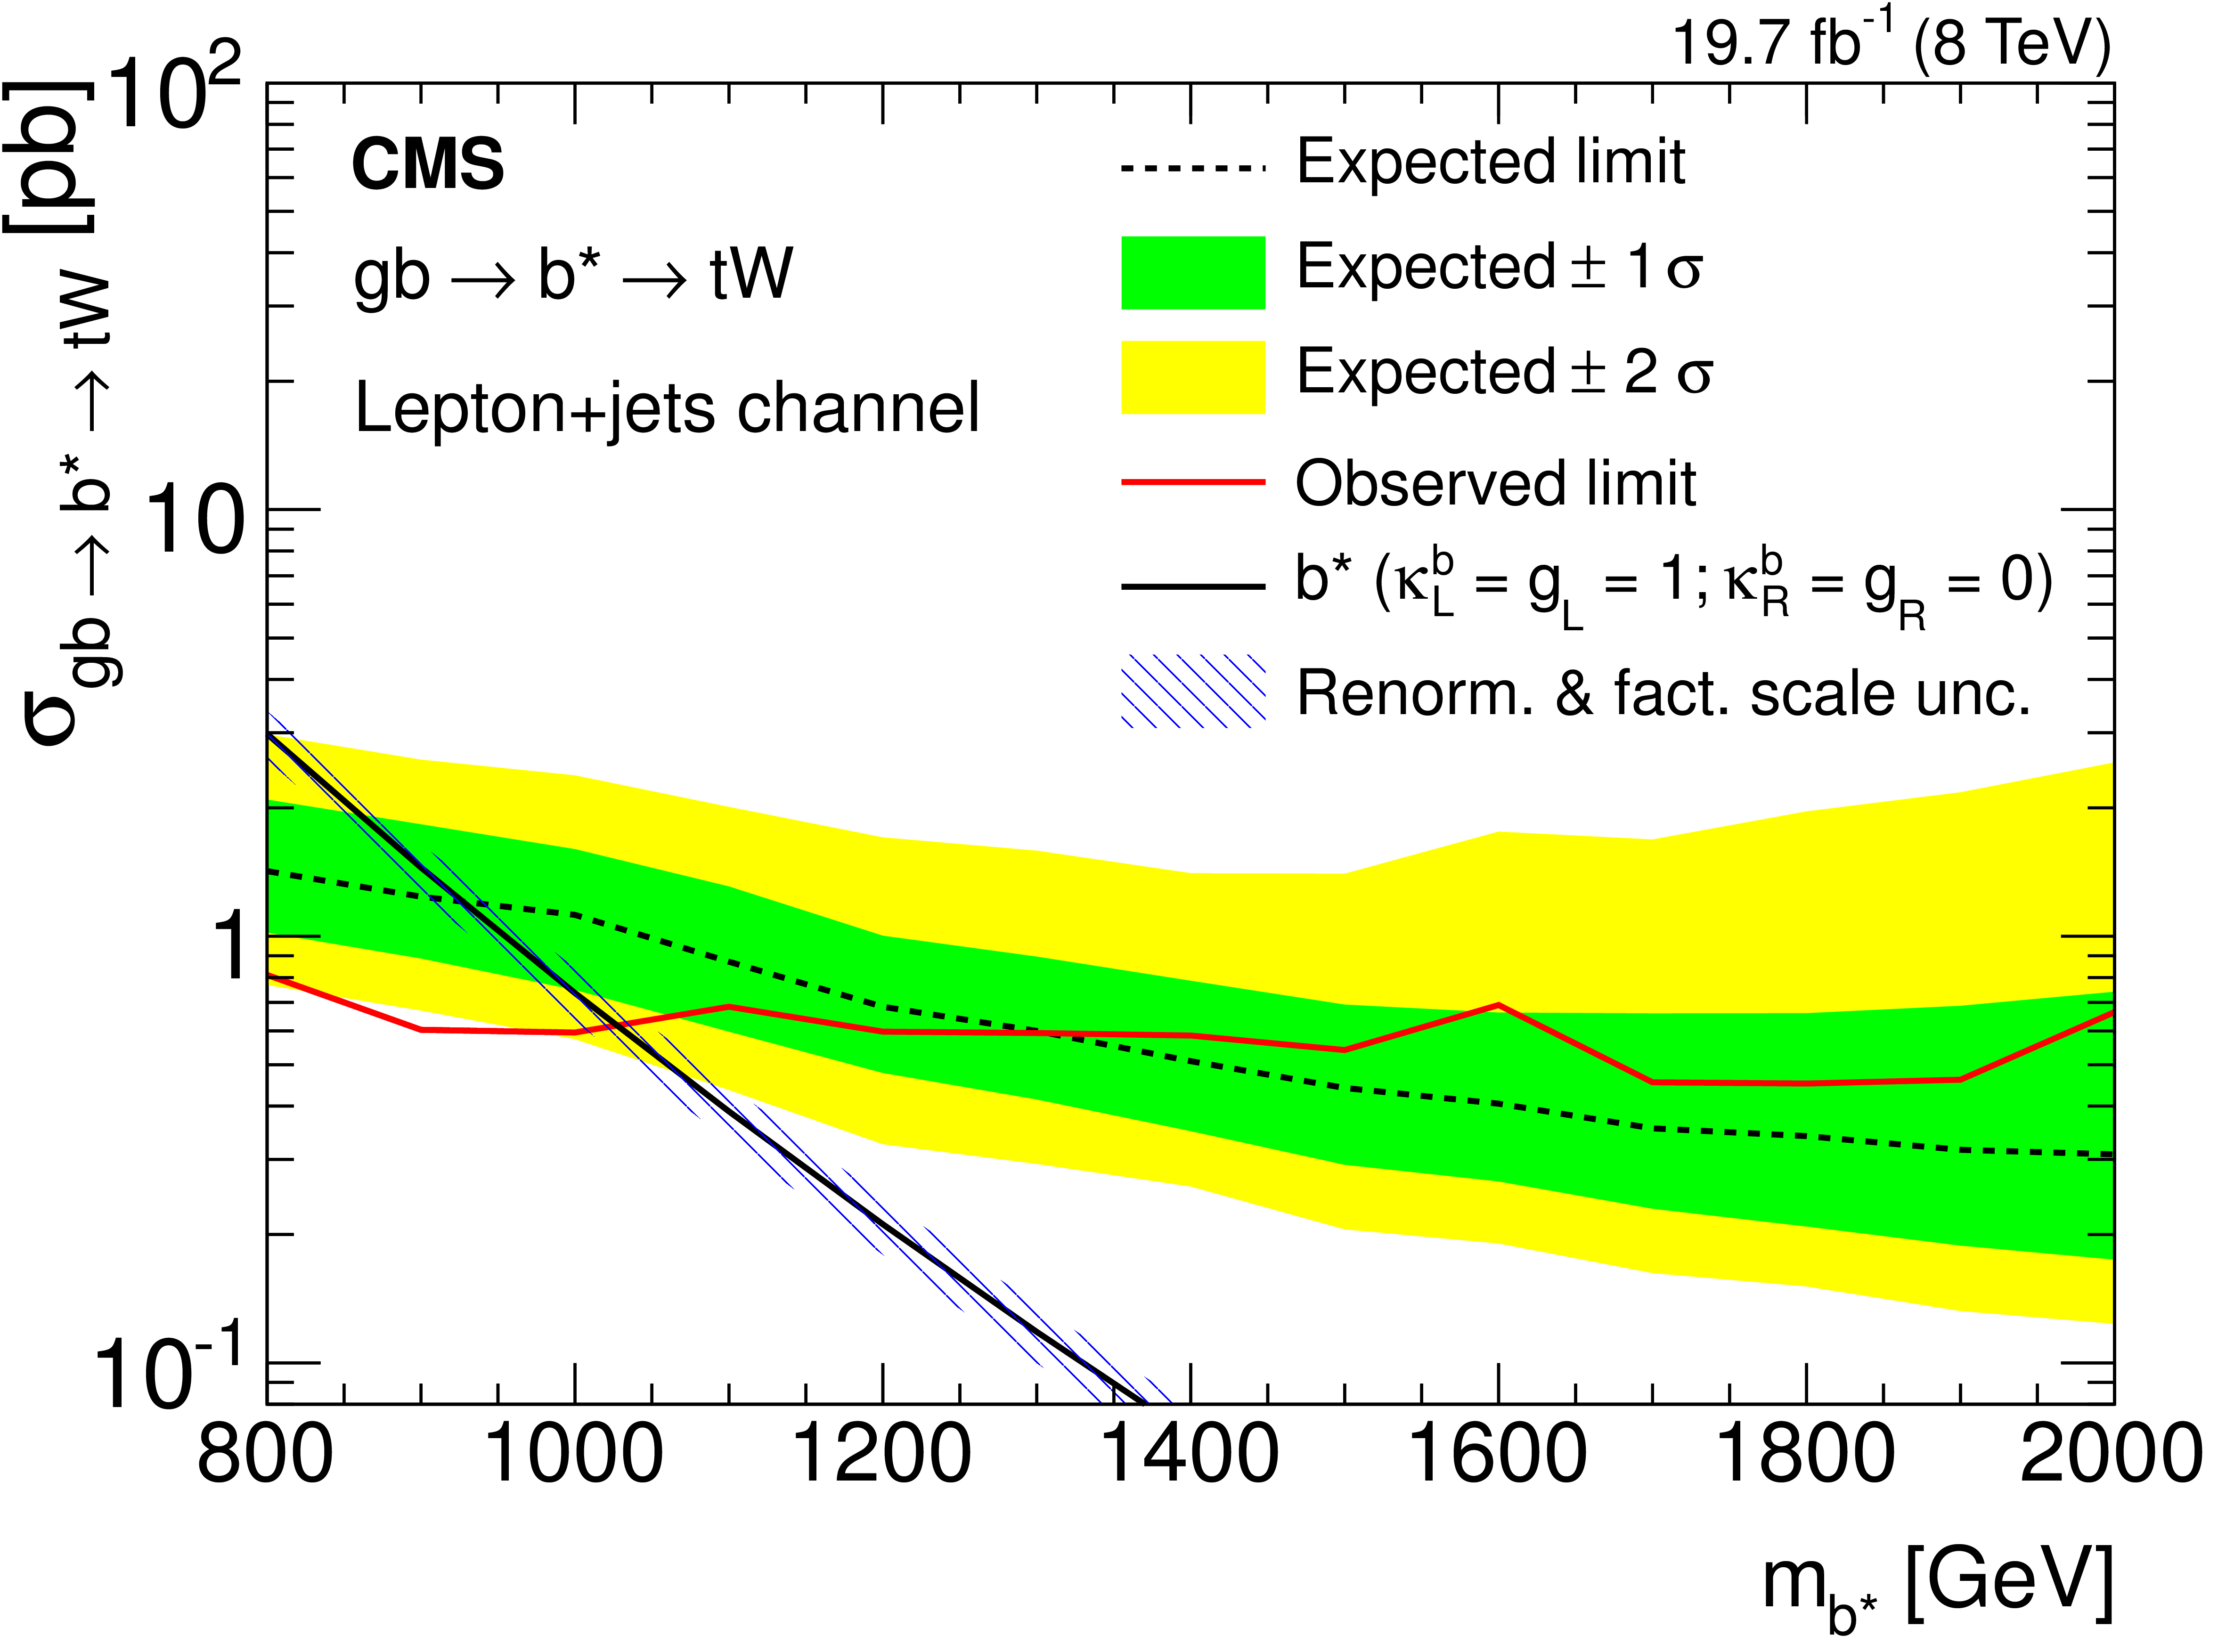
Figure 6-a:
The expected (dashed) and observed (solid) production cross section limits at 95% CL for the lepton+jets channel as a function of $ { {\mathrm {b}} ^*} $ quark mass for $ {\mathrm {g}} {\mathrm {q_b}}\to { {\mathrm {b}} ^*} {\mathrm {t}} {\mathrm {W}}$. The theoretical cross section (solid line with hatched area) is also shown for comparison. The $1\sigma $ and $2\sigma $ uncertainties in the expected limit bands are shown. Limits for the left-handed, right-handed, and vector-like $ { {\mathrm {b}} ^*} $ quark coupling hypotheses are shown in the a, b, and c plots, respectively. |
png pdf |
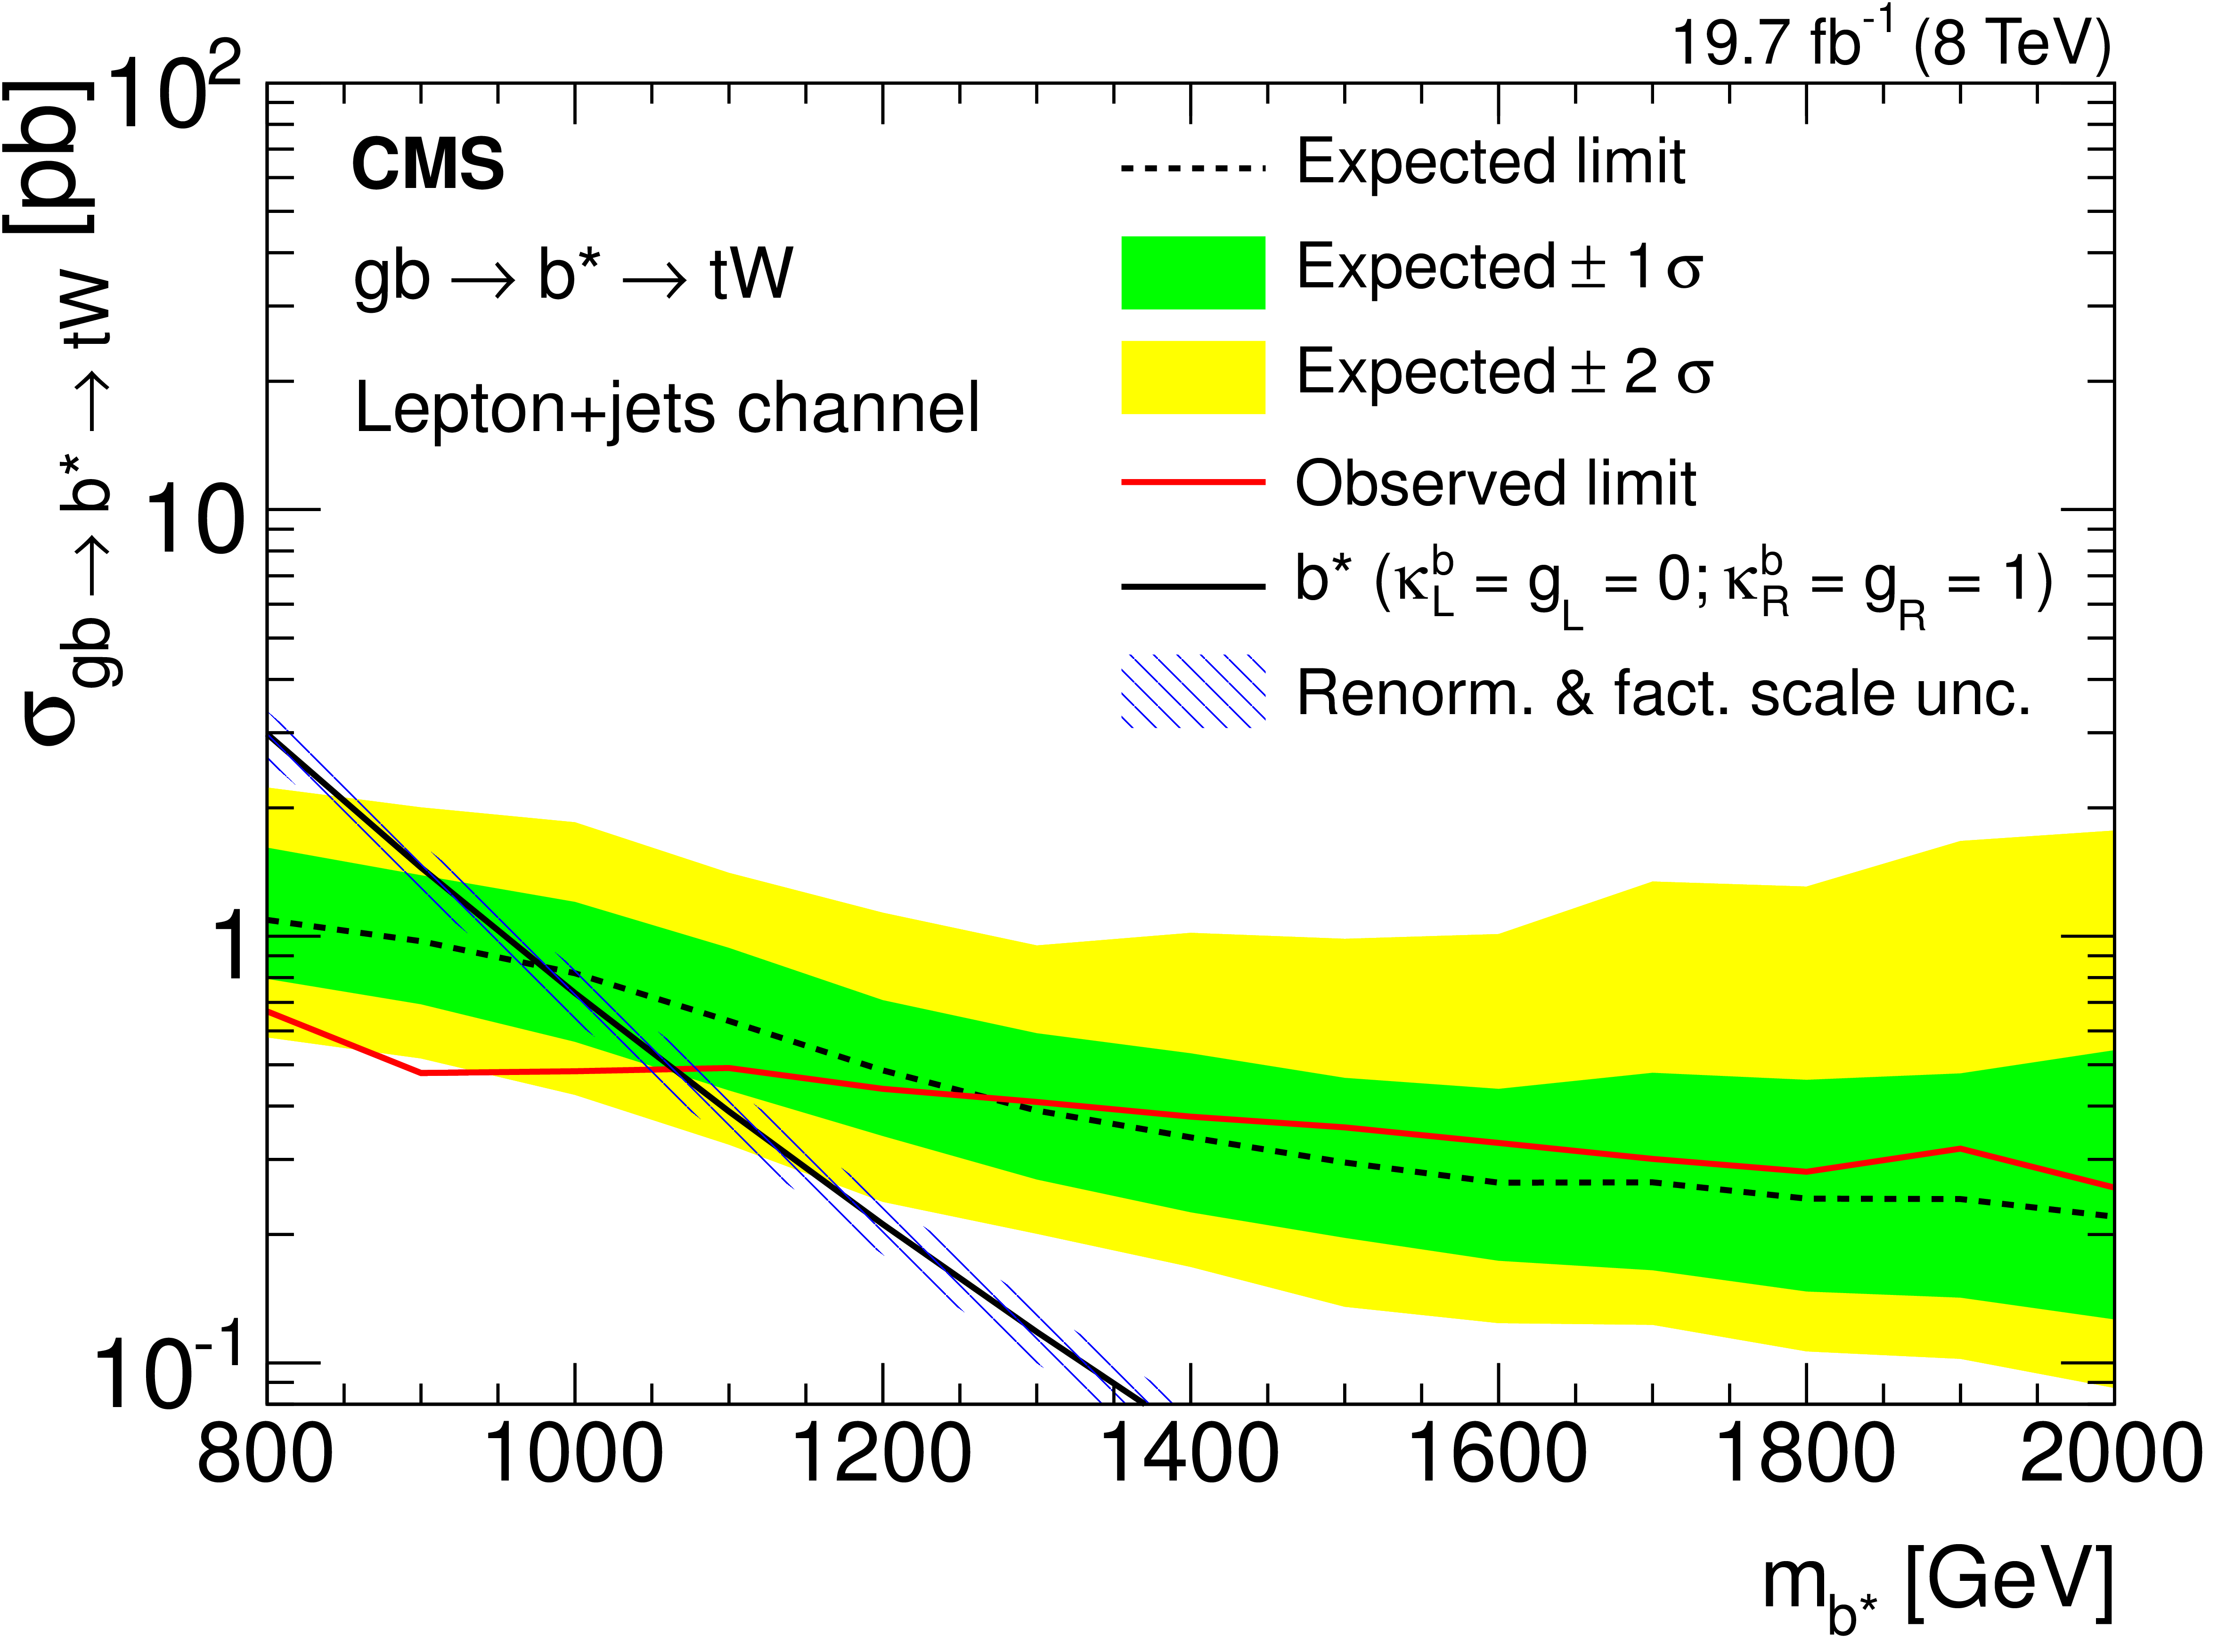
Figure 6-b:
The expected (dashed) and observed (solid) production cross section limits at 95% CL for the lepton+jets channel as a function of $ { {\mathrm {b}} ^*} $ quark mass for $ {\mathrm {g}} {\mathrm {q_b}}\to { {\mathrm {b}} ^*} {\mathrm {t}} {\mathrm {W}}$. The theoretical cross section (solid line with hatched area) is also shown for comparison. The $1\sigma $ and $2\sigma $ uncertainties in the expected limit bands are shown. Limits for the left-handed, right-handed, and vector-like $ { {\mathrm {b}} ^*} $ quark coupling hypotheses are shown in the a, b, and c plots, respectively. |
png pdf |
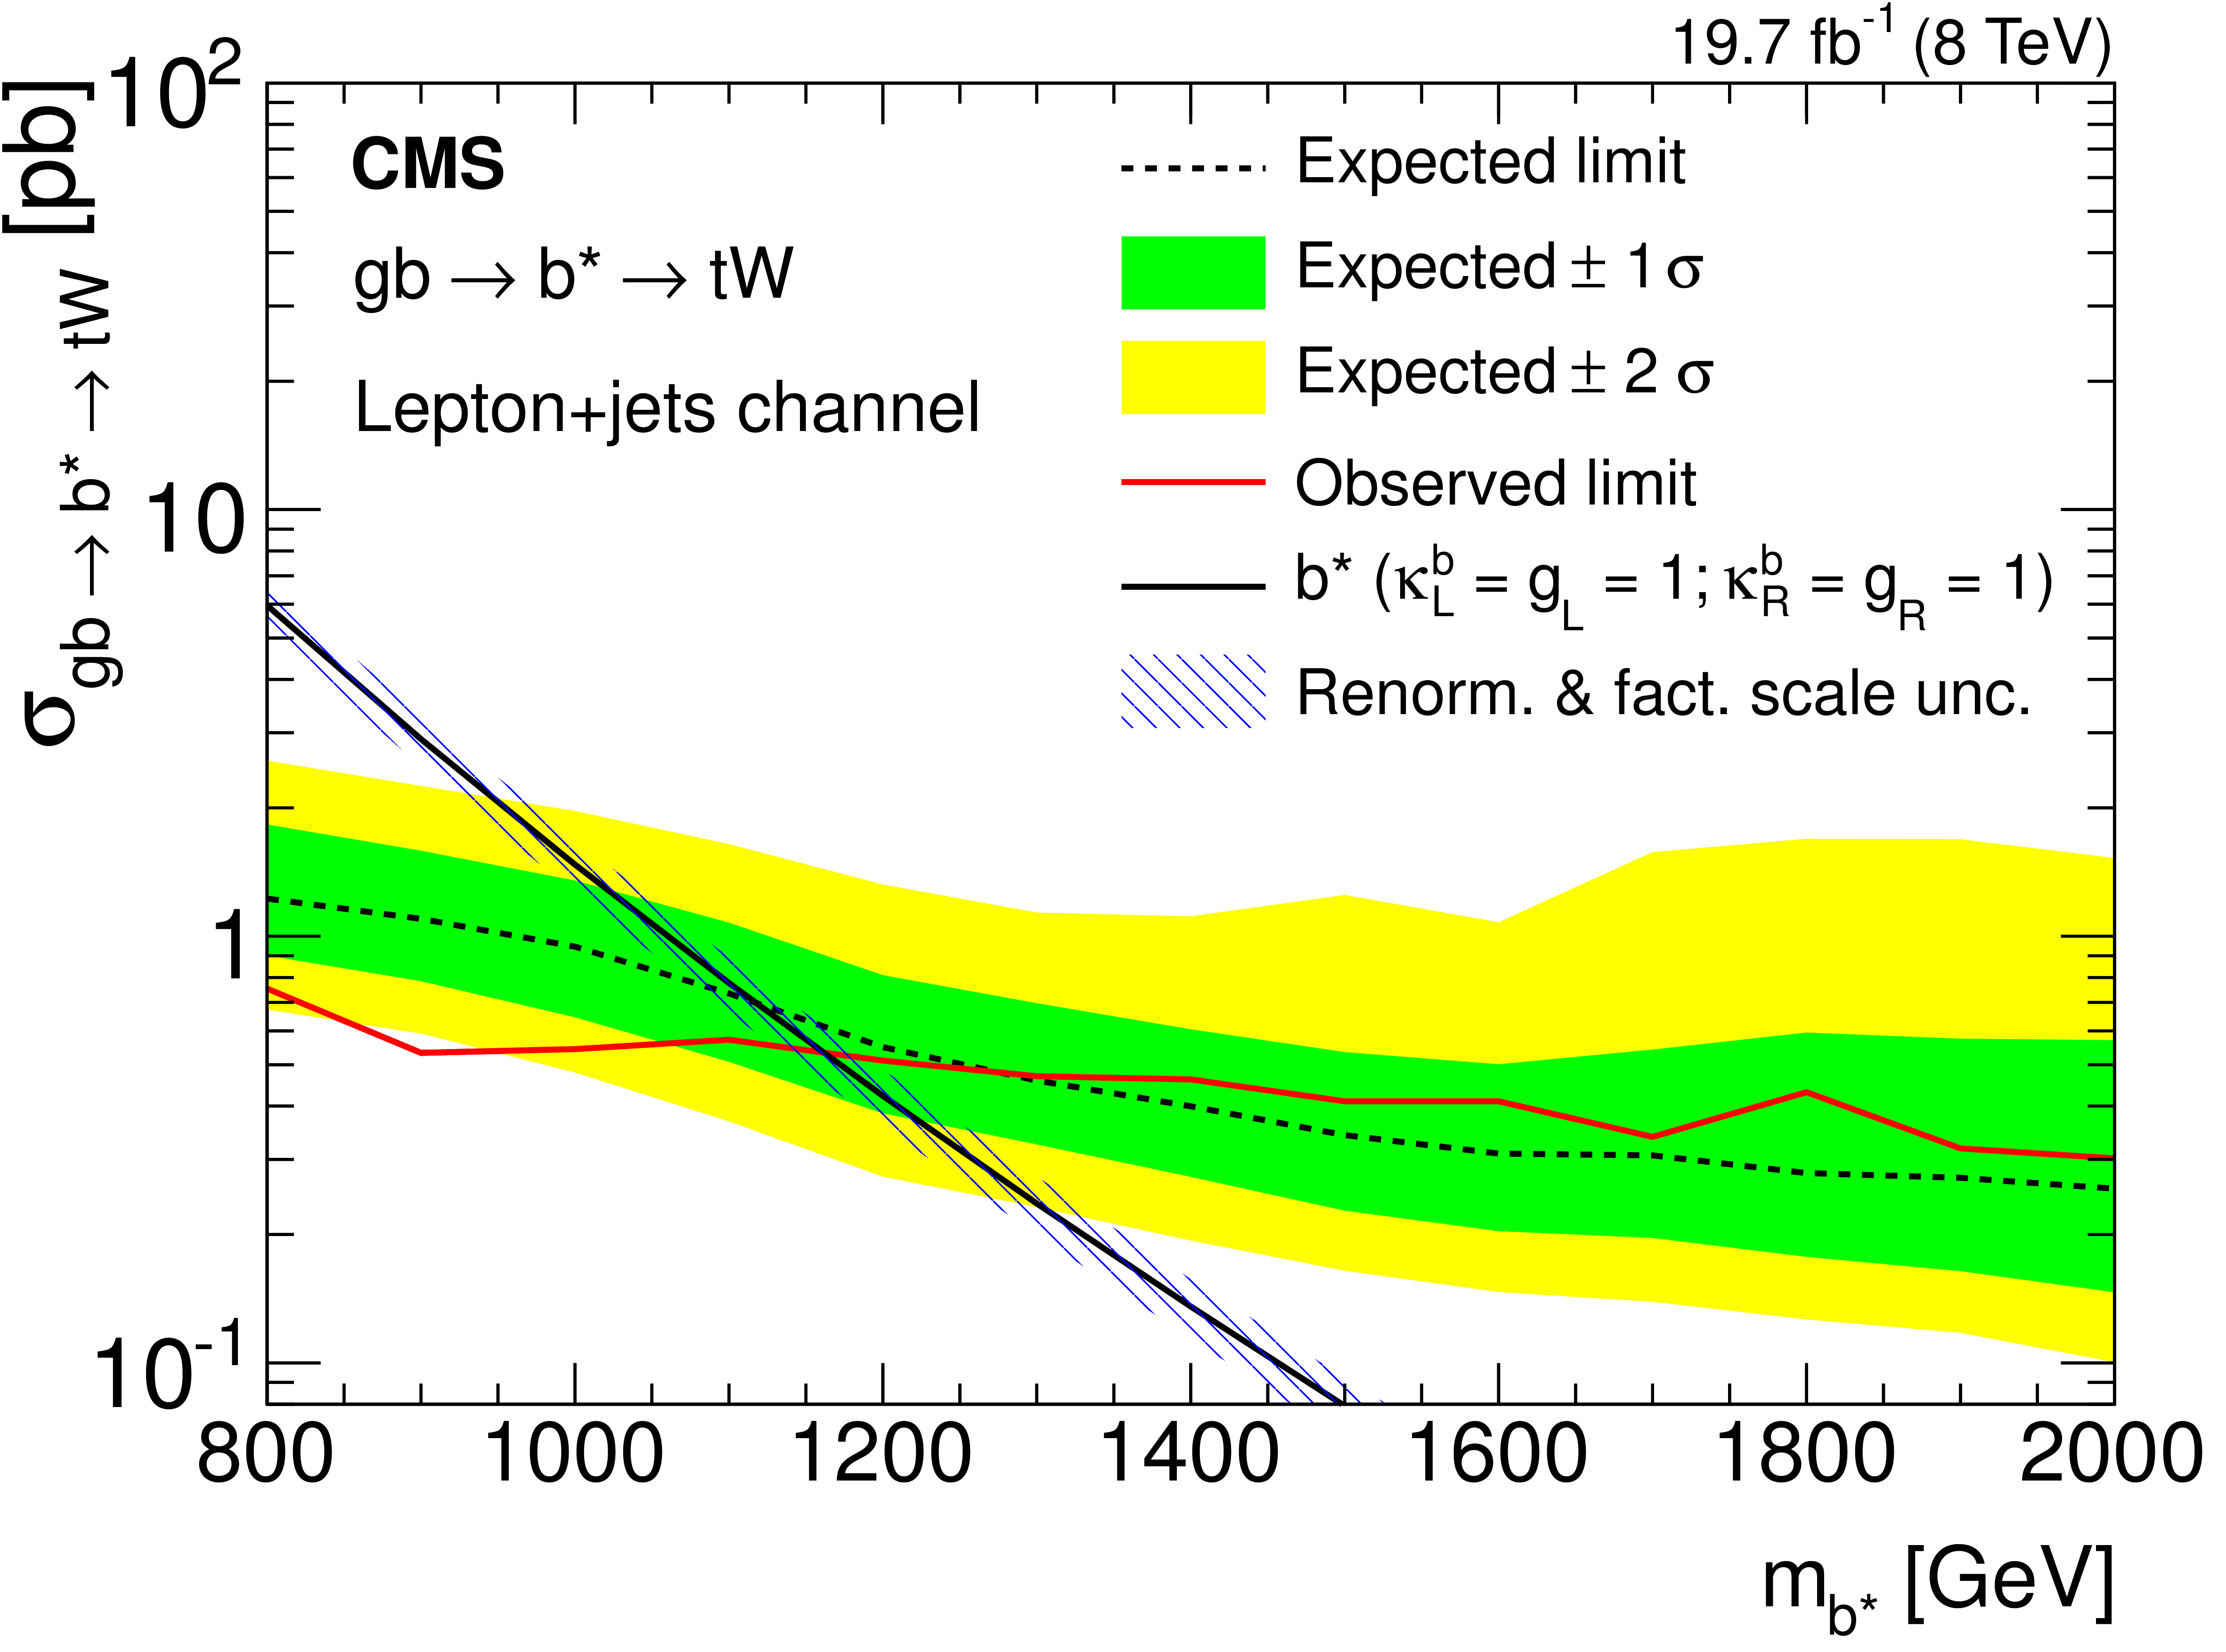
Figure 6-c:
The expected (dashed) and observed (solid) production cross section limits at 95% CL for the lepton+jets channel as a function of $ { {\mathrm {b}} ^*} $ quark mass for $ {\mathrm {g}} {\mathrm {q_b}}\to { {\mathrm {b}} ^*} {\mathrm {t}} {\mathrm {W}}$. The theoretical cross section (solid line with hatched area) is also shown for comparison. The $1\sigma $ and $2\sigma $ uncertainties in the expected limit bands are shown. Limits for the left-handed, right-handed, and vector-like $ { {\mathrm {b}} ^*} $ quark coupling hypotheses are shown in the a, b, and c plots, respectively. |
png pdf |
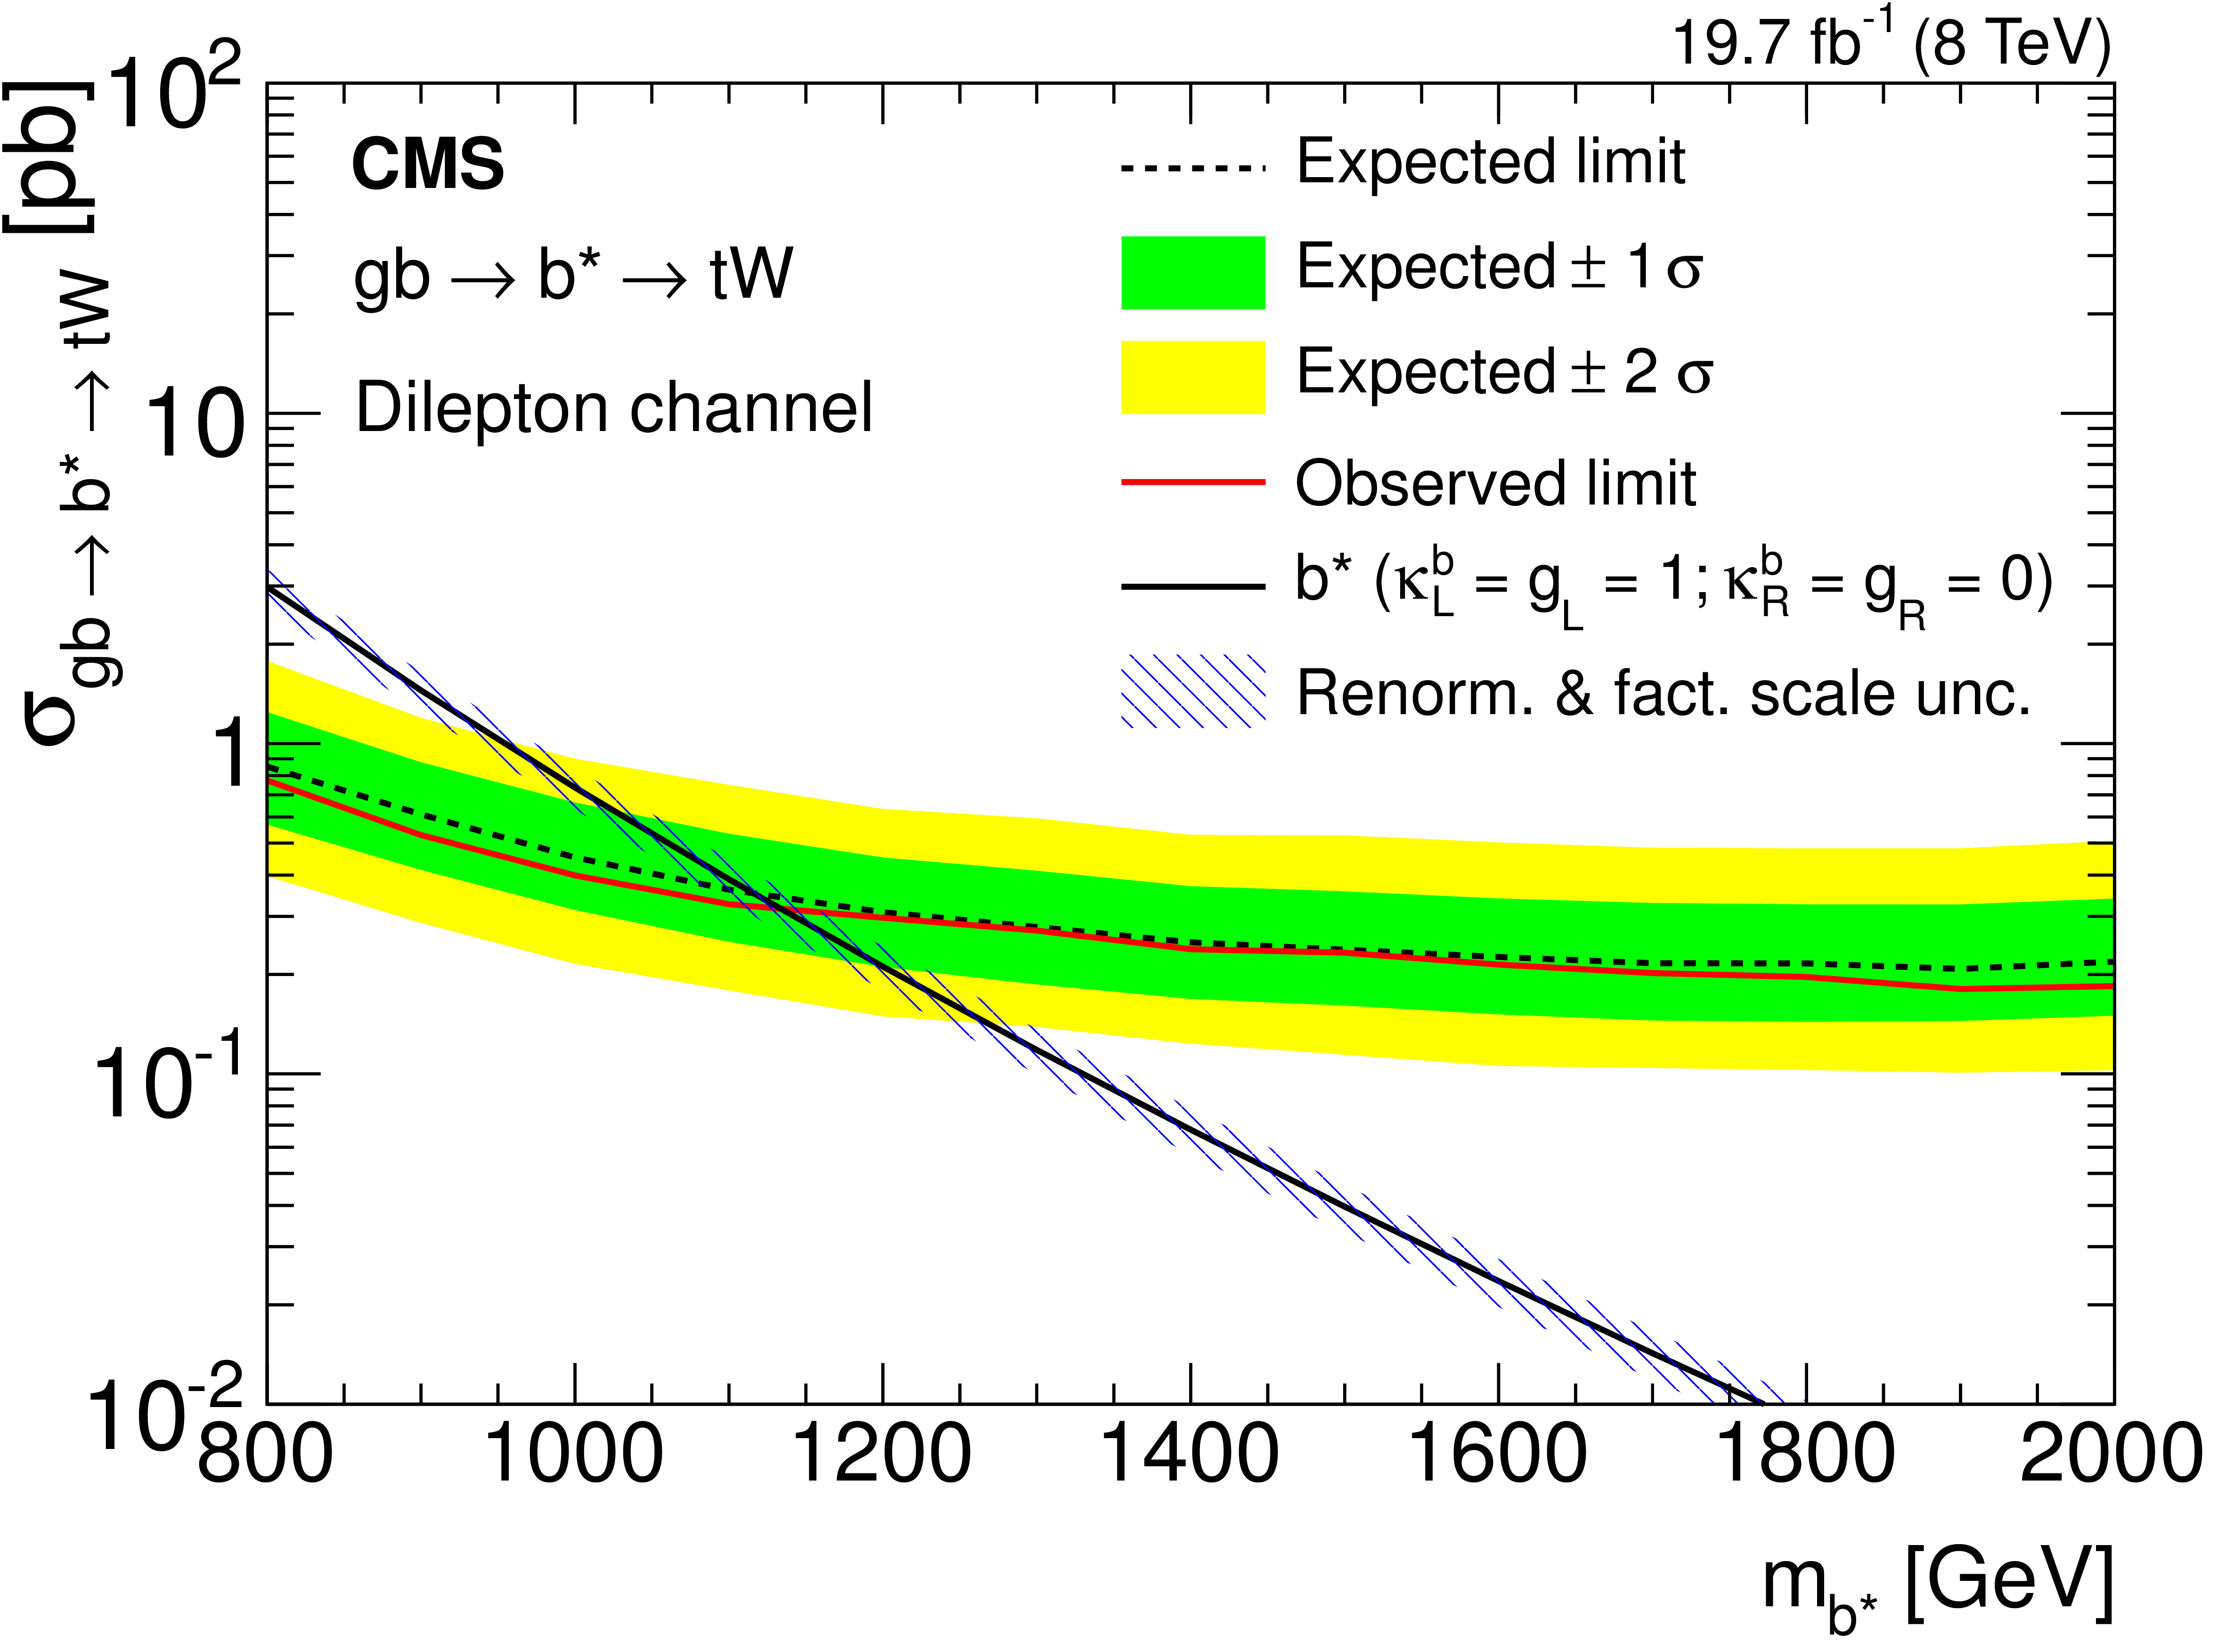
Figure 7-a:
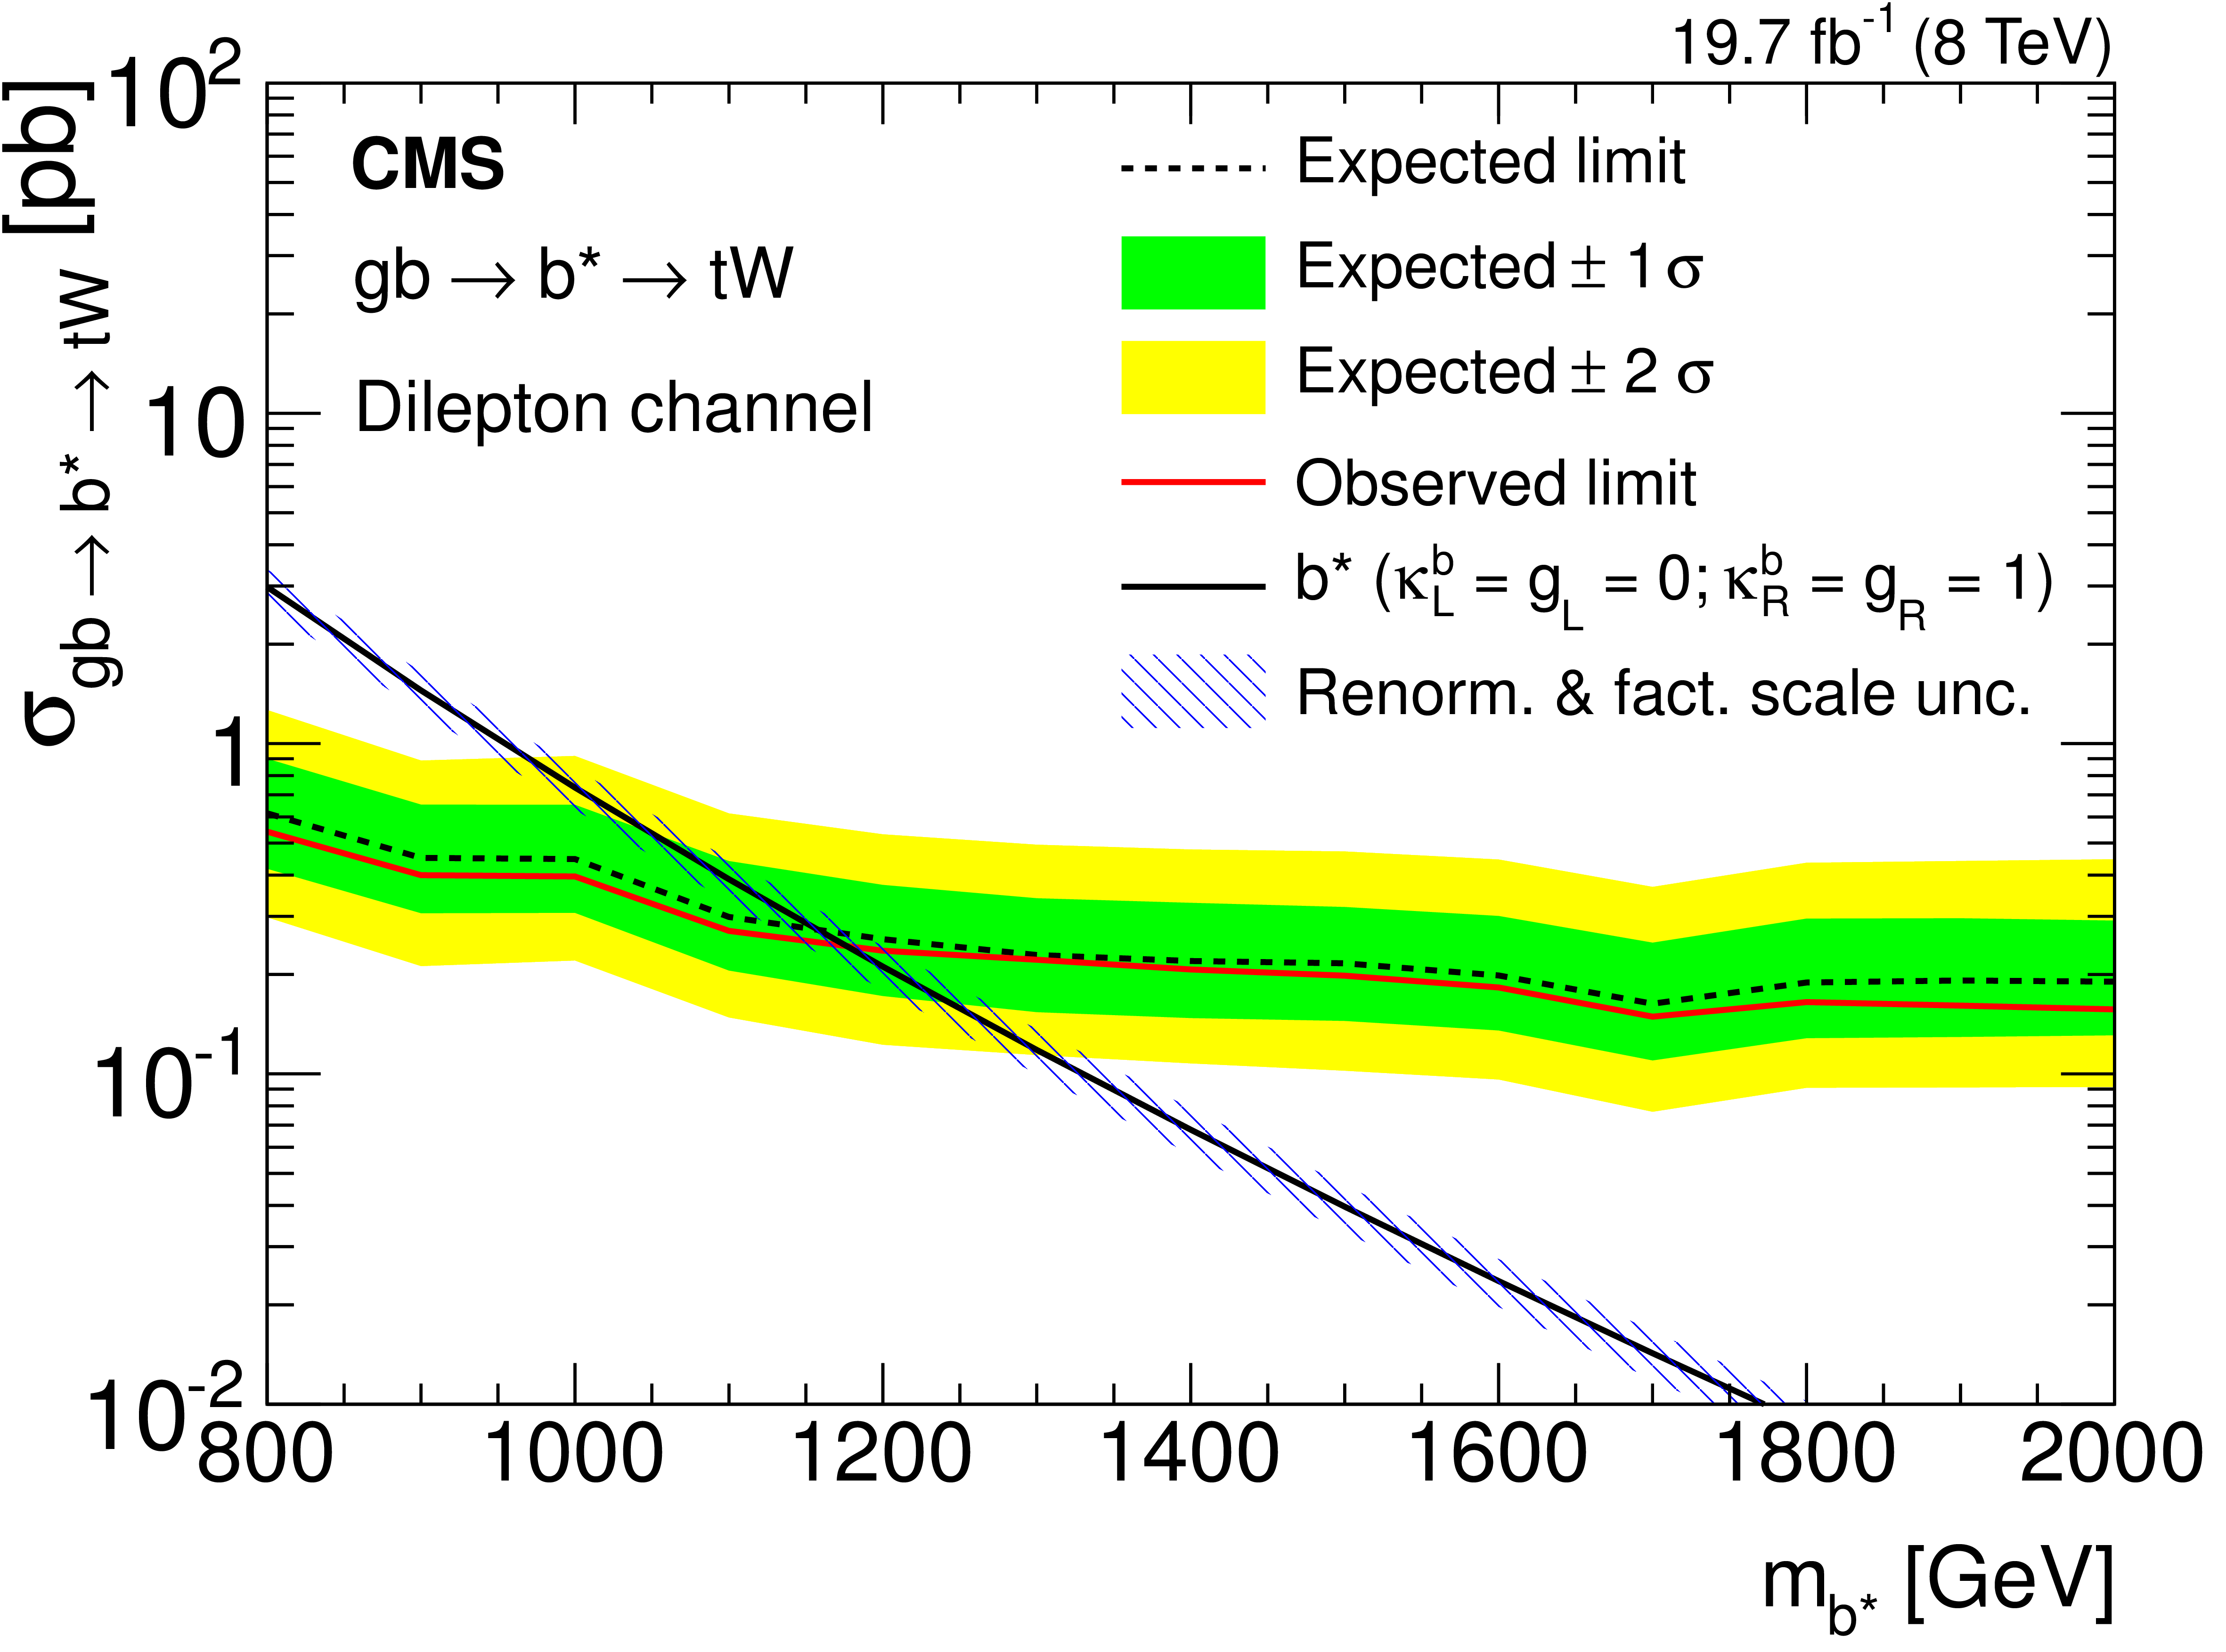
The expected (dashed) and observed (solid) production cross section limits at 95% CL for the dilepton channel as a function of $ { {\mathrm {b}} ^*} $ quark mass for $ {\mathrm {g}} {\mathrm {q_b}}\to { {\mathrm {b}} ^*} {\mathrm {t}} {\mathrm {W}}$. The theoretical cross section (solid line with hatched area) is also shown for comparison. The $1\sigma $ and $2\sigma $ uncertainties in the expected limit bands are shown. Limits for the left-handed, right-handed, and vector-like $ { {\mathrm {b}} ^*} $ quark coupling hypotheses are shown in the a, b, and c plots, respectively. |
png pdf |
Figure 7-b:
The expected (dashed) and observed (solid) production cross section limits at 95% CL for the dilepton channel as a function of $ { {\mathrm {b}} ^*} $ quark mass for $ {\mathrm {g}} {\mathrm {q_b}}\to { {\mathrm {b}} ^*} {\mathrm {t}} {\mathrm {W}}$. The theoretical cross section (solid line with hatched area) is also shown for comparison. The $1\sigma $ and $2\sigma $ uncertainties in the expected limit bands are shown. Limits for the left-handed, right-handed, and vector-like $ { {\mathrm {b}} ^*} $ quark coupling hypotheses are shown in the a, b, and c plots, respectively. |

png pdf |
Figure 7-c:
The expected (dashed) and observed (solid) production cross section limits at 95% CL for the dilepton channel as a function of $ { {\mathrm {b}} ^*} $ quark mass for $ {\mathrm {g}} {\mathrm {q_b}}\to { {\mathrm {b}} ^*} {\mathrm {t}} {\mathrm {W}}$. The theoretical cross section (solid line with hatched area) is also shown for comparison. The $1\sigma $ and $2\sigma $ uncertainties in the expected limit bands are shown. Limits for the left-handed, right-handed, and vector-like $ { {\mathrm {b}} ^*} $ quark coupling hypotheses are shown in the a, b, and c plots, respectively. |
png pdf |
Figure 8-a:
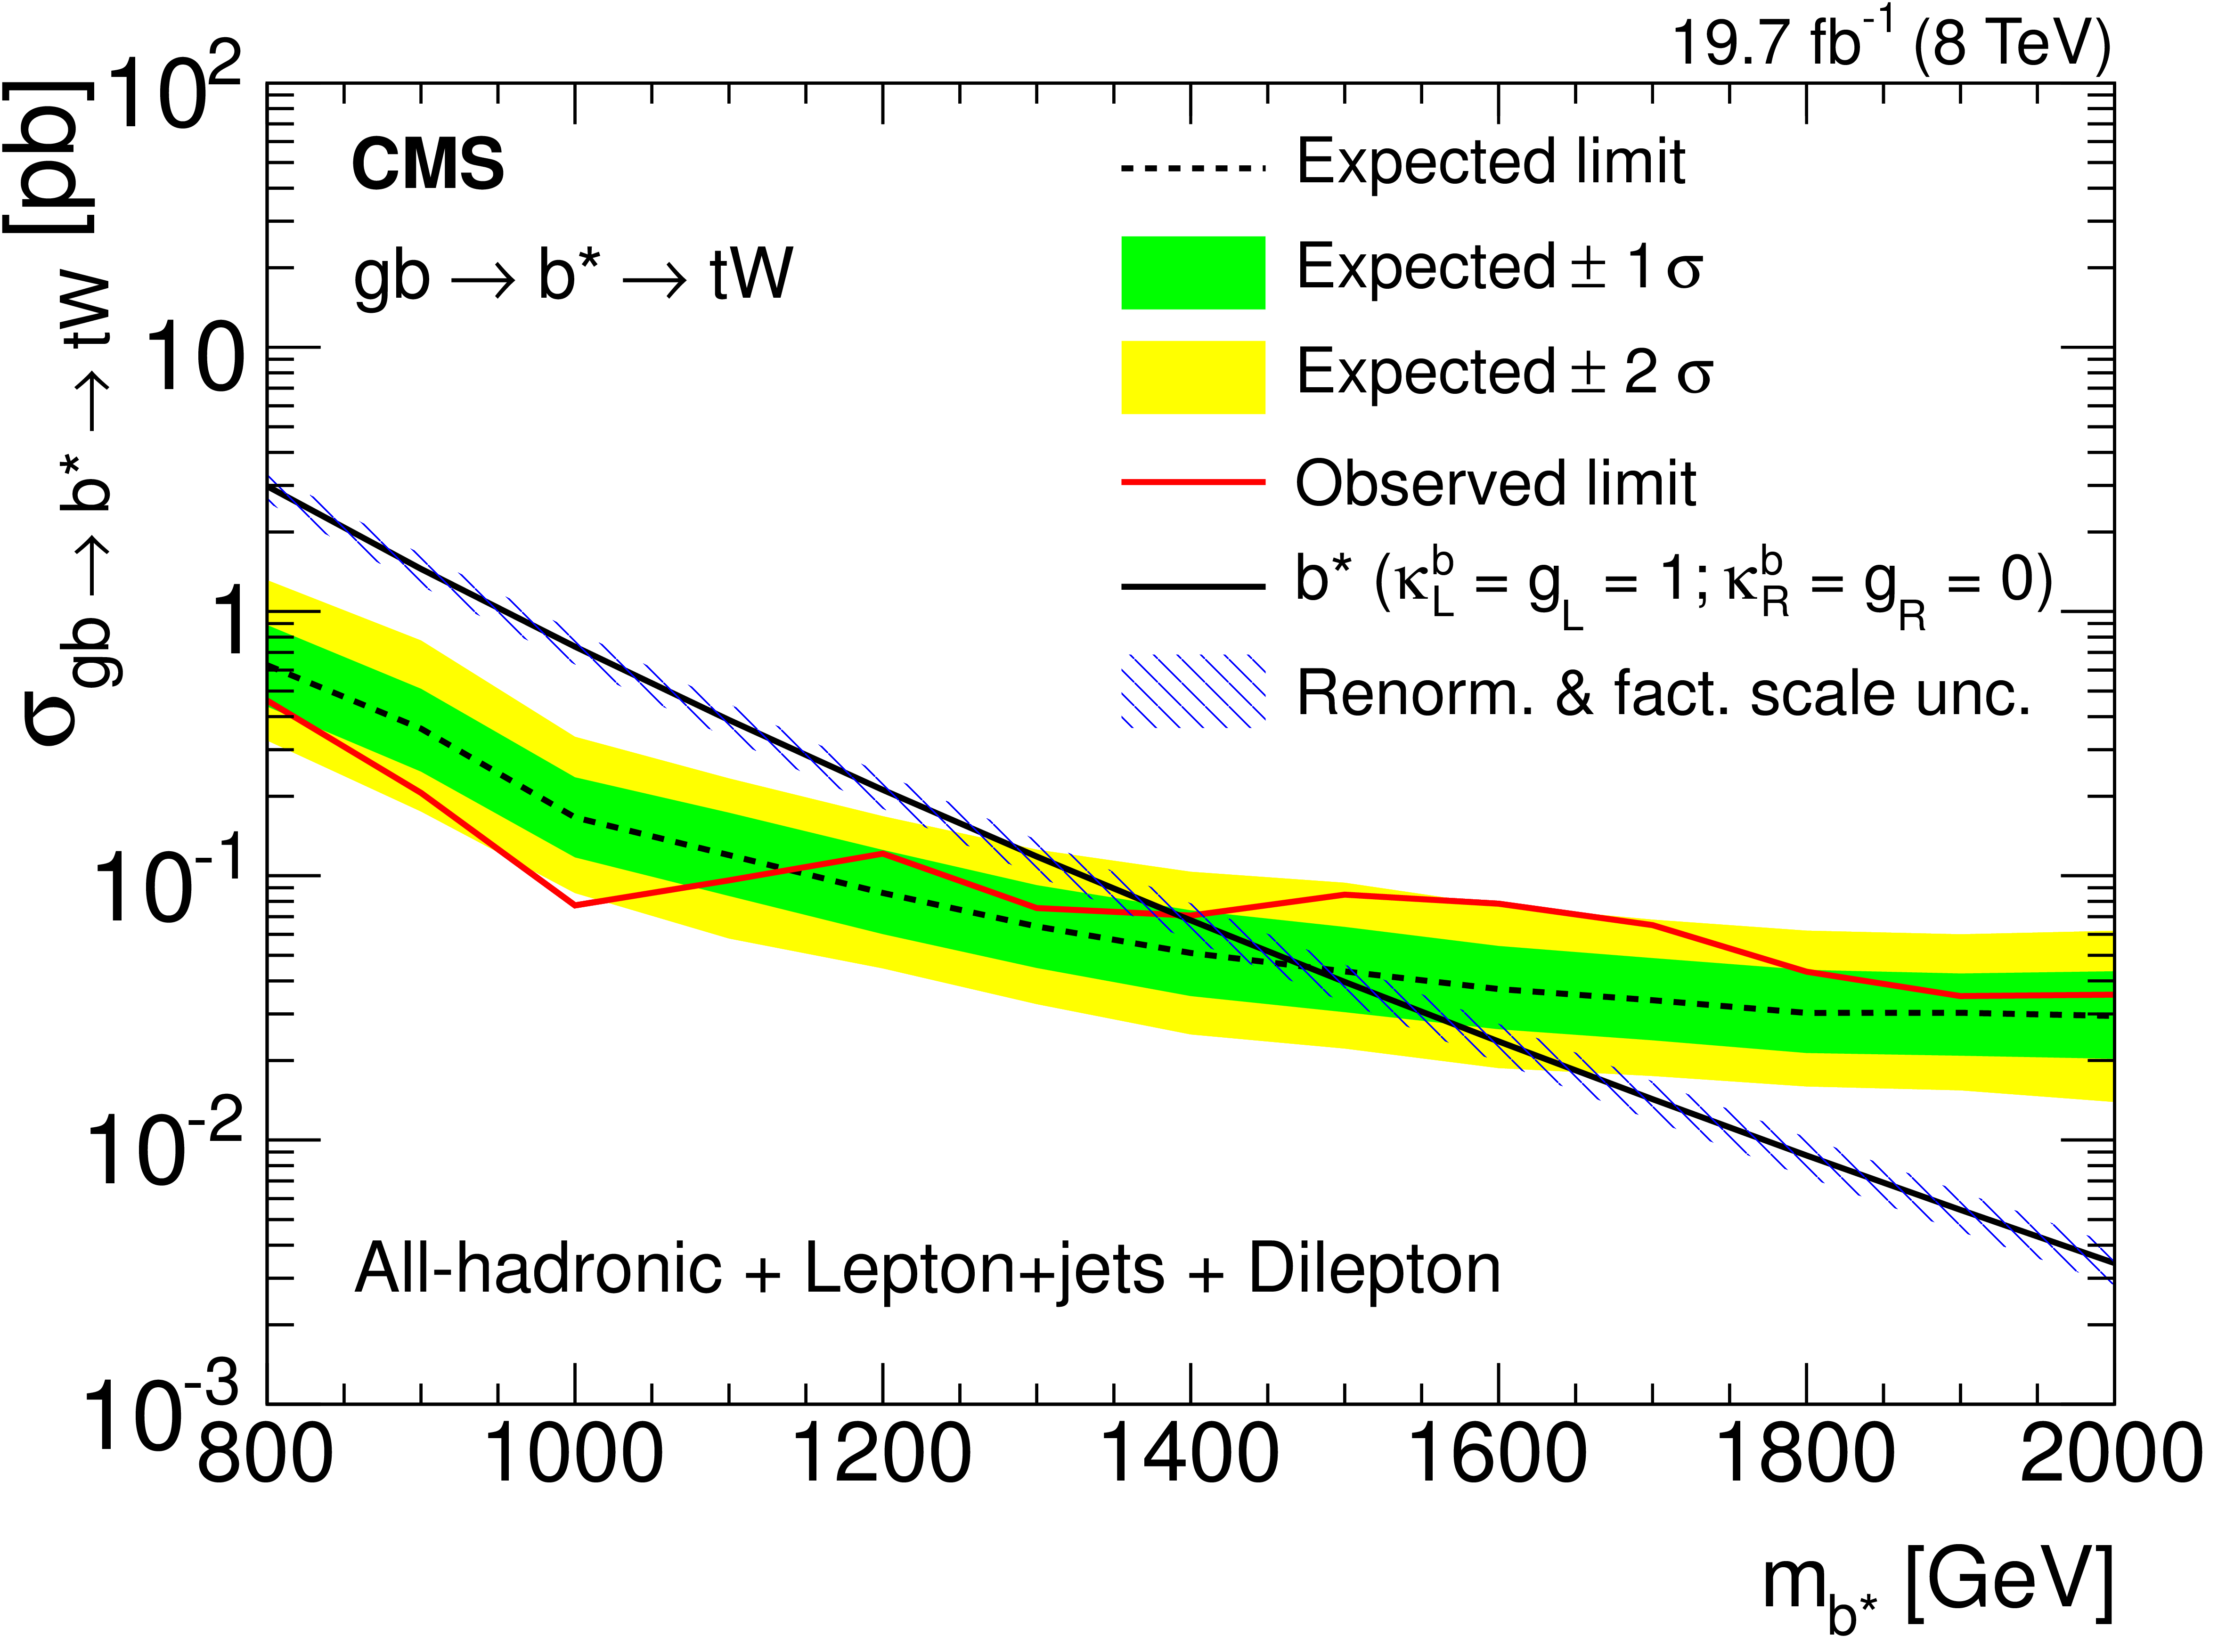
The expected (dashed) and observed (solid) production cross section limits at 95% CL for the combined all-hadronic, lepton+jets, and dilepton channels as a function of $ { {\mathrm {b}} ^*} $ quark mass for $ {\mathrm {g}} {\mathrm {q_b}}\to { {\mathrm {b}} ^*} {\mathrm {t}} {\mathrm {W}}$. The theoretical cross section (solid line with hatched area) is also shown for comparison. The $1\sigma $ and $2\sigma $ uncertainties in the expected limit bands are shown. Limits for the left-handed, right-handed, and vector-like $ { {\mathrm {b}} ^*} $ quark coupling hypotheses are shown in the a, b, and c plots, respectively. |
png pdf |
Figure 8-b:
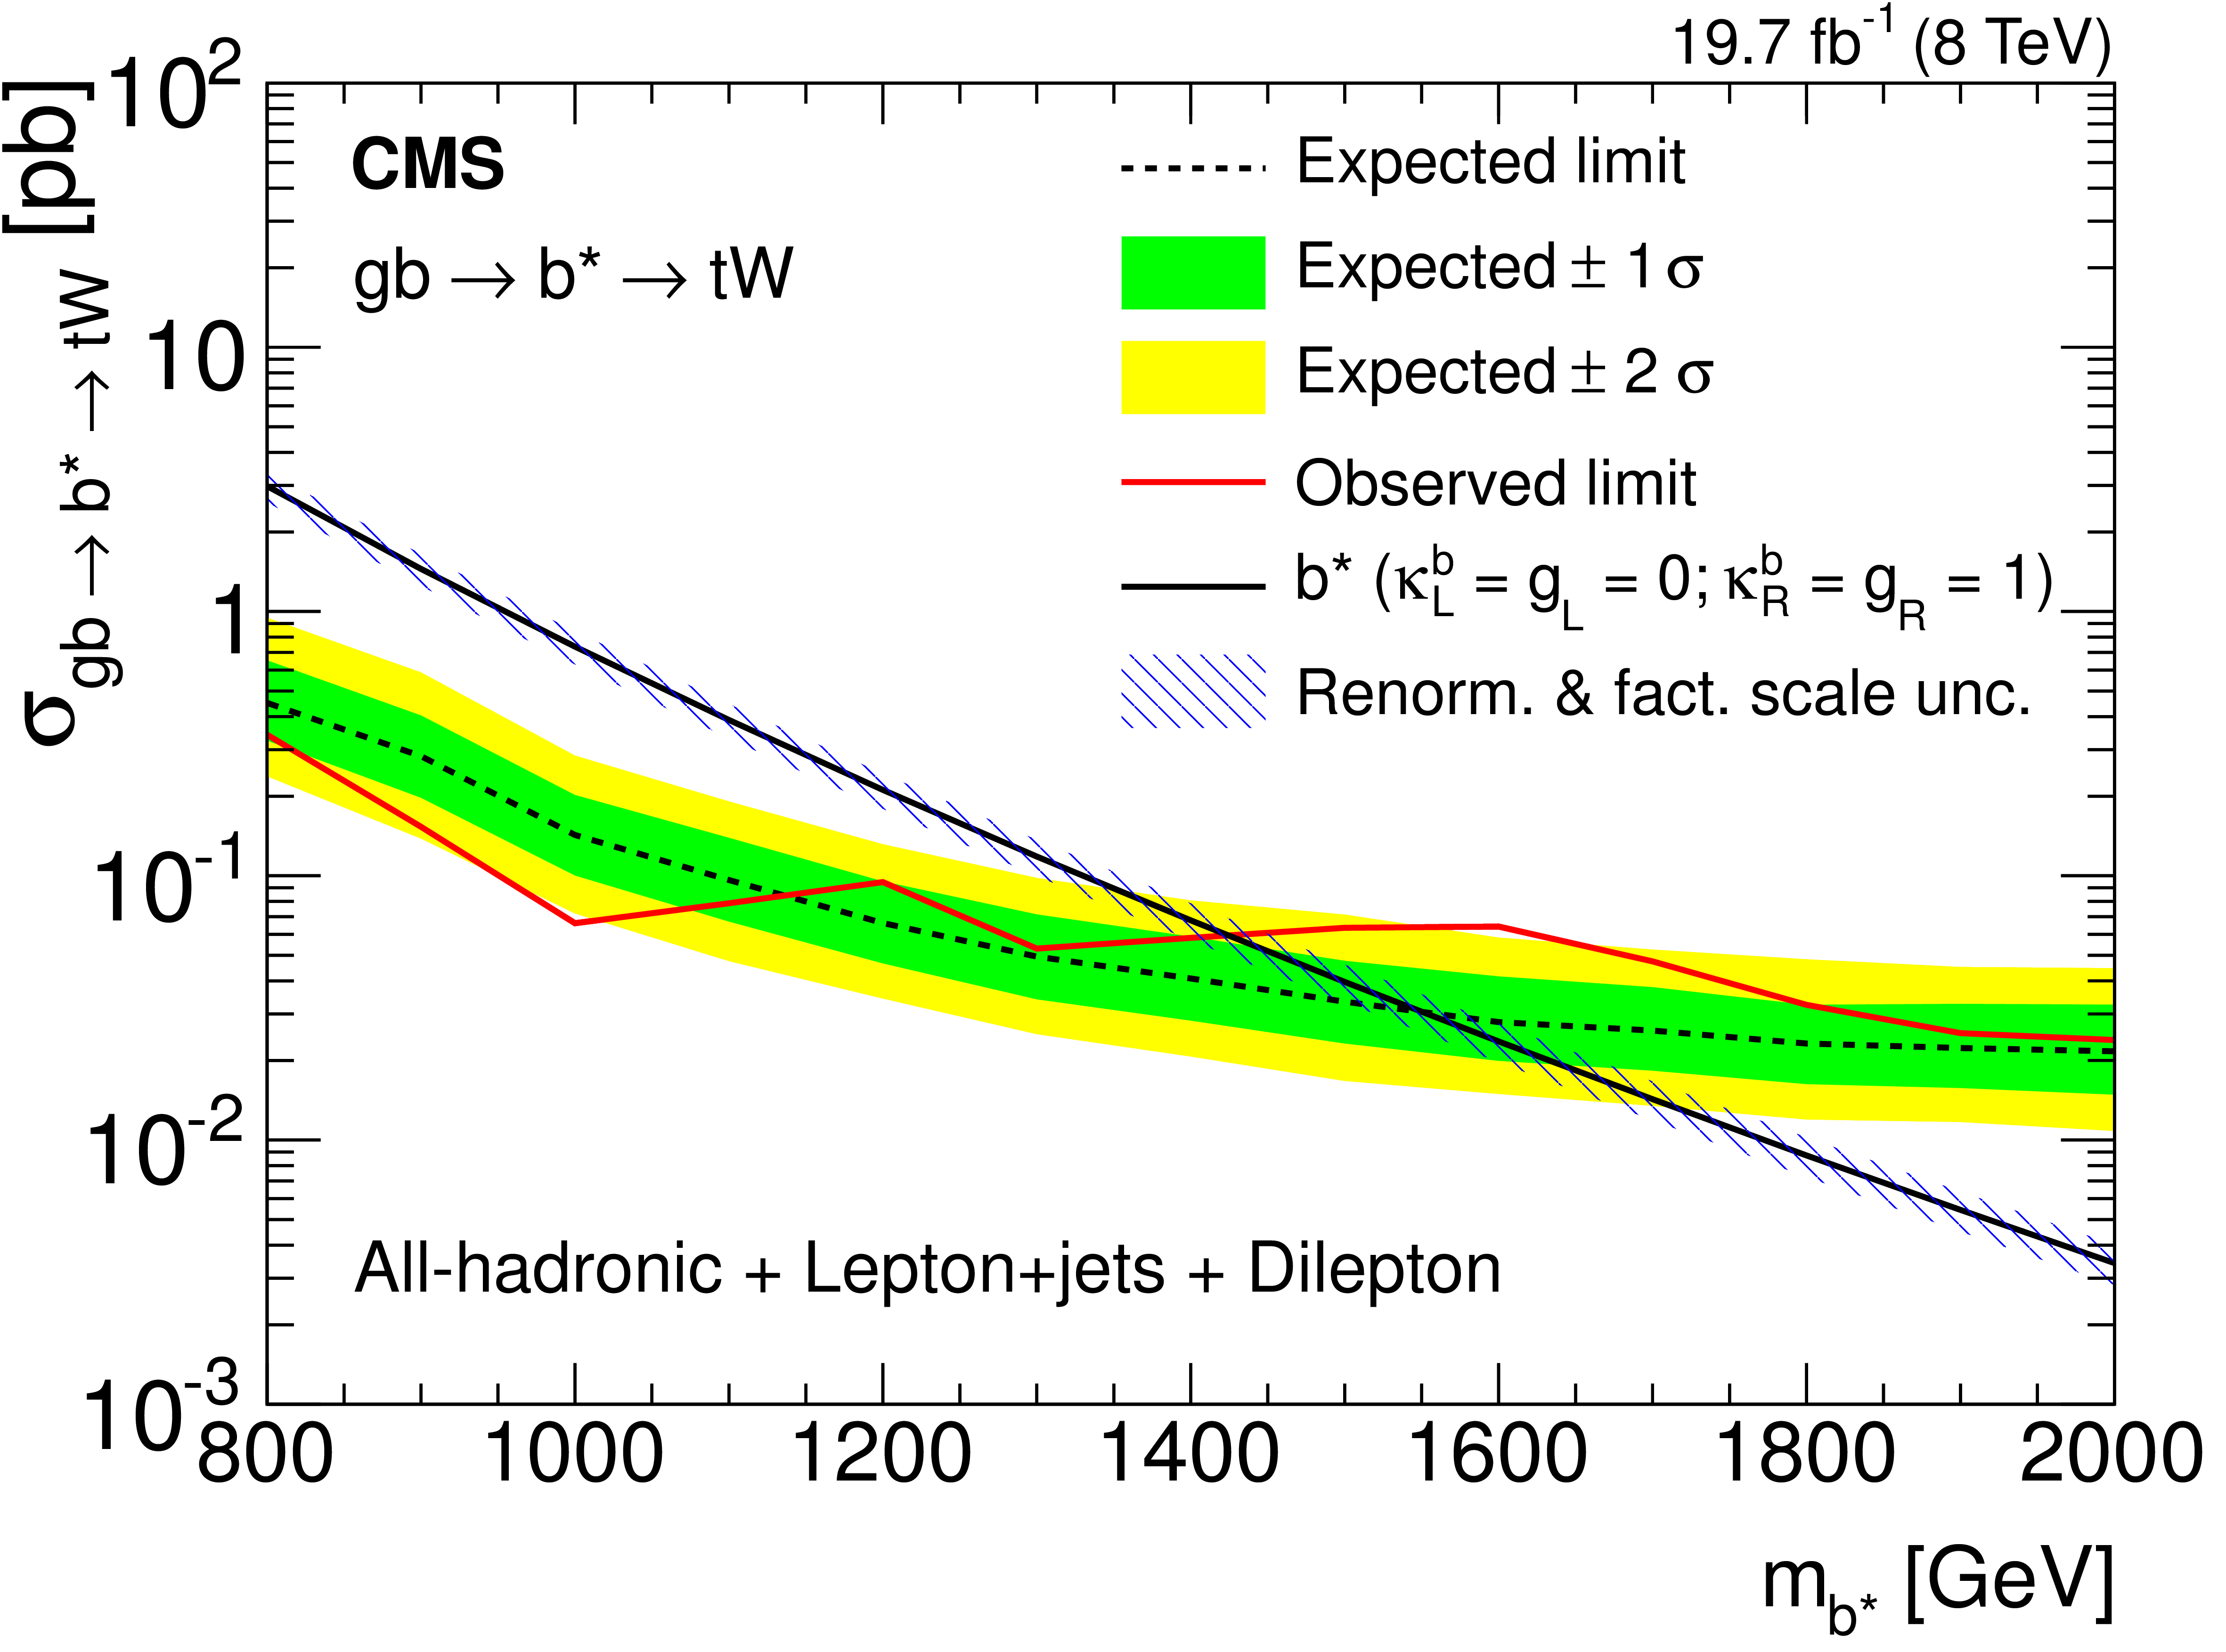
The expected (dashed) and observed (solid) production cross section limits at 95% CL for the combined all-hadronic, lepton+jets, and dilepton channels as a function of $ { {\mathrm {b}} ^*} $ quark mass for $ {\mathrm {g}} {\mathrm {q_b}}\to { {\mathrm {b}} ^*} {\mathrm {t}} {\mathrm {W}}$. The theoretical cross section (solid line with hatched area) is also shown for comparison. The $1\sigma $ and $2\sigma $ uncertainties in the expected limit bands are shown. Limits for the left-handed, right-handed, and vector-like $ { {\mathrm {b}} ^*} $ quark coupling hypotheses are shown in the a, b, and c plots, respectively. |
png pdf |
Figure 8-c:
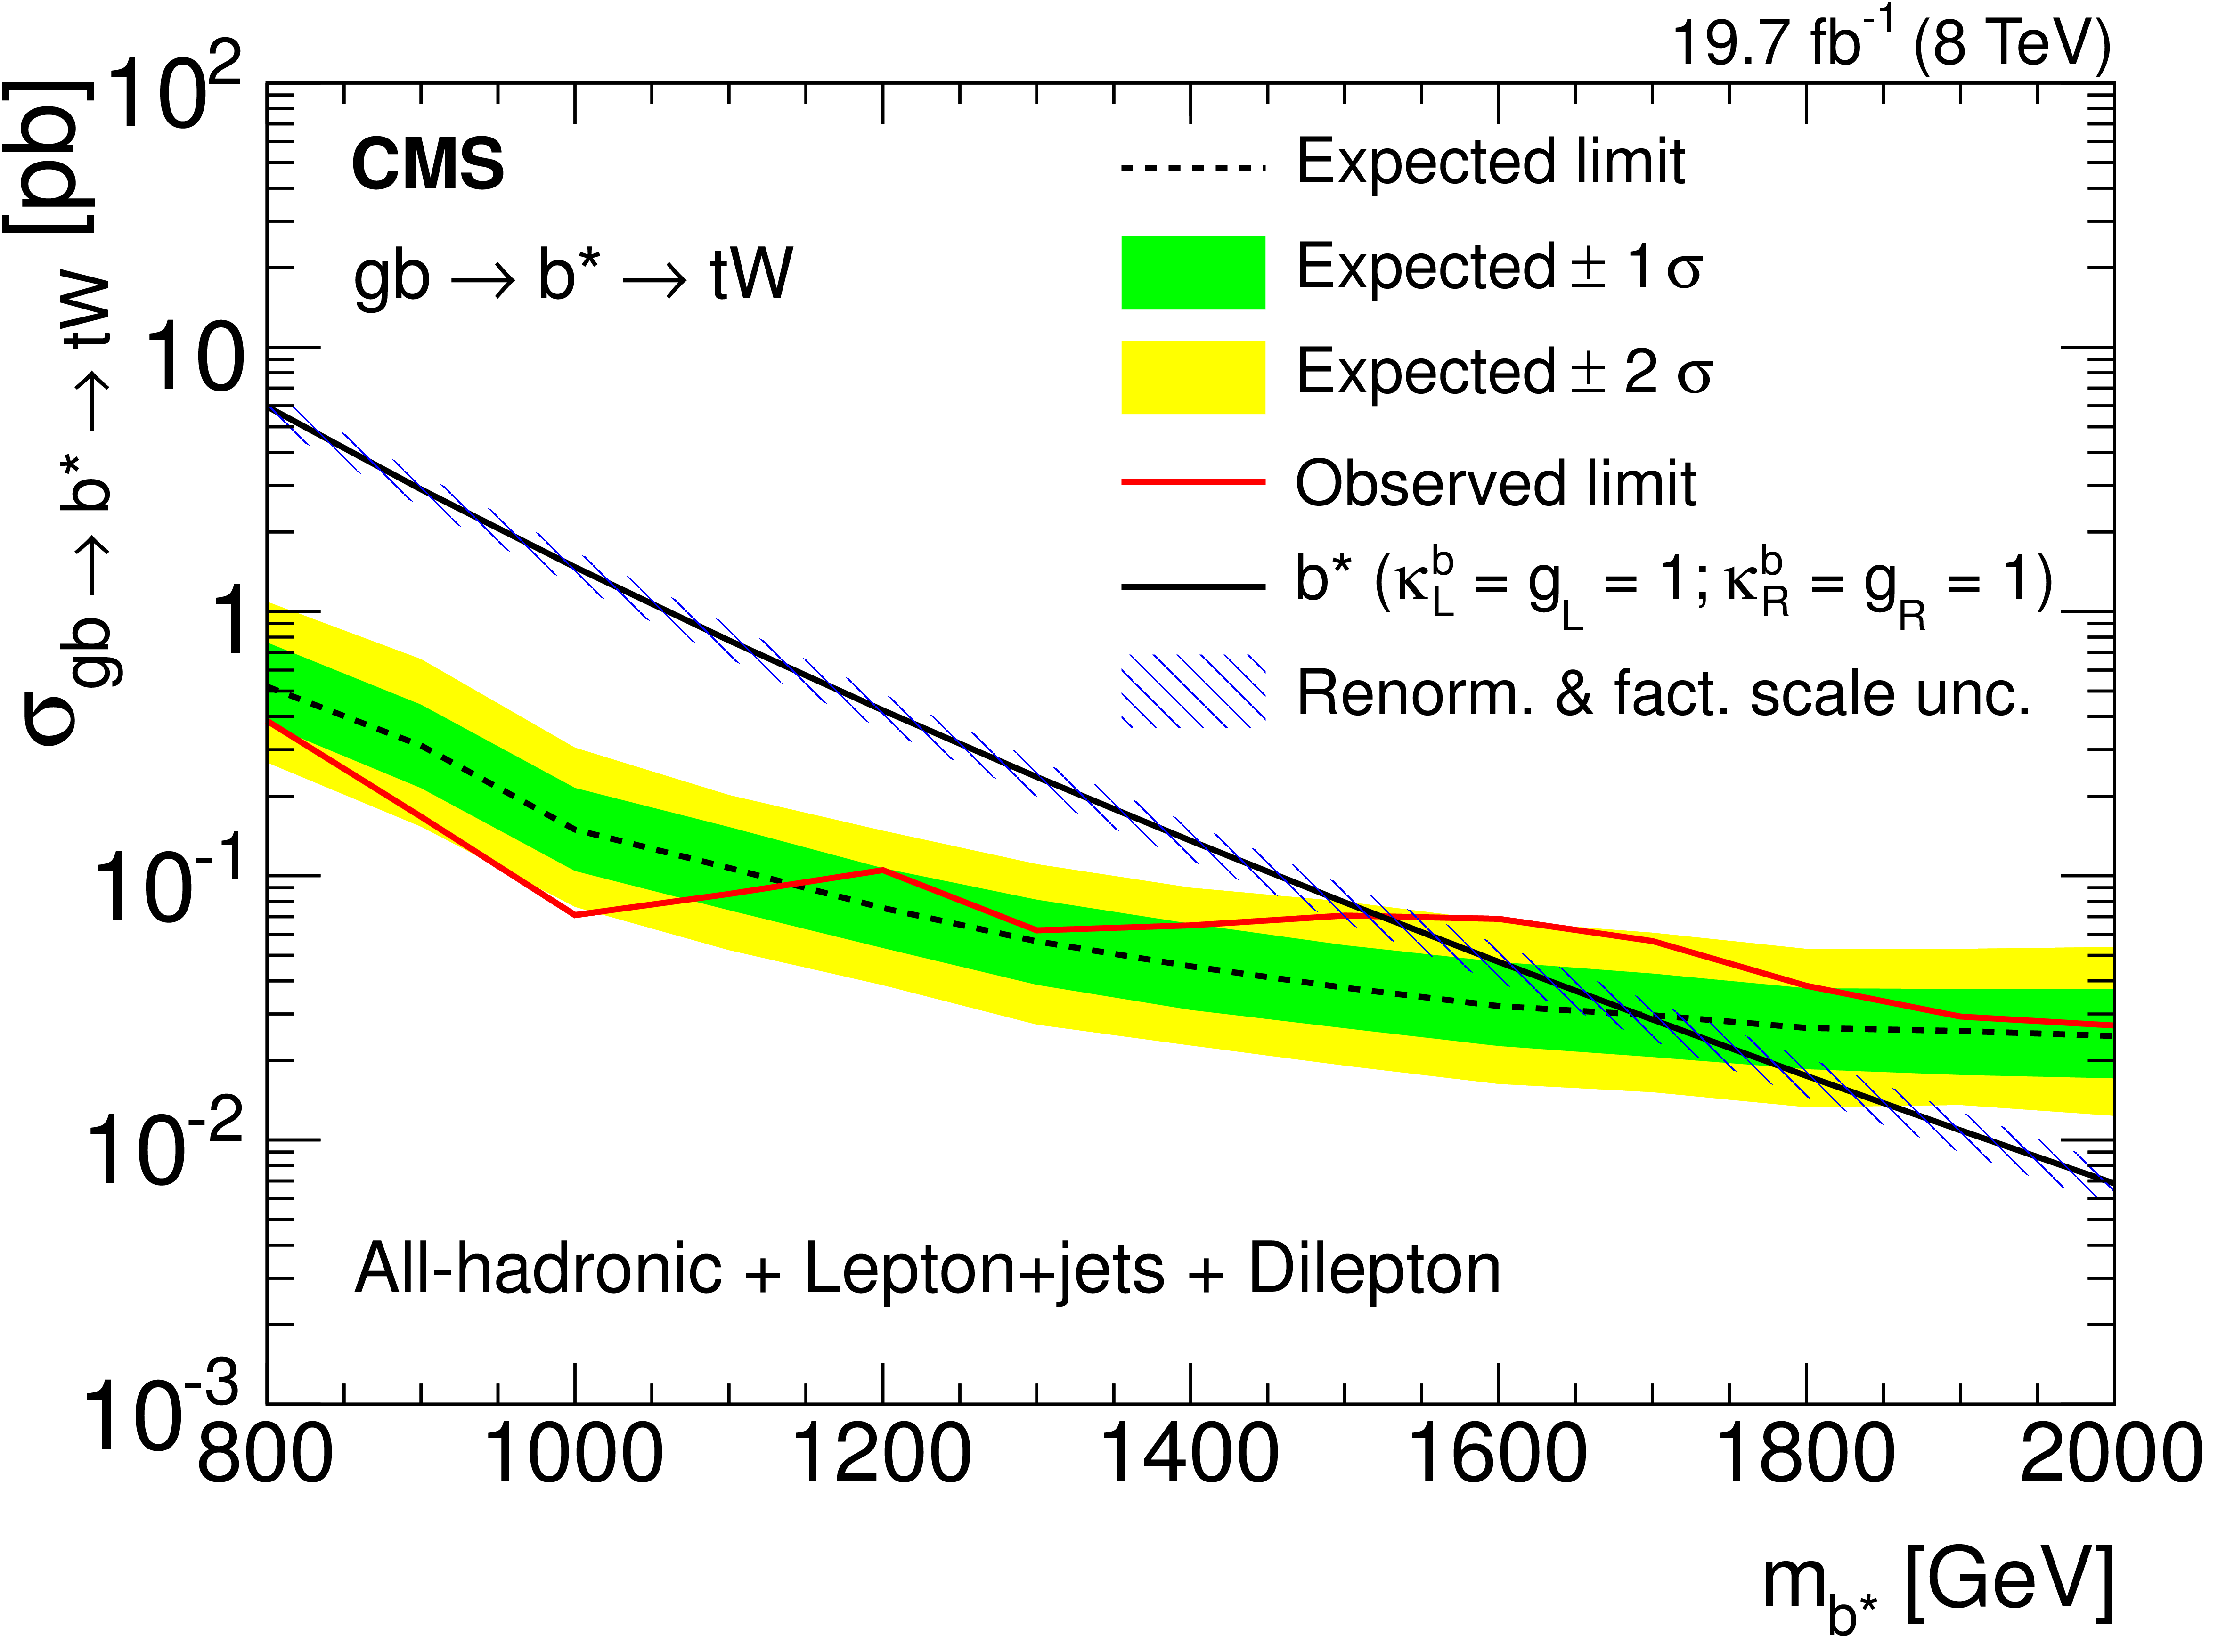
The expected (dashed) and observed (solid) production cross section limits at 95% CL for the combined all-hadronic, lepton+jets, and dilepton channels as a function of $ { {\mathrm {b}} ^*} $ quark mass for $ {\mathrm {g}} {\mathrm {q_b}}\to { {\mathrm {b}} ^*} {\mathrm {t}} {\mathrm {W}}$. The theoretical cross section (solid line with hatched area) is also shown for comparison. The $1\sigma $ and $2\sigma $ uncertainties in the expected limit bands are shown. Limits for the left-handed, right-handed, and vector-like $ { {\mathrm {b}} ^*} $ quark coupling hypotheses are shown in the a, b, and c plots, respectively. |
png pdf |
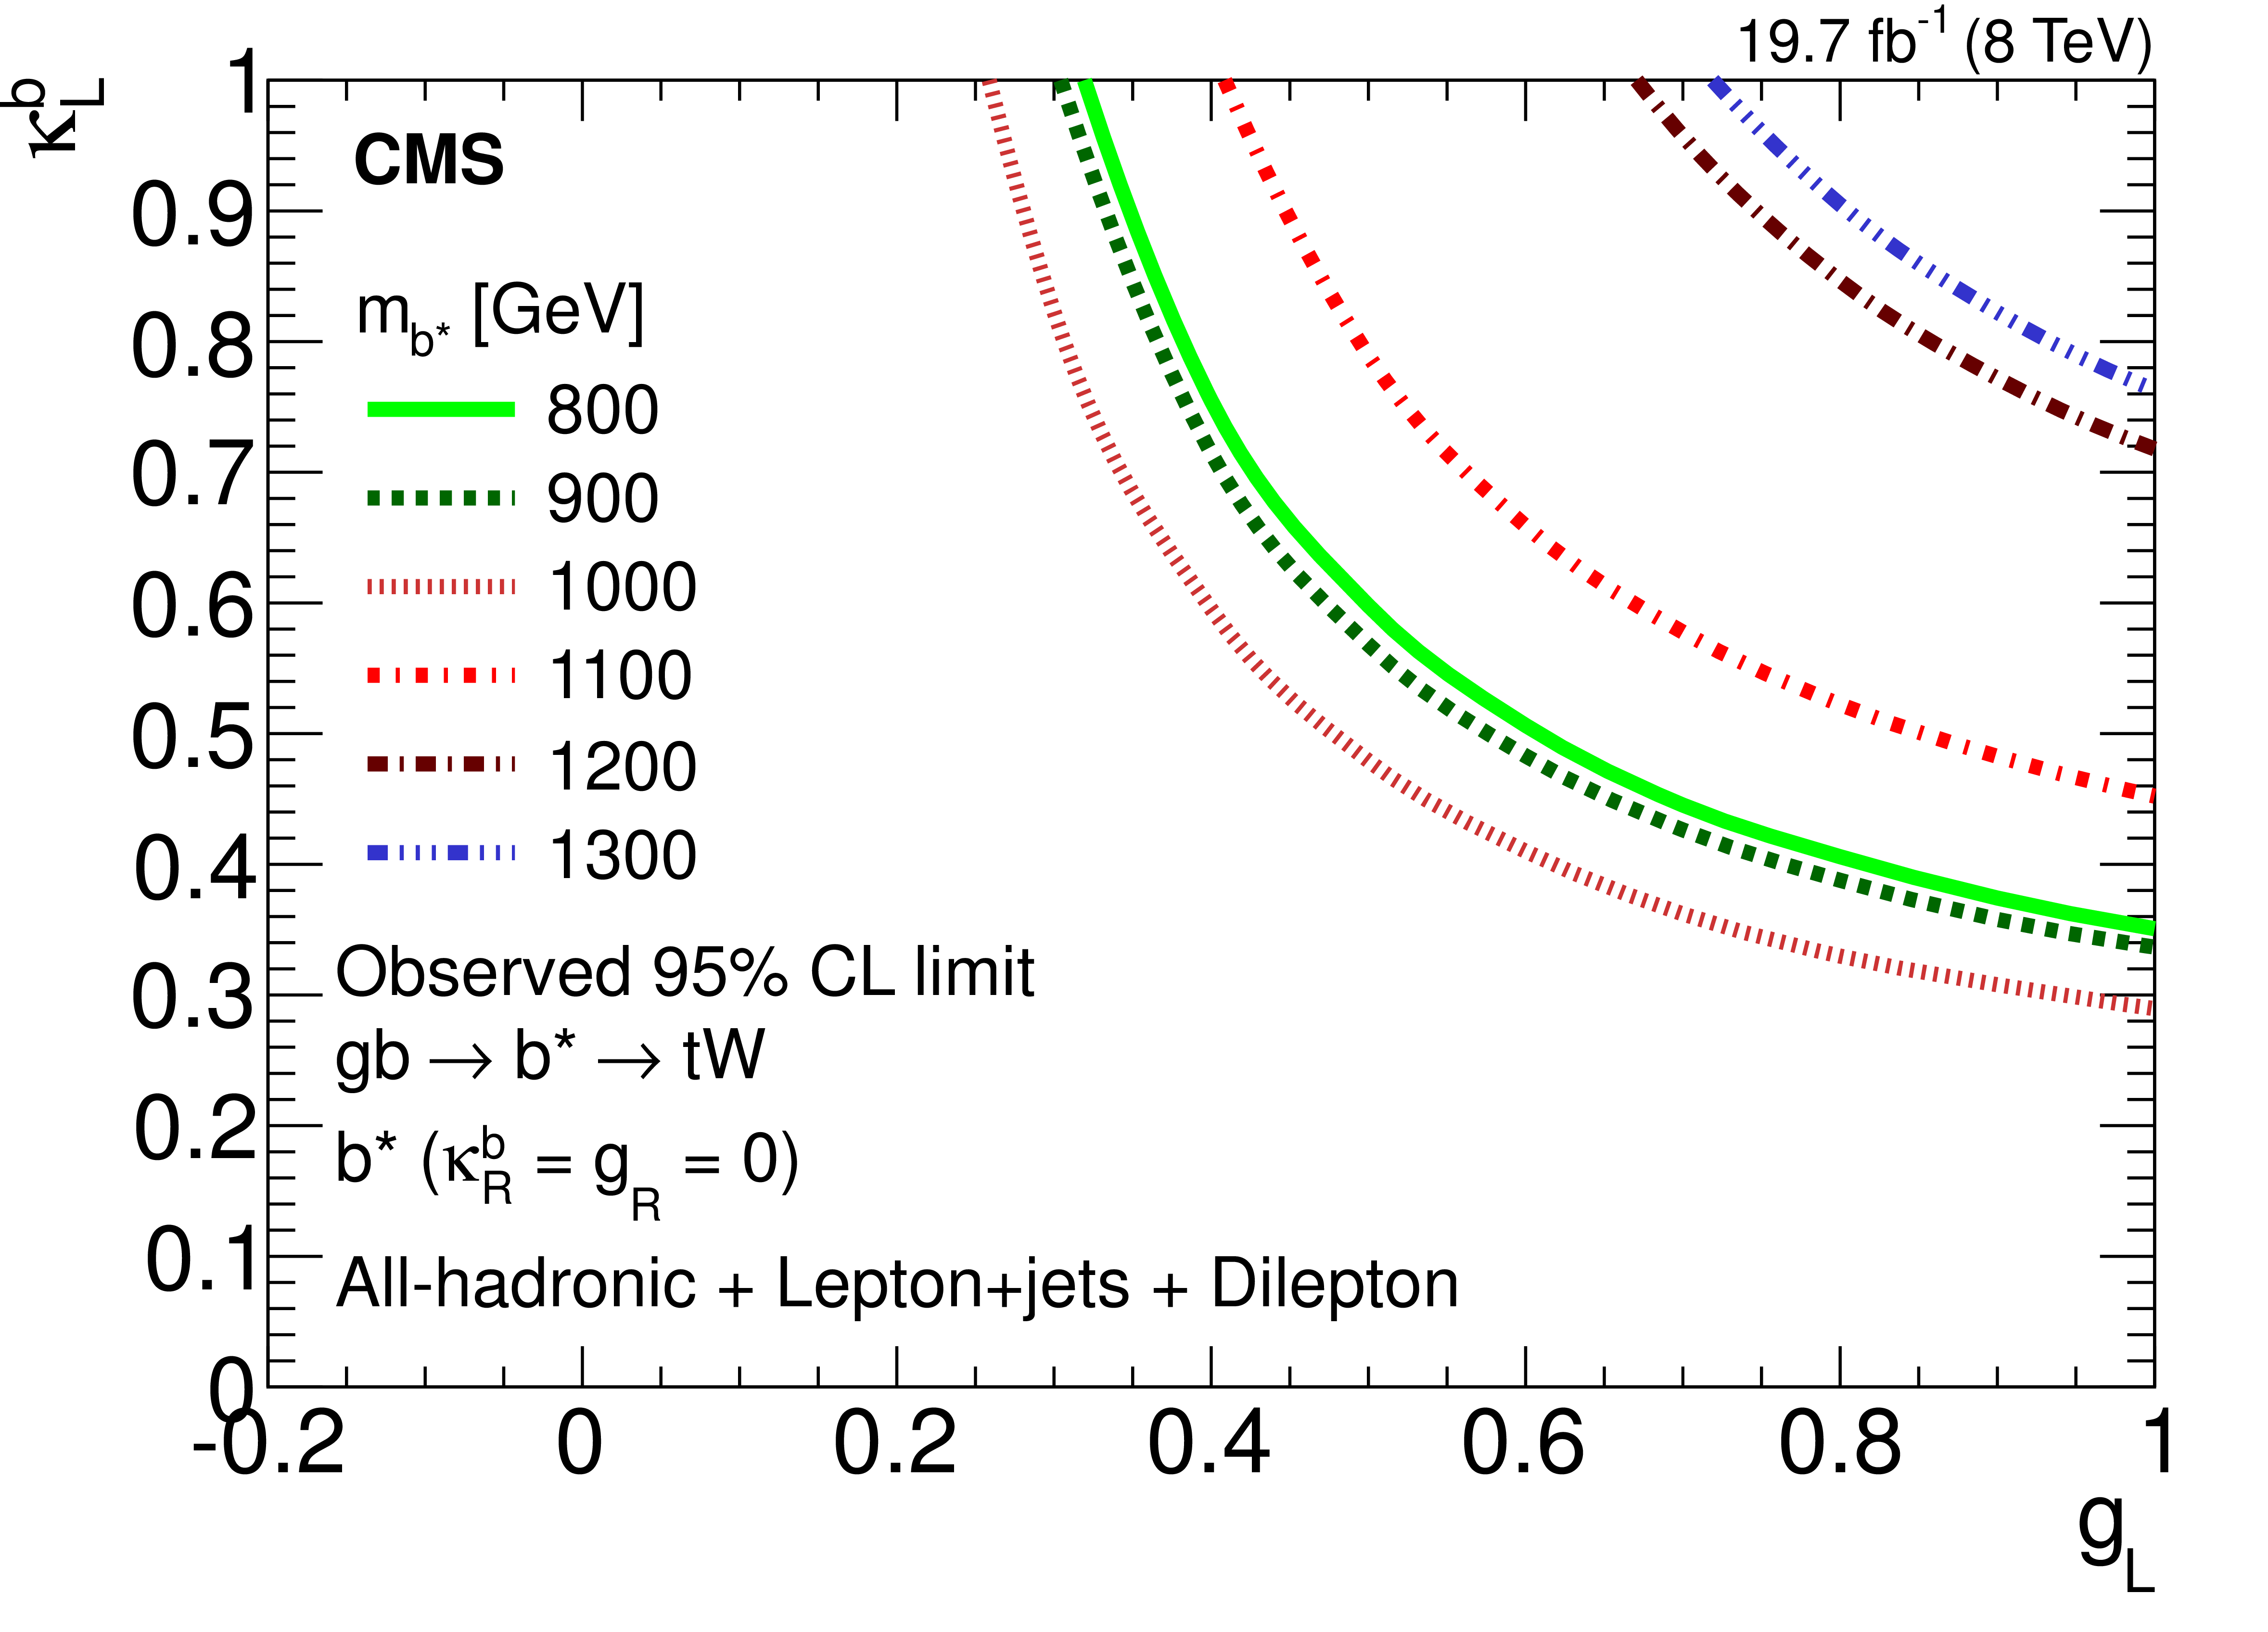
Figure 9-a:
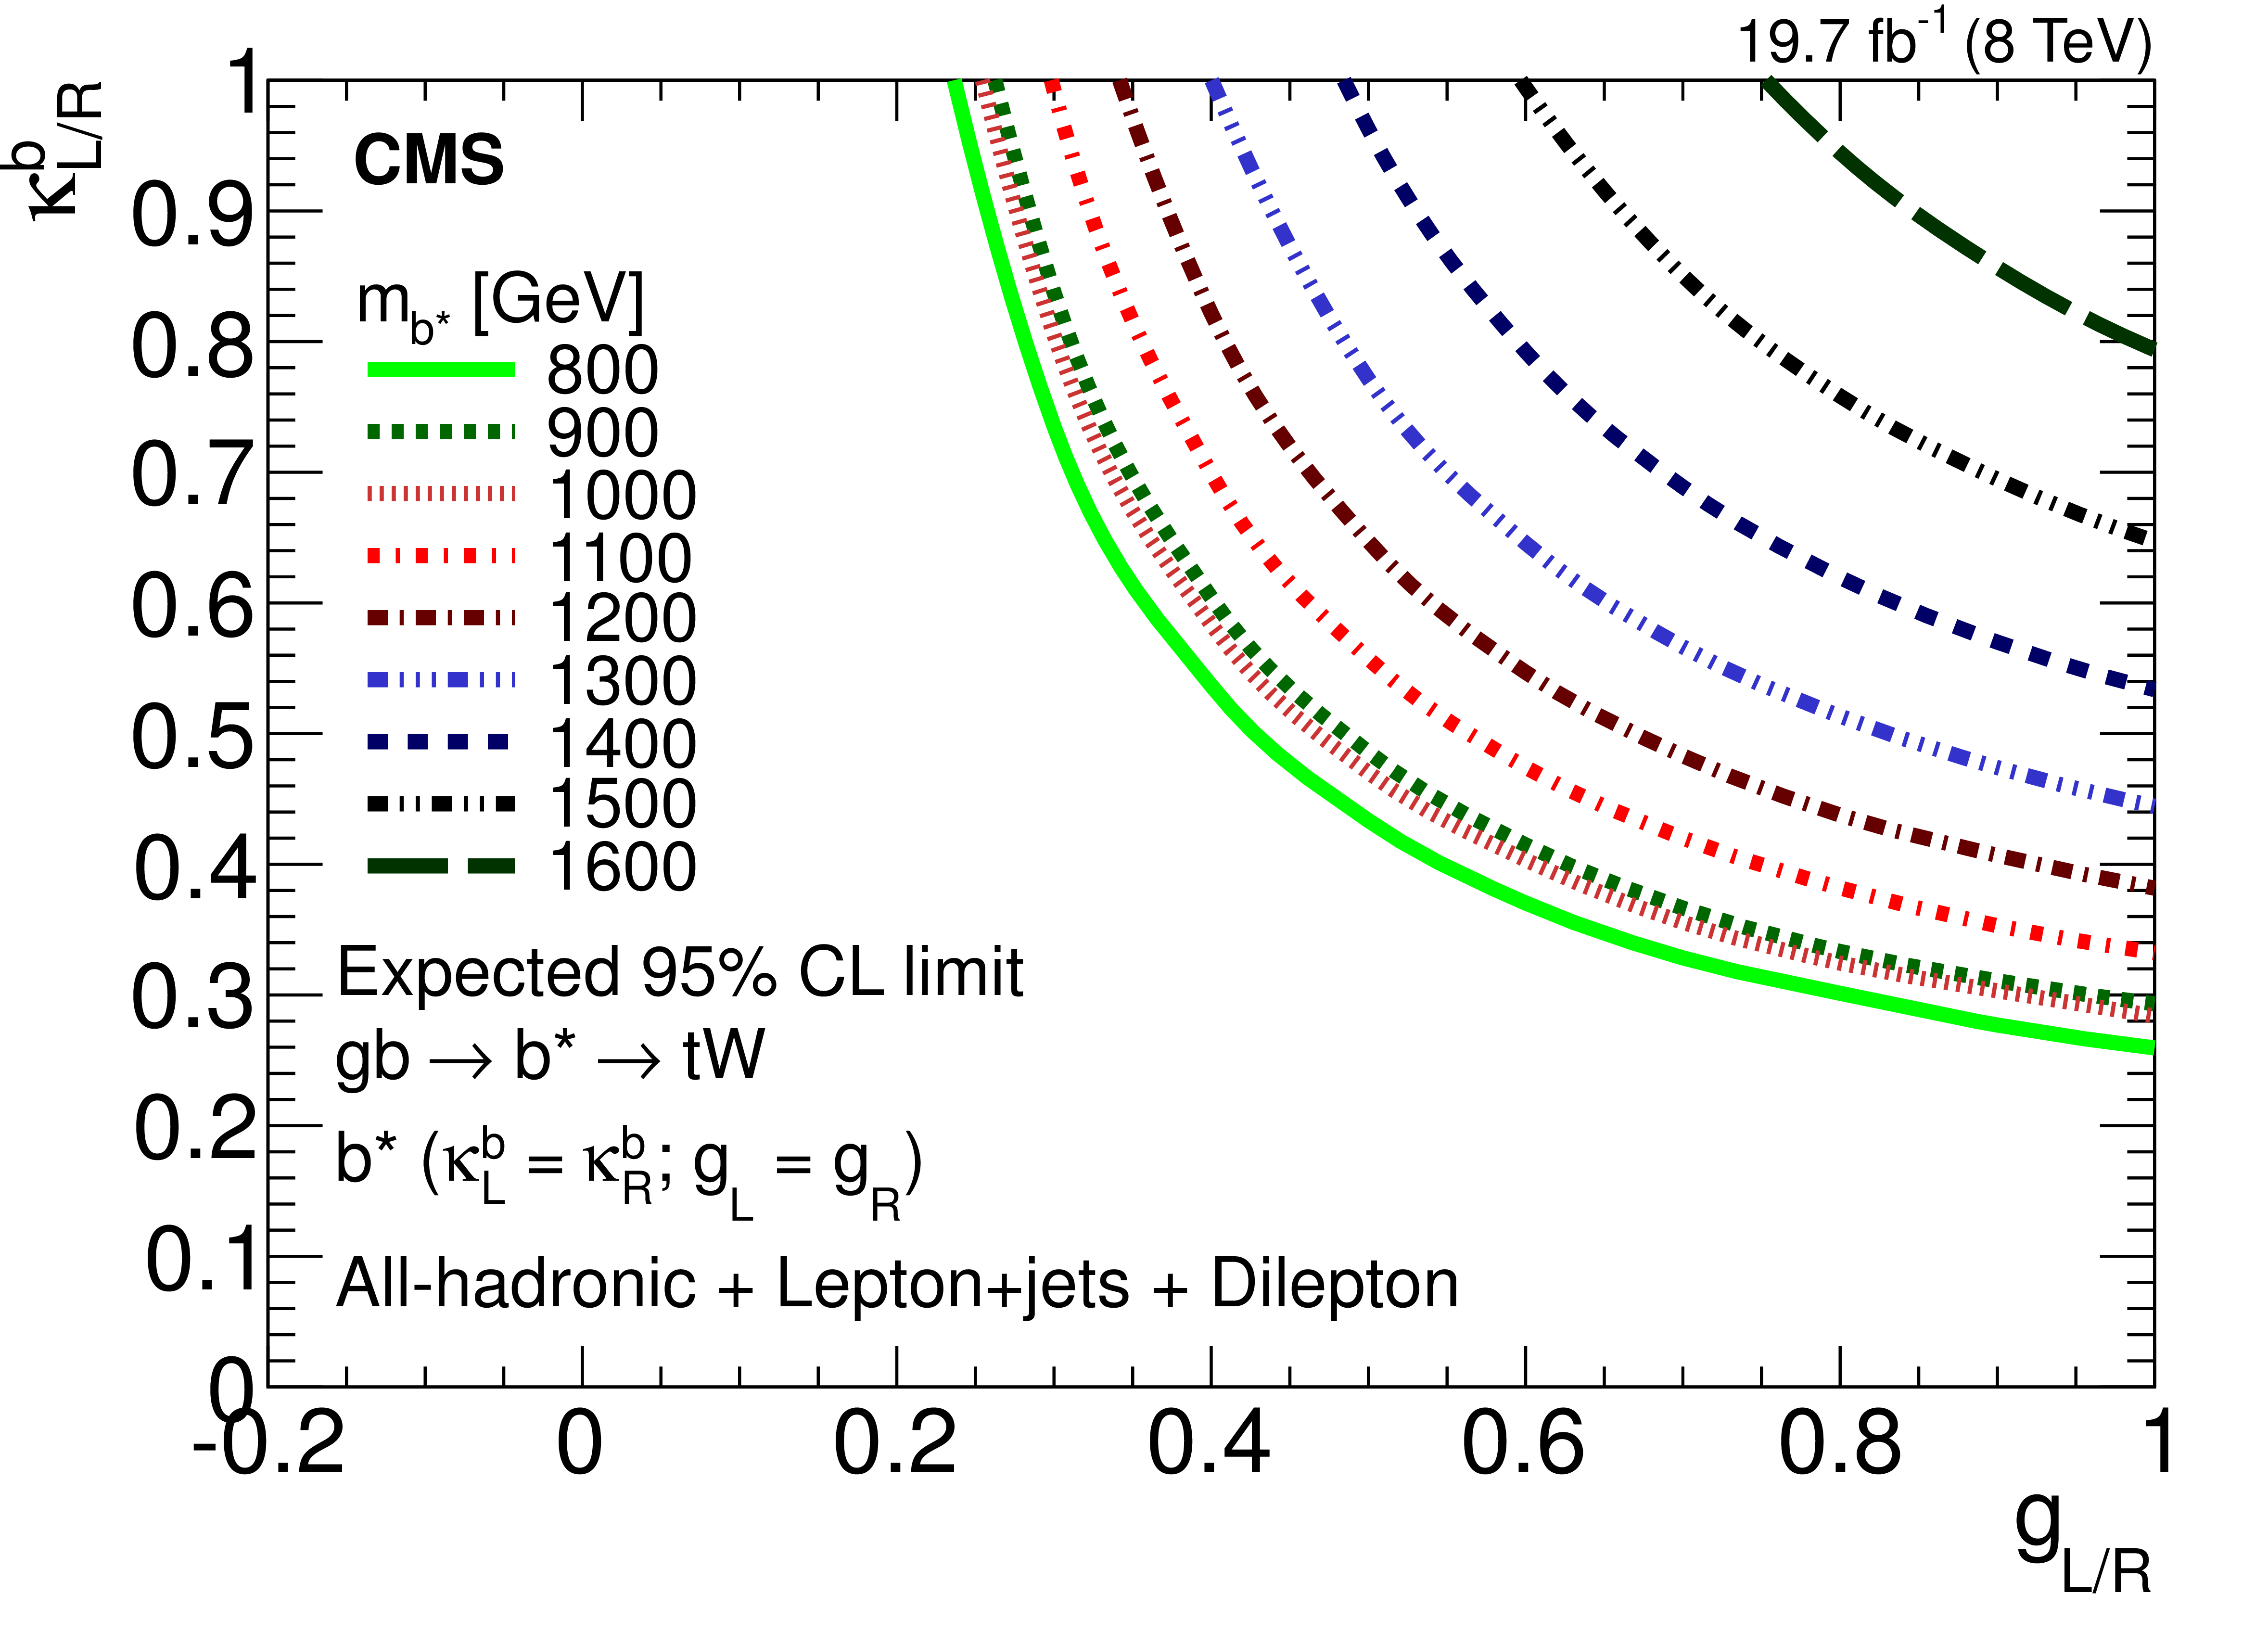
Contour plots showing the lower limits on various values of the $ { {\mathrm {b}} ^*} $ quark mass, as a function of the couplings $\kappa $ and $g$. The (a,c,e) column shows the observed limits and the (b,d,f) column shows the expected limits. The limits for the left-handed, right-handed, and vector-like $ { {\mathrm {b}} ^*} $ quark coupling hypotheses are shown in the (a,b), (c,d), and (e,f) rows, respectively. The excluded regions are above and to the right of the curves. |
png pdf |
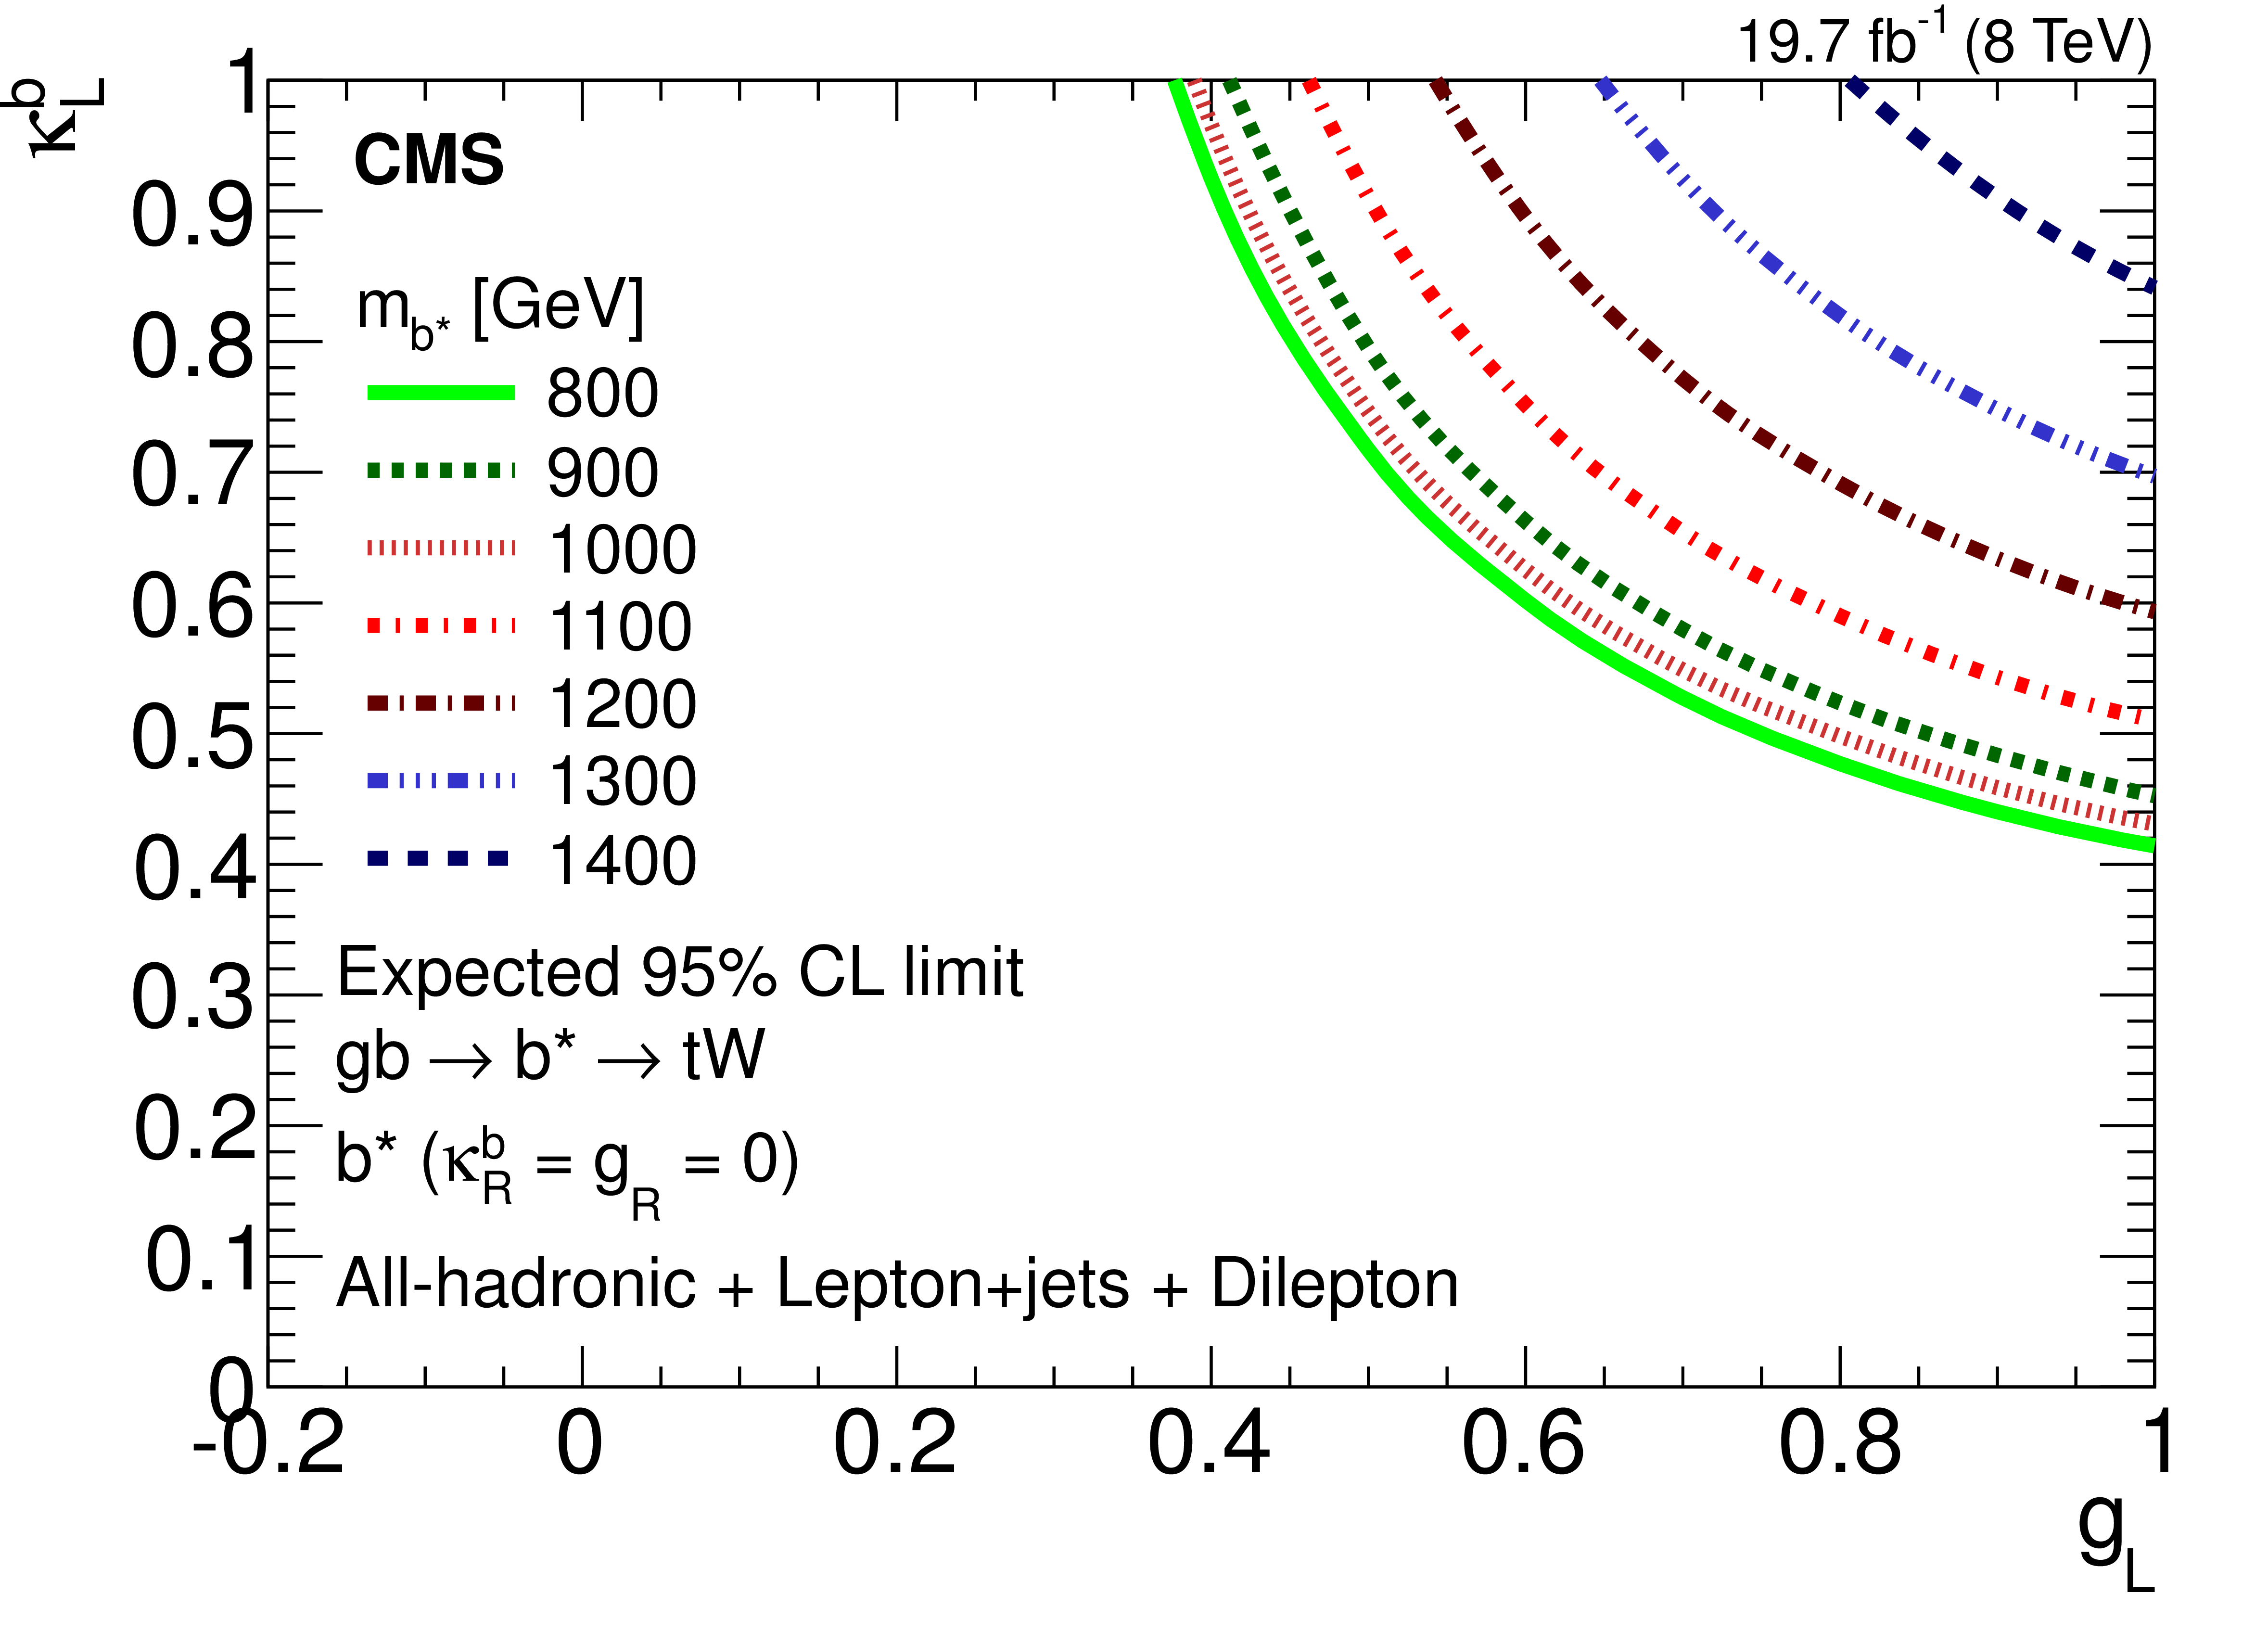
Figure 9-b:
Contour plots showing the lower limits on various values of the $ { {\mathrm {b}} ^*} $ quark mass, as a function of the couplings $\kappa $ and $g$. The (a,c,e) column shows the observed limits and the (b,d,f) column shows the expected limits. The limits for the left-handed, right-handed, and vector-like $ { {\mathrm {b}} ^*} $ quark coupling hypotheses are shown in the (a,b), (c,d), and (e,f) rows, respectively. The excluded regions are above and to the right of the curves. |
png pdf |
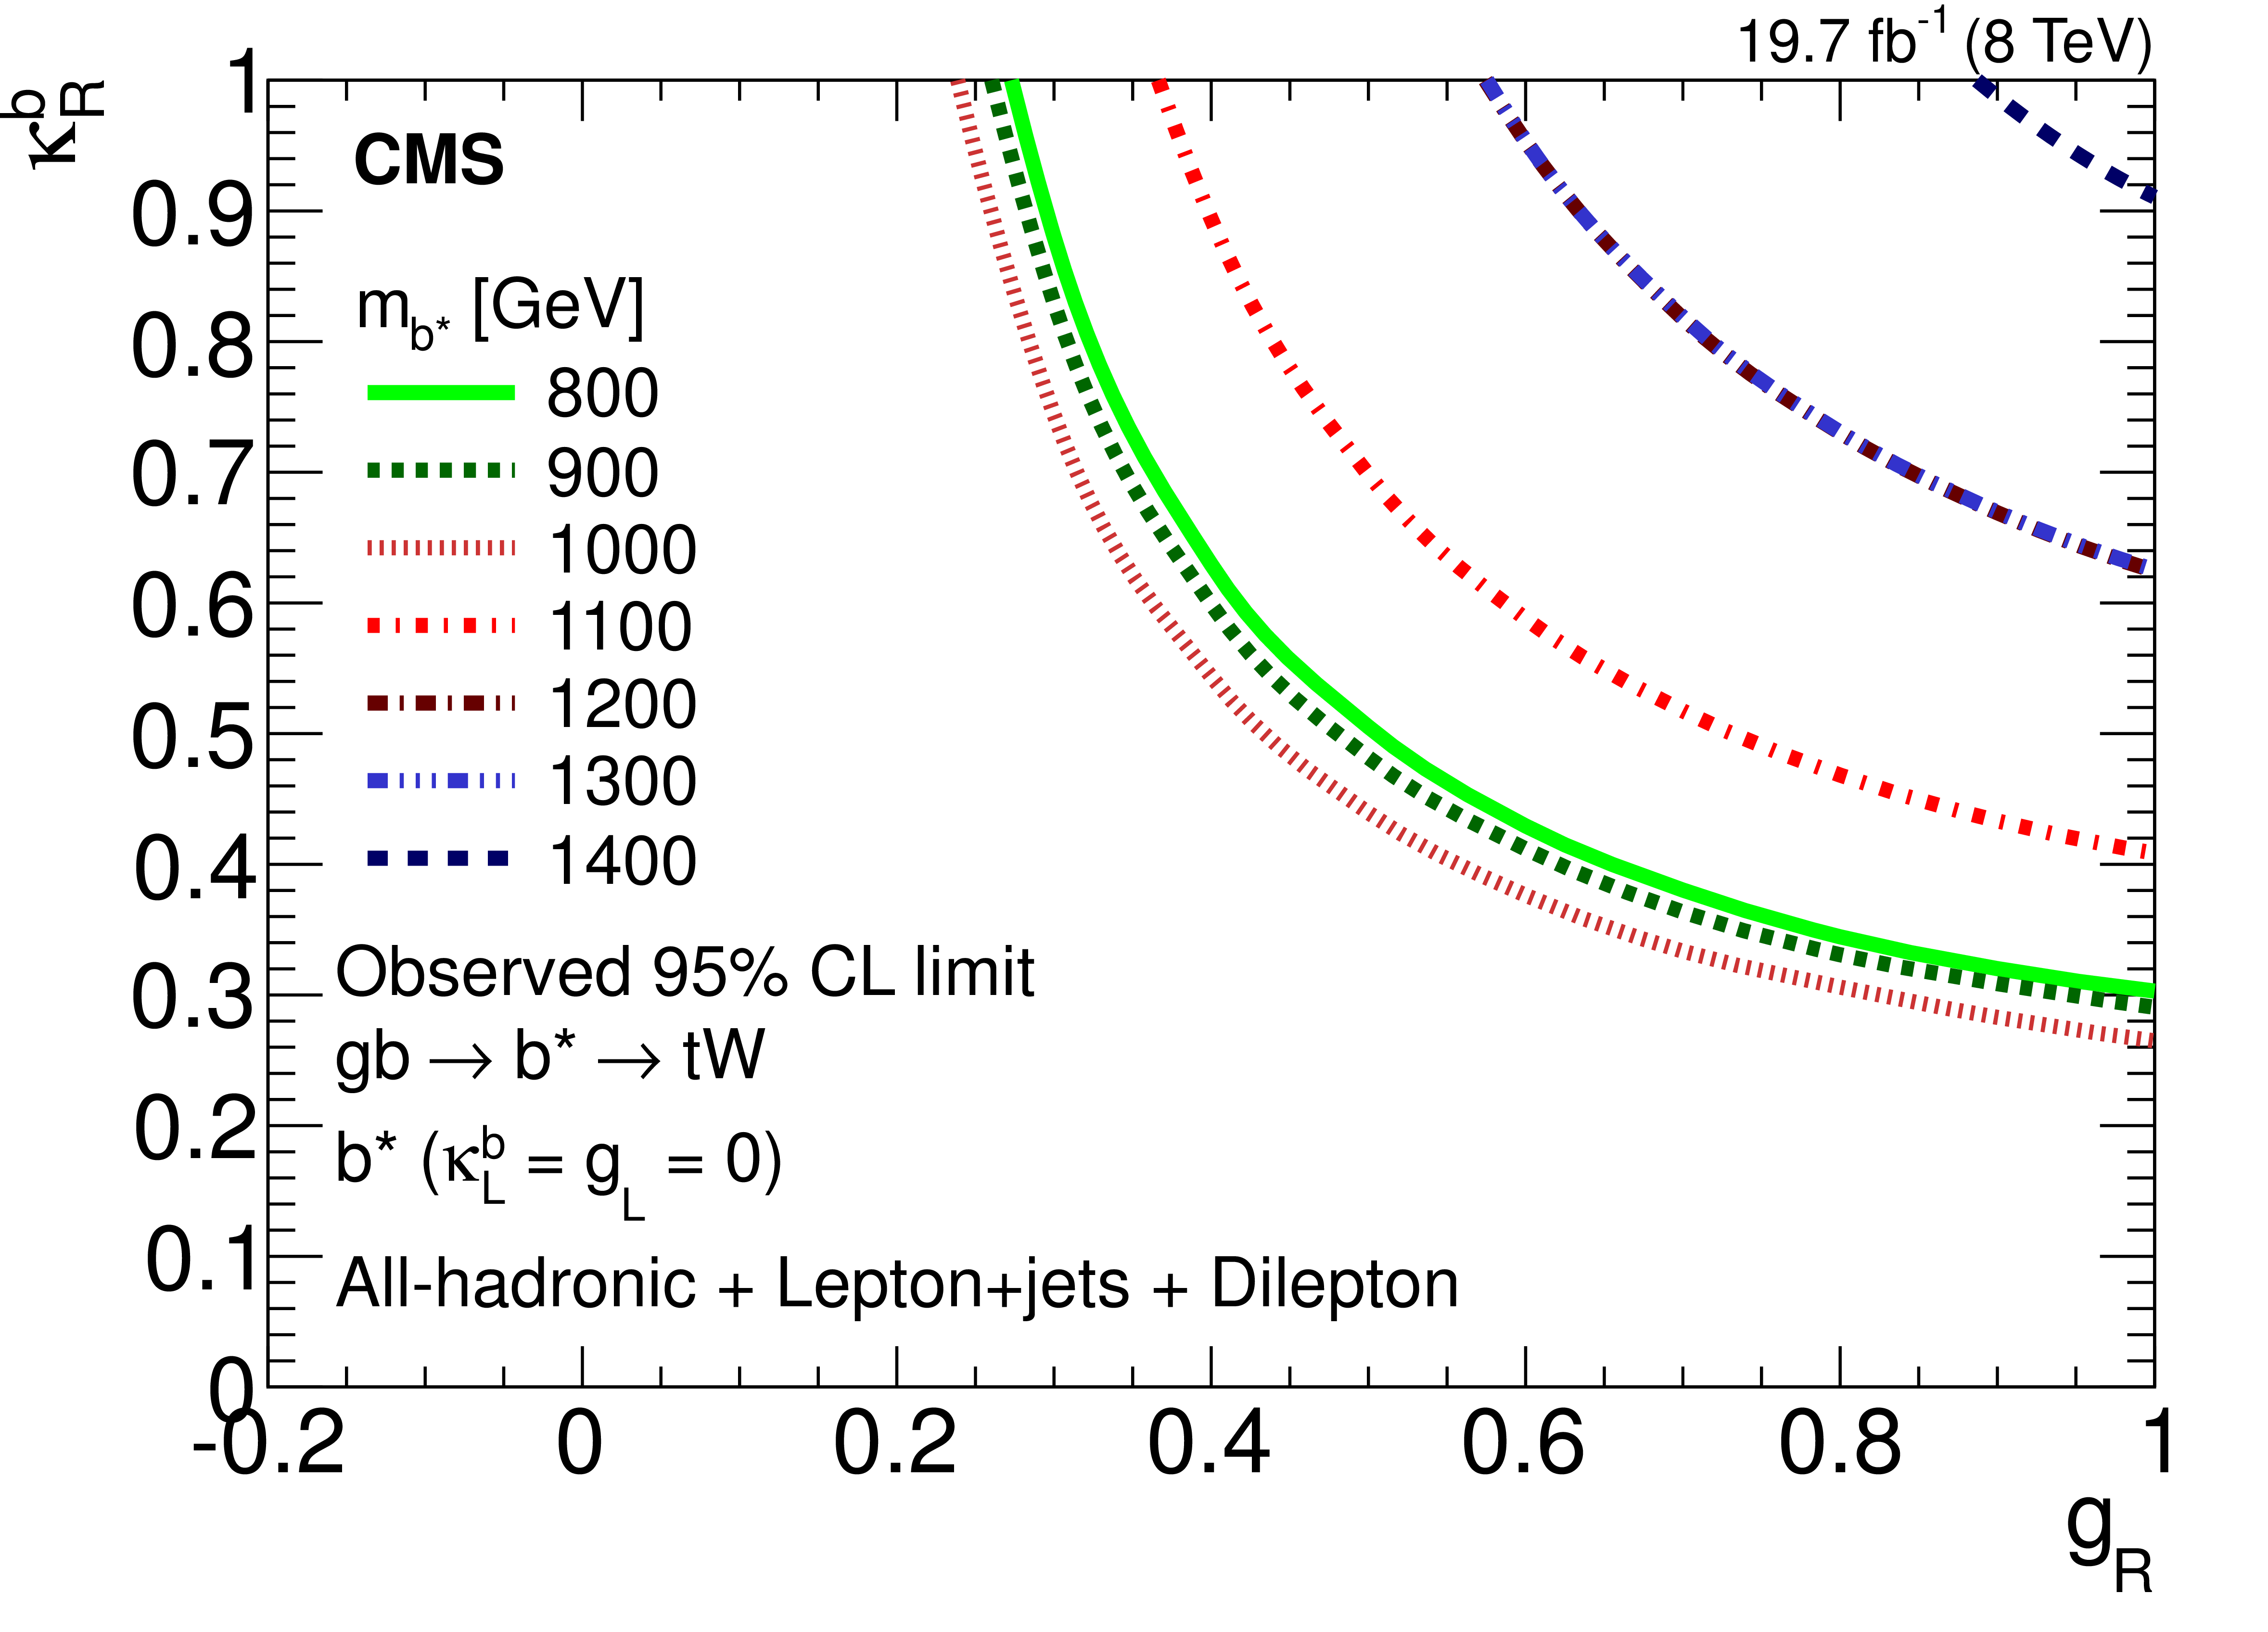
Figure 9-c:
Contour plots showing the lower limits on various values of the $ { {\mathrm {b}} ^*} $ quark mass, as a function of the couplings $\kappa $ and $g$. The (a,c,e) column shows the observed limits and the (b,d,f) column shows the expected limits. The limits for the left-handed, right-handed, and vector-like $ { {\mathrm {b}} ^*} $ quark coupling hypotheses are shown in the (a,b), (c,d), and (e,f) rows, respectively. The excluded regions are above and to the right of the curves. |

png pdf |
Figure 9-d:
Contour plots showing the lower limits on various values of the $ { {\mathrm {b}} ^*} $ quark mass, as a function of the couplings $\kappa $ and $g$. The (a,c,e) column shows the observed limits and the (b,d,f) column shows the expected limits. The limits for the left-handed, right-handed, and vector-like $ { {\mathrm {b}} ^*} $ quark coupling hypotheses are shown in the (a,b), (c,d), and (e,f) rows, respectively. The excluded regions are above and to the right of the curves. |
png pdf |
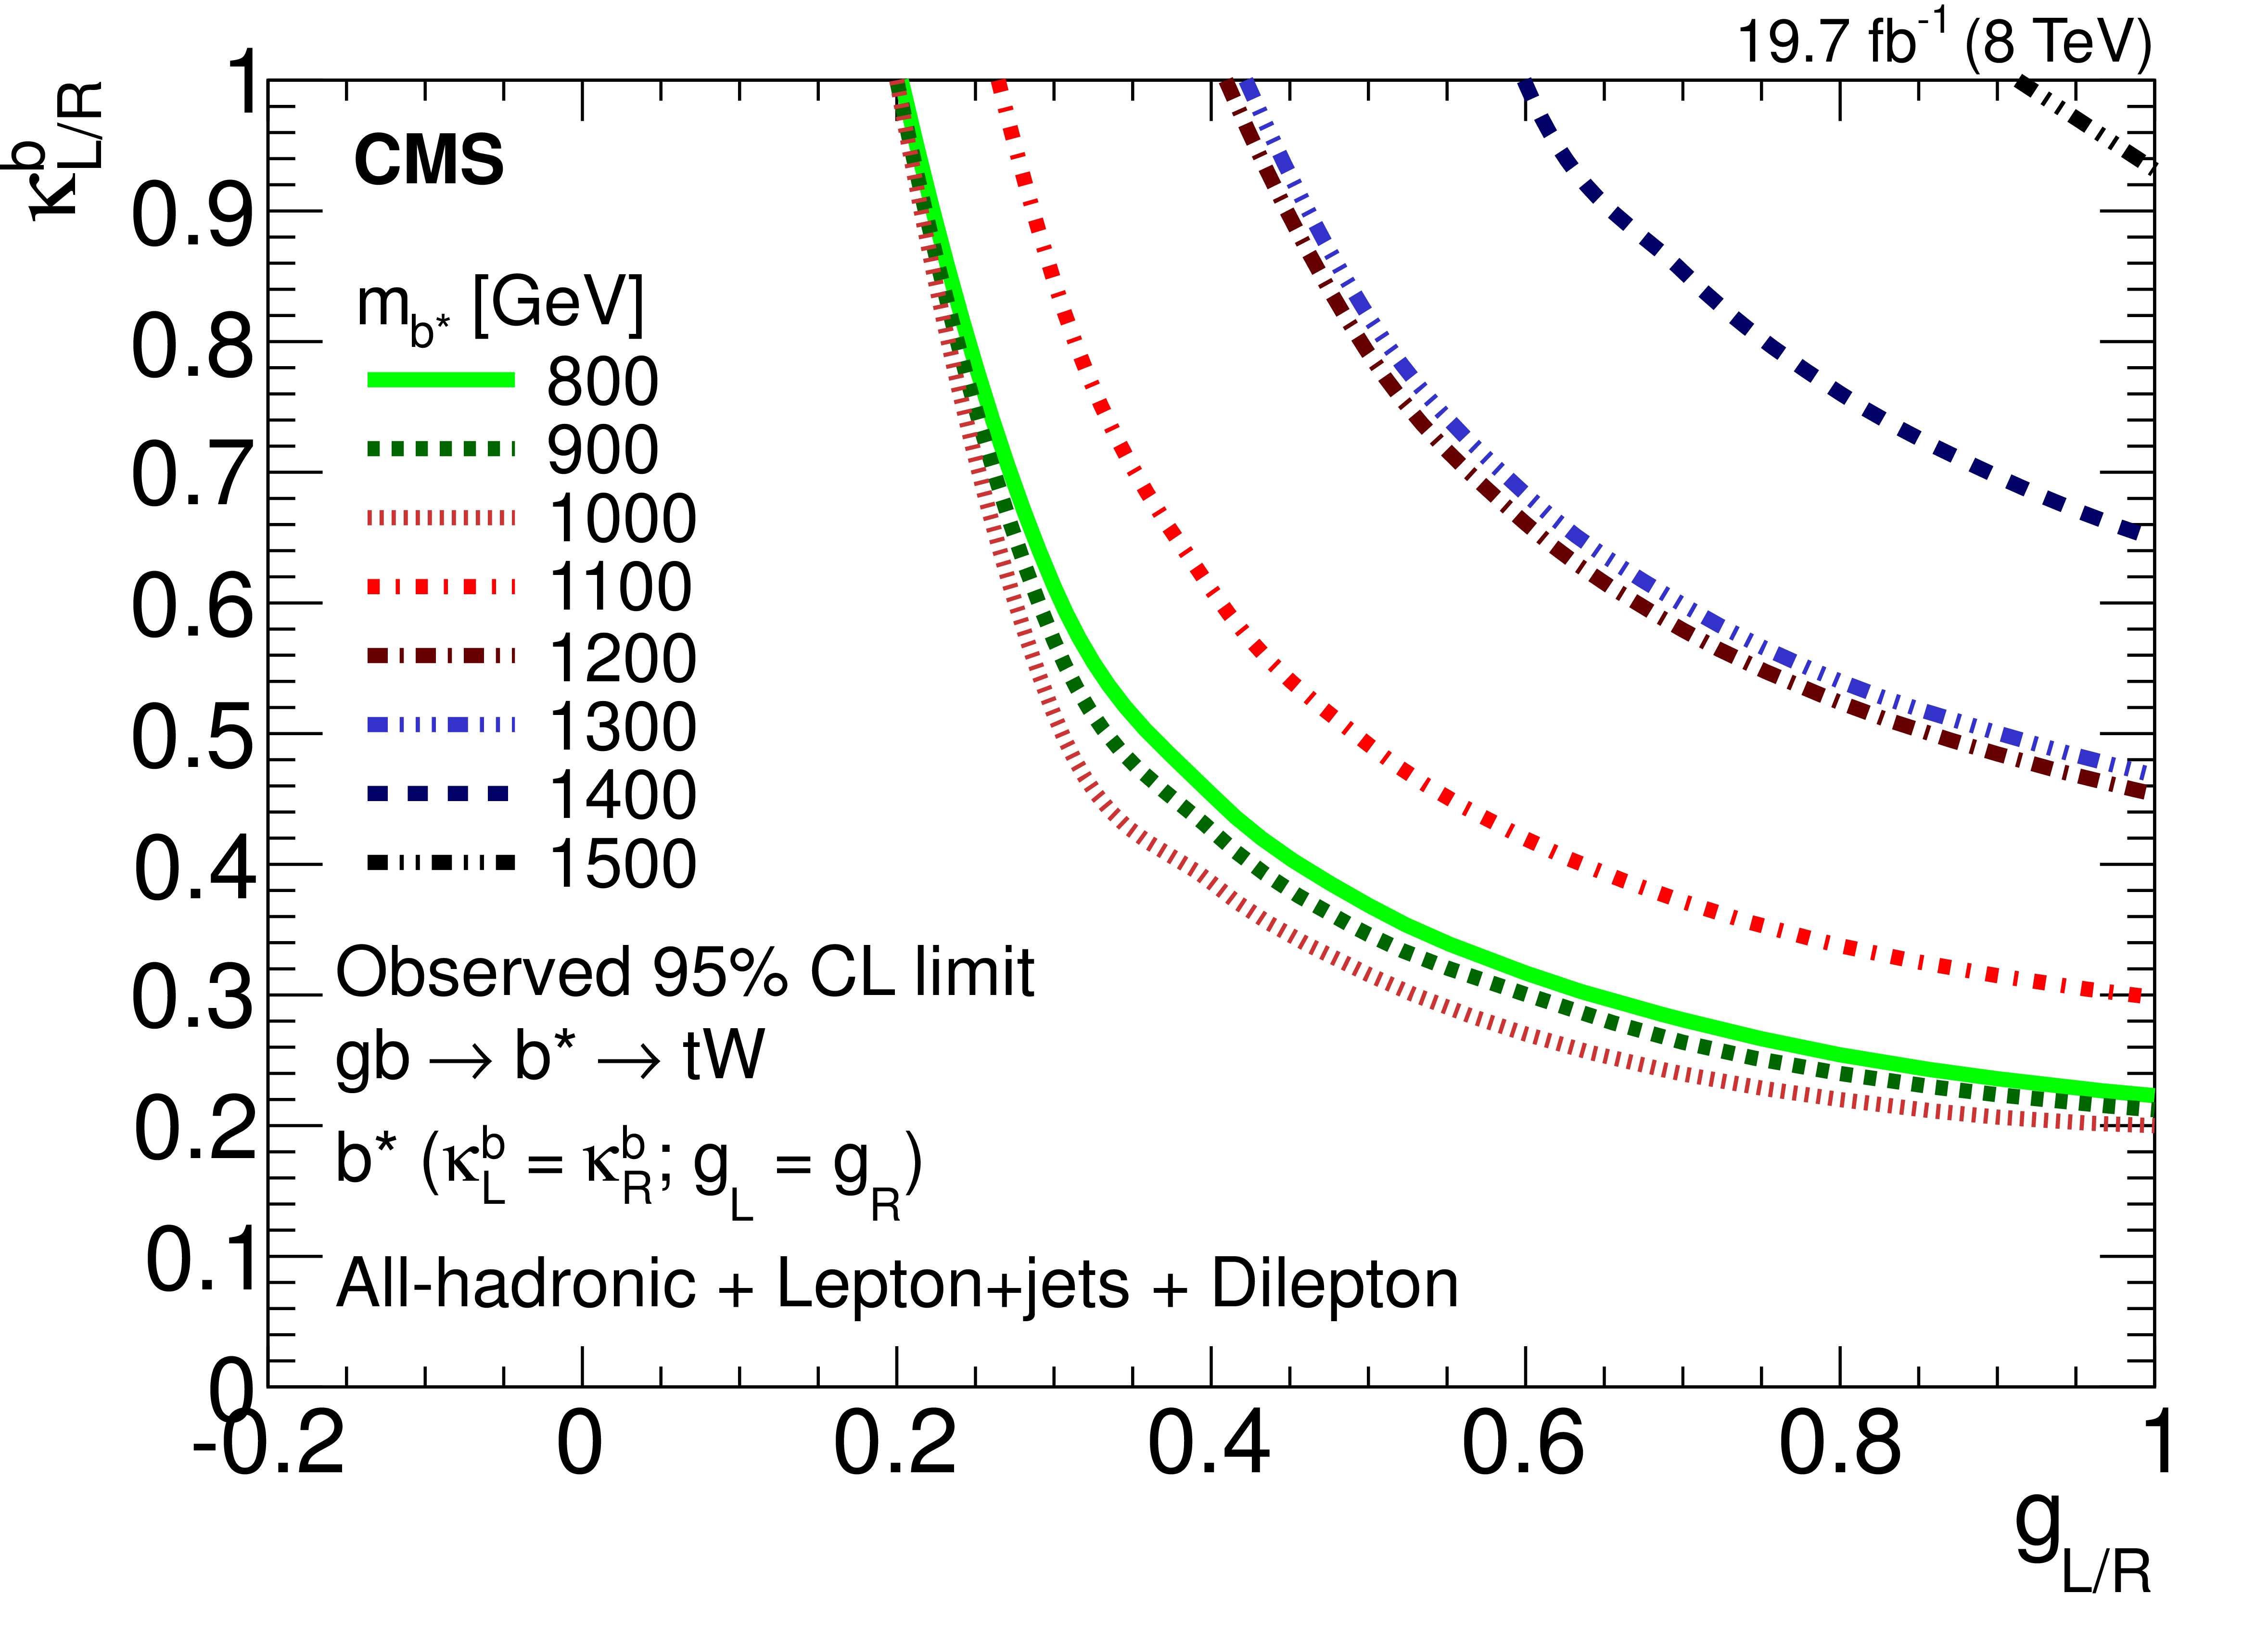
Figure 9-e:
Contour plots showing the lower limits on various values of the $ { {\mathrm {b}} ^*} $ quark mass, as a function of the couplings $\kappa $ and $g$. The (a,c,e) column shows the observed limits and the (b,d,f) column shows the expected limits. The limits for the left-handed, right-handed, and vector-like $ { {\mathrm {b}} ^*} $ quark coupling hypotheses are shown in the (a,b), (c,d), and (e,f) rows, respectively. The excluded regions are above and to the right of the curves. |
png pdf |
Figure 9-f:
Contour plots showing the lower limits on various values of the $ { {\mathrm {b}} ^*} $ quark mass, as a function of the couplings $\kappa $ and $g$. The (a,c,e) column shows the observed limits and the (b,d,f) column shows the expected limits. The limits for the left-handed, right-handed, and vector-like $ { {\mathrm {b}} ^*} $ quark coupling hypotheses are shown in the (a,b), (c,d), and (e,f) rows, respectively. The excluded regions are above and to the right of the curves. |
| Tables | |
png pdf |
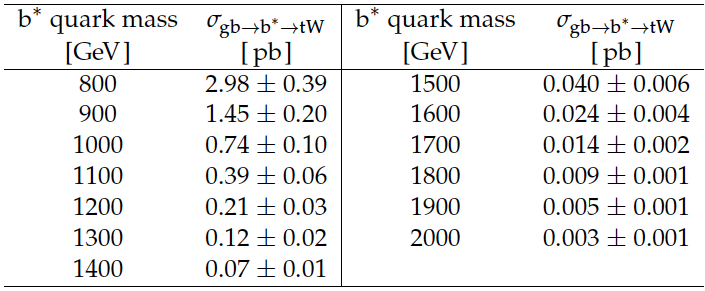
Table 1:
Estimates of the total cross section for $ {\mathrm {g}} {\mathrm {b}} \to { {\mathrm {b}} ^*} $ at a center of mass energy of 8 TeV times the branching fraction for $ { {\mathrm {b}} ^*} \to {\mathrm {t}} {\mathrm {W}}$ for $ { {\mathrm {b}} ^*} $ quark masses from 800 to 2000 GeV . The values are identical for left-handed and right-handed quark hypotheses. The uncertainties are determined by varying the factorization ($\mu _{F}$) and renormalization ($\mu _{R}$) scales simultaneously by a factor of 0.5 or 2 of their nominal value. The estimated cross section of a $ { {\mathrm {b}} ^*} $ quark with vector-like coupling is twice as large at each mass point as the value shown. |
png pdf |
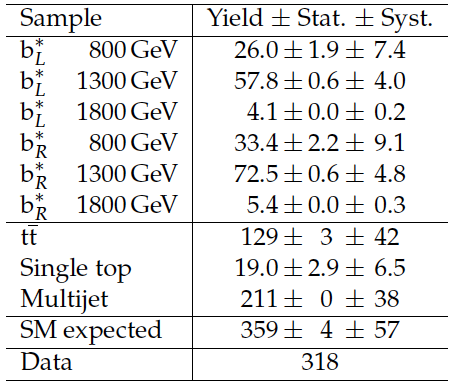
Table 2:
Event yields in the all-hadronic channel after the final selection, normalized to an integrated luminosity of 19.7 fb$^{-1}$. Both statistical and systematic uncertainties are shown. The systematic uncertainties are described in Section 6. |
png pdf |
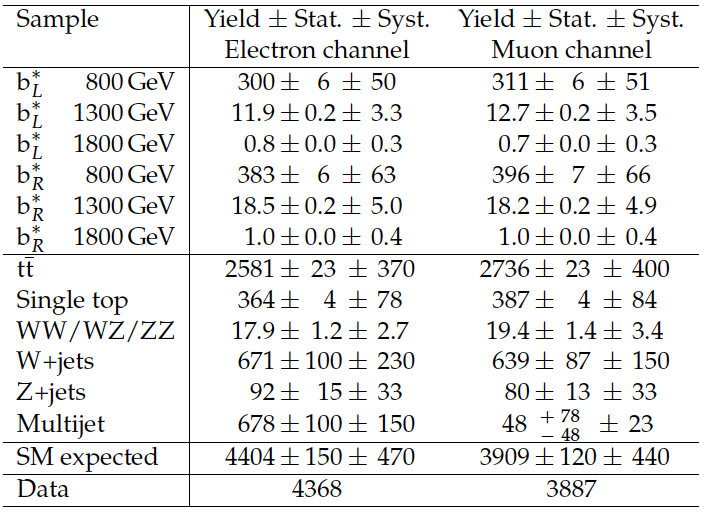
Table 3:
Event yields in the lepton+jets channel after the final selection, normalized to an integrated luminosity of 19.7 fb$^{-1}$. Both statistical and systematics uncertainties are included. The systematic uncertainties are described in Section 6. |
png pdf |
Table 4:
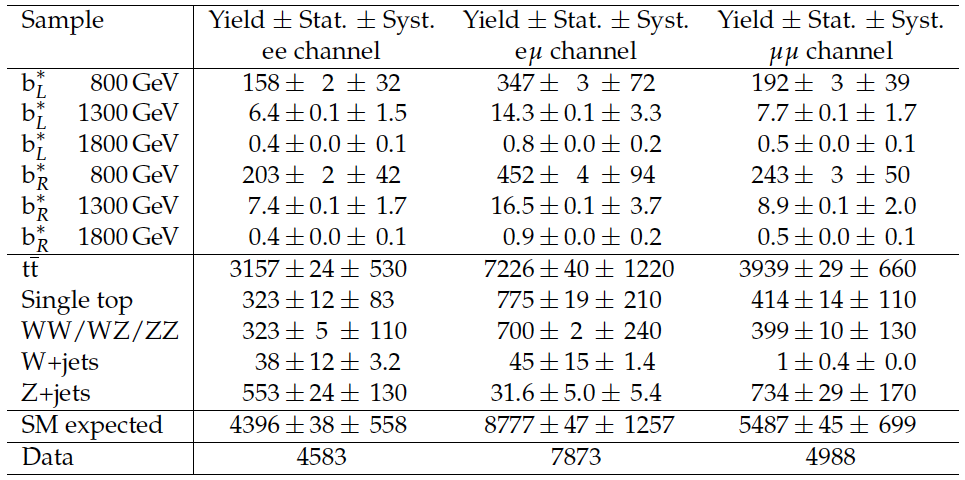
Event yields for the dilepton channel after the final selection, normalized to an integrated luminosity of 19.7 fb$^{-1}$. Both statistical and systematic uncertainties are included. The systematic uncertainties are described in Section 6. |
png pdf |
Table 5:
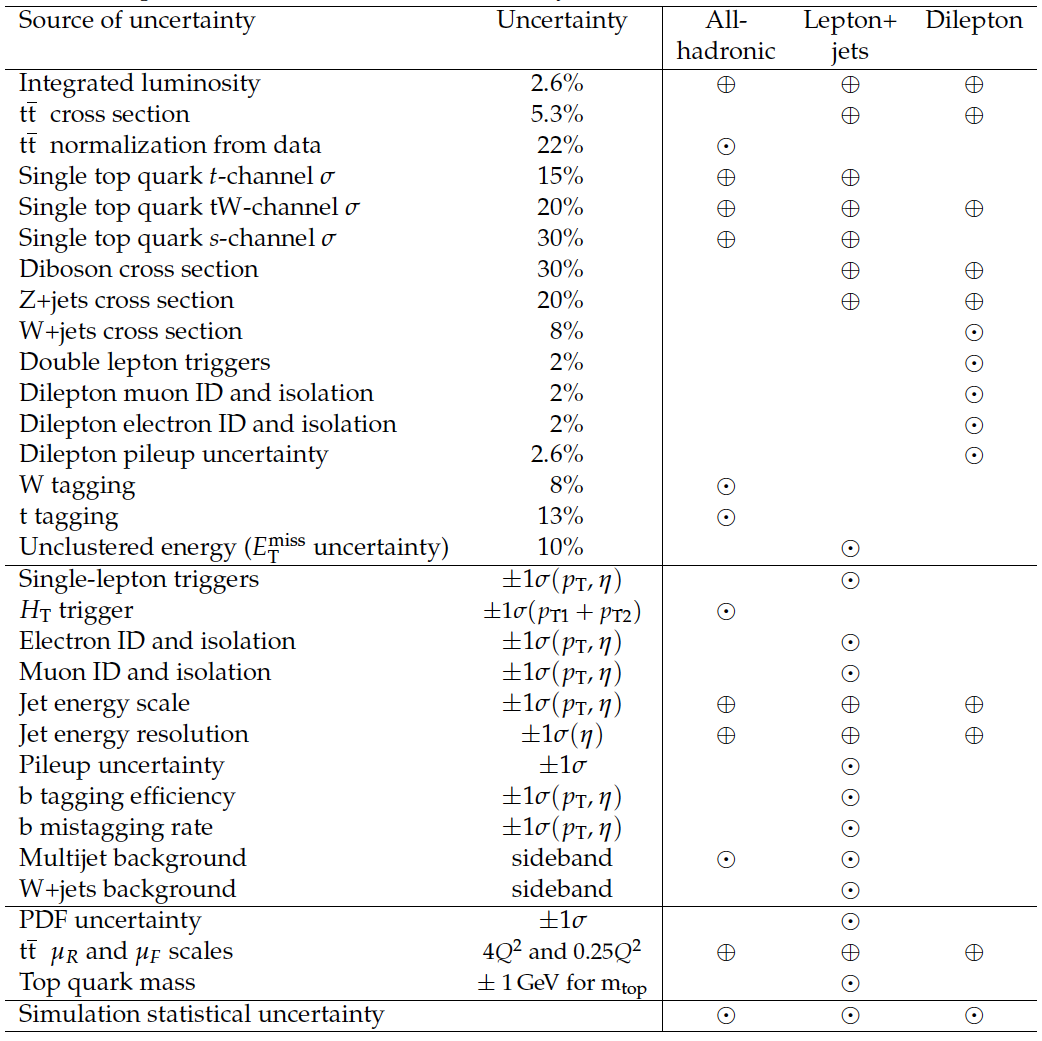
Sources of systematic uncertainty for the three analysis channels. For the shape-based uncertainties, the parameterization used for the uncertainty deviation is given in parentheses. Sources marked with "sideband" are measured from data, and contain various uncertainty sources. Uncorrelated uncertainties that apply to a given channel are marked by $\odot $. Uncertainties correlated between channels are marked by $\oplus $. The uncertainties varying as functions of variables in question are indicated if no uncertainty value is listed. |
png pdf |
Table 6:
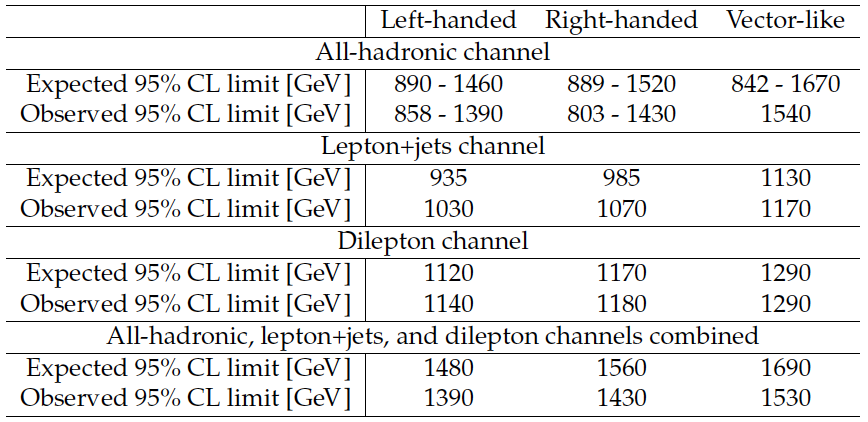
The limit at 95% CL, for the case of unit couplings, on $ { {\mathrm {b}} ^*} $ quark mass for the left-handed, right-handed, and vector-like coupling hypotheses in the all-hadronic, lepton+jets dilepton, and combined channels. For each domain, two numbers linked with a dash indicate the excluded $ { {\mathrm {b}} ^*} $ quark mass range, a single number indicates the excluded lower $ { {\mathrm {b}} ^*} $ quark mass limit. |
| Summary |
| A search for a singly produced $\mathrm{b}^*$ quark decaying to tW in the all-hadronic, lepton+jets, and dilepton final states has been performed using proton-proton collisions recorded by the CMS detector at $\sqrt{s} =$ 8 TeV, corresponding to an integrated luminosity of 19.7 fb$^{-1}$. No deviations that are inconsistent with standard model expectations are found in the various spectra of variables used to search for the signal in the three channels. Upper limits are set at 95% confidence level on the product of cross section and branching fraction for the production of a $\mathrm{b}^*$ quark that subsequently decays to tW. Excited bottom quarks are excluded with masses below 1390, 1430, and 1530 GeV for left-handed, right-handed, and vector-like $\mathrm{b}^*$ quark couplings, respectively. The mass limits are also extrapolated to the two dimensional $\kappa$-$g$ coupling plane. These are the most stringent limits on the $\mathrm{b}^*$ quark masses to date. |
|
|
Compact Muon Solenoid LHC, CERN |
|

|

|

|

|

|